Biden’s Fiscal Inferno! Treasury Warns Budget Deficit Up 13%, Debt Reaching $34 Trillion (Don’t Forget About $212.5 TRILLION In Unfunded Liabilities)

It‘s Biden’s Fiscal Inferno! Insane open borders, insane green spending, wars in Ukraine, Gaza and growing restlessness around Taiwan. Inflation. And a demented 81-year old President in charge.

The U.S. government ran a budget deficit of $381 billion so far into the 2024 fiscal year, which represents a 13% increase from this same time period last year.

The deficit is $44 billion higher than it was at the end of November 2022, according to the latest data released by the U.S. Department of the Treasury.

Congress passed a “laddered” continuing resolution in November with a final expiration date of February 2. Conservative House Republicans have been calling for a reduction in federal spending to reduce the budget deficit. Congress must pass another spending bill to keep the government funded past Feb. 2.

The specific cuts the House GOP is considering remains unclear at this time, but any reduction in spending is likely to hit roadblocks in the Democratic-led Senate. Senate Majority Leader Chuck Schumer, D-N.Y., has criticized previous GOP attempts to cut domestic spending levels.

In September, House Republicans were trying to cut annual spending by about $120 billion, which still would not balance the budget. Congressional Democratic leaders were critical of their approach at the time.

Senate congressional leaders are currently debating a foreign assistance package that would provide additional aid to Ukraine and Israel as well as humanitarian assistance for Palestinian refugees along with money for U.S. border security. Senate leaders said on Tuesday that both sides were closer to a deal, but a formal agreement hasn’t been reached yet.

“With regard to the border discussion, I think it’s pretty safe to say that we’ve made some significant progress, but we obviously aren’t there,” McConnell said at the Capitol during his weekly news conference on Tuesday.

On the House side, Republicans have argued that additional aid for Israel and Ukraine should be paid for or “offset” by equivalent spending reductions. Schumer has said that such foreign assistance does not need to be paid for since it is considered emergency spending.

Senators are still in Washington negotiating on the package but the House has left town for the holidays.

Scott Hodge, president emeritus and senior policy adviser at the Tax Foundation, a nonpartisan tax policy 501(c)(3) nonprofit, said the U.S. Treasury reporting a 13% increase in the deficit compared to November 2022 shows the U.S. government continues to go down the wrong path when it comes to fiscal policy.

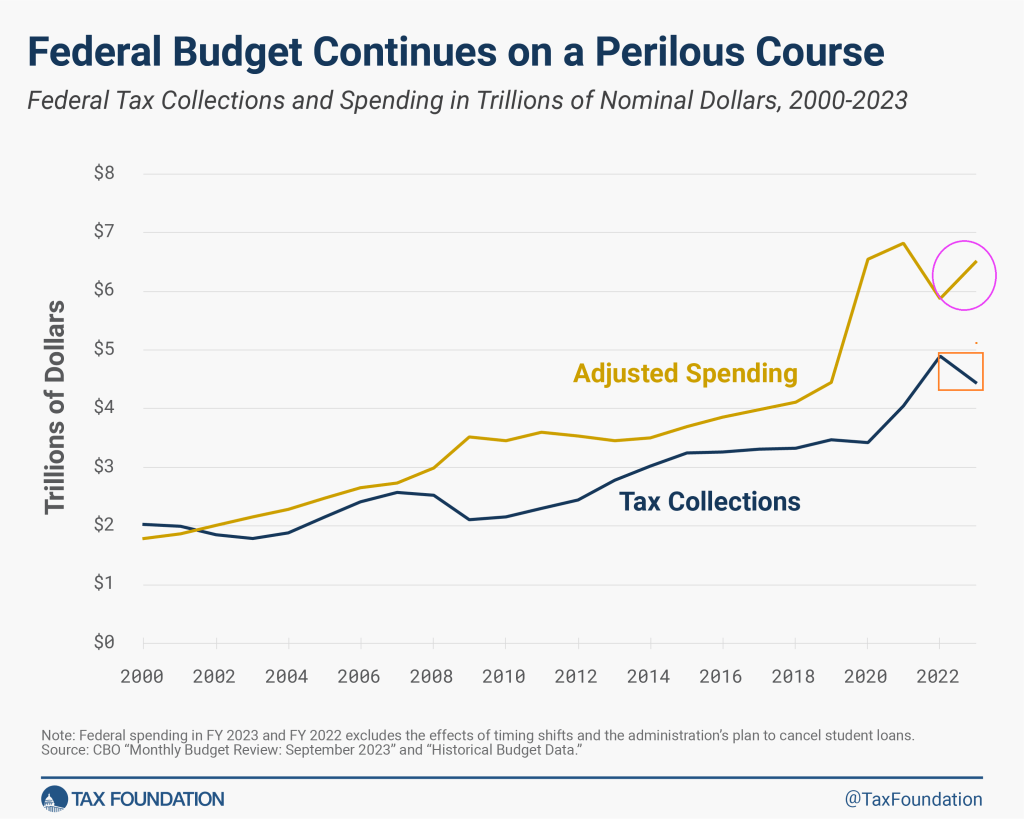
“It is being driven by federal spending, which is up by $152 billion, a 17% increase compared to the same month in 2022. The monthly deficit would have been worse if decent economic growth hadn’t boosted federal tax collections by $108 billion, or 19%,” Hodge told Just the News.

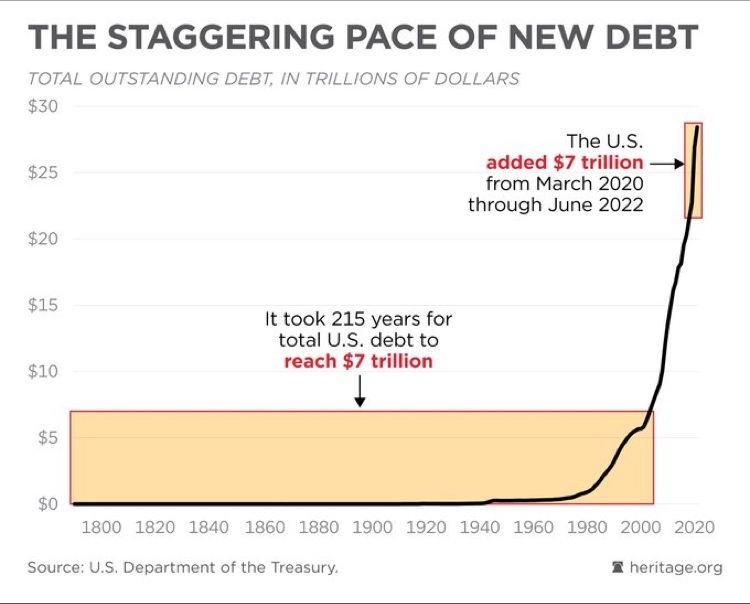
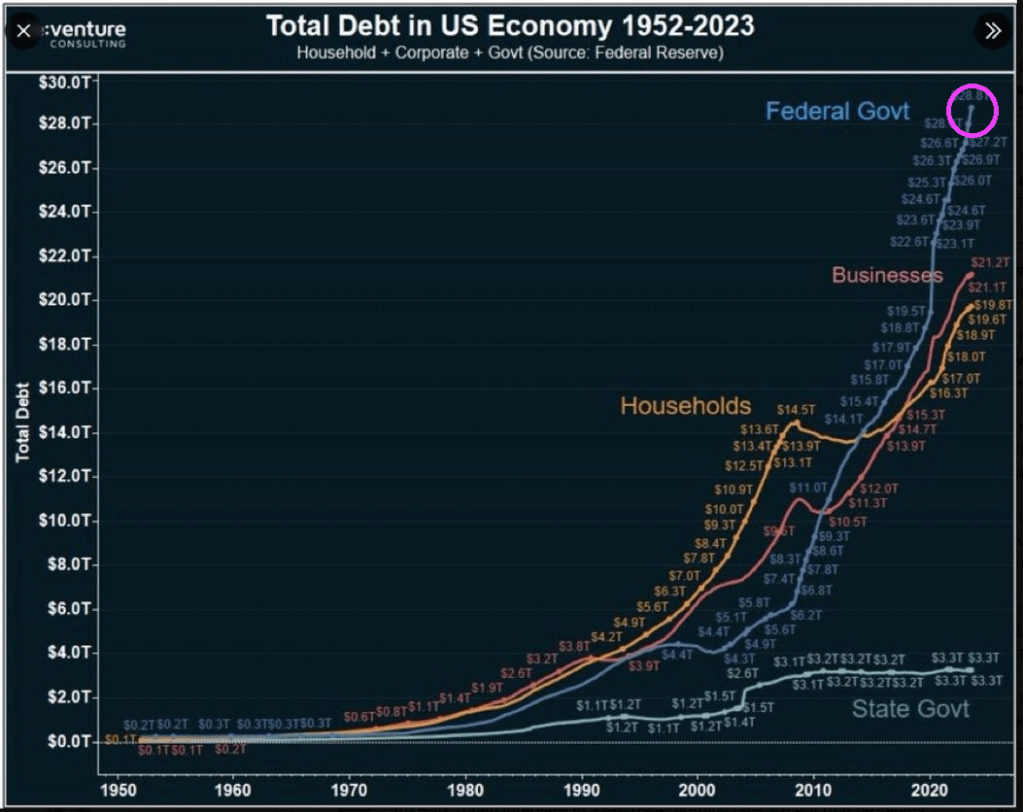
“The problem with the federal budget is basic math—the growth in spending continues to outpace the growth in tax collections. This is why our national debit is heading toward $34 trillion. It cannot go on forever without serious economic consequences,” he added.

Maya MacGuineas, president of the Committee for a Responsible Federal Budget, shared a similar perspective on the matter. “The longer we allow our debt to worsen, the less room we ultimately have to respond to the kinds of global emergencies we’re seeing in the world today,” she said.

“This leaves policymakers with a choice: make the hard choices today by paying for our priorities and putting the national debt on a sustainable trajectory, or saddle the next generation with an even worse situation,” she added.

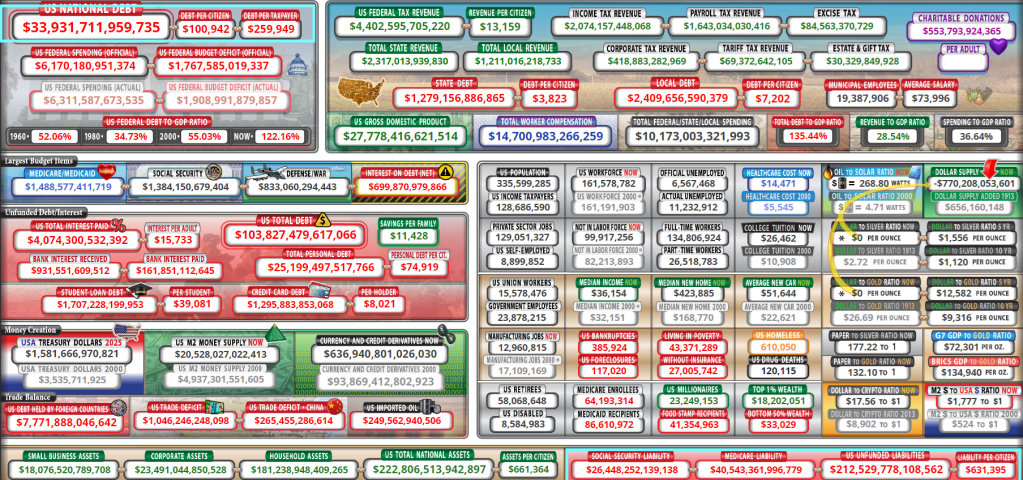
The national debt in January of 2020 was $17.2 trillion, according to historical data from the Peterson Foundation. By contrast, the national debt is currently $33.9 trillion, according to the U.S. Treasury.

And don’t forget that $212.5 TRILLION in unfunded liabilities.

US Existing Home Sales Decline -7.28% Since Last Year (UP 0.8% MoM)

For November, US existing home sales are down -7.28% since last year. At least that is an improvement over -14.6% YoY in October.

Despite homebuilder sentiment ticking up (along with their stock prices) and housing starts soaring – buoyed by a 100bps decline from multi-decade highs in mortgage rates – analysts expected a small 0.4% MoM decline in existing home sales in November (after October’s big drop).

Instead, existing home sales beat expectations by rising 0.8% MoM in November, which pulled the YoY decline up to just 7.28%…

Source: Bloomberg

“The latest weakness in existing home sales still reflects the buyer bidding process in most of October when mortgage rates were at a two-decade high before the actual closings in November,” said NAR Chief Economist Lawrence Yun. “A marked turn can be expected as mortgage rates have plunged in recent weeks.”

The total existing home sale SAAR bounced very marginally off record lows…

Source: Bloomberg

Regional sales were mixed:

  • Existing-home sales in the Northeast slipped 2.1% from October to an annual rate of 470,000 in November, down 13.0% from November 2022. The median price in the Northeast was $428,600, up 4.8% from the prior year.
  • In the Midwest, existing-home sales rose 1.1% from the previous month to an annual rate of 940,000 in November, down 8.7% from one year ago. The median price in the Midwest was $280,800, up 4.9% from November 2022.
  • Existing-home sales in the South improved 4.7% from October to an annual rate of 1.77 million in November, a decline of 4.3% from the prior year. The median price in the South was $351,500, up 3.4% from last year.
  • In the West, existing-home sales slumped 7.2% from a month ago to an annual rate of 640,000 in November, down 8.6% from one year before. The median price in the West was $603,200, up 5.3% from November 2022.

Mortgage rates are down, but leave a long way for home sale to drop still…

Source: Bloomberg

But, the gap between current rates and effective rates for Americans is still immense…

Source: Bloomberg

The median existing-home price for all housing types in November was $387,600, an increase of 4.0% from November 2022 ($372,700), but down MoM…

All four U.S. regions posted price increases.

“Home prices keep marching higher,” Yun added.

“Only a dramatic rise in supply will dampen price appreciation.”

Well, with housing starts accelerating in the latest data and Powell’s massive pivot, has The Fed re-ignited its 3rd housing bubble?

And the buying condition for housing sinks to all-time low.

Mortgage Purchase Demand Falls To 1995 Levels (-4% WoW, -18% YoY)

You better think twice! Mortgage demand has fallen to its lowest level since 1995.

Mortgage applications decreased 1.5 percent from one week earlier, according to data from the Mortgage Bankers Association’s (MBA) Weekly Mortgage Applications Survey for the week ending December 15, 2023.

The Market Composite Index, a measure of mortgage loan application volume, decreased 1.5 percent on a seasonally adjusted basis from one week earlier. On an unadjusted basis, the Index decreased 3 percent compared with the previous week.  The seasonally adjusted Purchase Index decreased 1 percent from one week earlier. The unadjusted Purchase Index decreased 4 percent compared with the previous week and was 18 percent lower than the same week one year ago.

The Refinance Index decreased 2 percent from the previous week and was 18 percent higher than the same week one year ago.

The average contract interest rate for 30-year fixed-rate mortgages with conforming loan balances ($726,200 or less) decreased to 6.83 percent from 7.07 percent, with points increasing to 0.60 from 0.59 (including the origination fee) for 80 percent loan-to-value ratio (LTV) loans.

Fire! November US Housing Starts Explode +14.8% In November As New Home Prices Collapse By -20% YoY

There is a sudden fire in housing as housing starts soar in November.

Housing Starts:
Privately‐owned housing starts in November were at a seasonally adjusted annual rate of 1,560,000. This is 14.8 percent above the revised October estimate of 1,359,000 and is 9.3 percent above the November 2022 rate of 1,427,000. Single‐family housing starts in November were at a rate of 1,143,000; this is 18.0 percent above the revised October figure of 969,000. The November rate for units in buildings with five units or more was 404,000.

Building Permits:
Privately‐owned housing units authorized by building permits in November were at a seasonally adjusted annual rate of 1,460,000. This is 2.5 percent below the revised October rate of 1,498,000, but is 4.1 percent above the November 2022 rate of 1,402,000. Single‐family authorizations in November were at a rate of 976,000; this is 0.7 percent above the revised October figure of 969,000. Authorizations of units in buildings with five units or more were at a rate of 435,000 in November.

Median NEW home prices dropped -20% YoY.

1-unit housing starts exploded, but permits declined.

Housing Market Index Remains Depressed Under Bidenomics As Federal Debt SOARS (Its A Long Way To The Bottom!)

As AC/DC sang; “Its a long way to the top bottom.” But Bidenomics is sending us there!

Today, the NAHB/Wells Fargo Housing Market Index rose slightly on falling mortgages. But the housing market index remains depressed since Biden seized the reigns of power in 2021.

The Federal government added $7 trillion in debt since 2020 while it took 215 years to get to $7 trillion before Covid and Bidenomics.

In what can simply be called fiscal insanity, The Federal government is borrowing like there is no tomorrow (given that Biden is 81 years old, this isn’t far off) displacing businesses and households. Heaven help us if the Federal government has to borrow more money to fight a real war like World War II.

So, the massive Federal debt gorging isn’t helping the housing market.

Fiscal Inferno! Banks Draw On Term Funding Program (BTFP) As Consumer Sentiment Remains Bleak (Newsom Defaults On $20 BILLION Federal Loan)

Both the US Federal government and California’s government are facing a fiscal inferno. Thanks to a softening economy and inane fiscal policies.

At the macro level, we see that The Federal government has gone wild spending money and borrowing it. Much more than businesses and households. Biden’s wild spending reduces the degrees of freedom that Treasury has if the US slips into another recession or depression.

First, let’s begin with banks to illustrate the worsening condition of the economy. Emergency loans from The Fed’s Bank Term Funding Program (BTFP) is on the rise, signaling perceived trouble in the economy.

Small banks are suffering more than big banks.

Consumer sentiment is below 70 (100 baseline) under Biden and Bidenomics.

And then we have Gavin “Gruesome” Newsom and California. California is now facing a $68 billion deficit. It has also defaulted on a $20 billion loan from the federal government. The situation is so dire the state is telling agencies not to replace broken printers or re-stock office supplies. Workers are being stripped of benefits and could face furloughs. This is all happening as the state has spent billions funding High-Speed Rail and expanding Medi-Cal to all undocumented immigrants, while losing billions in tax revenue from people leaving the state.

$68 billion is over twice this forecast deficit of $24 billion.

But never fear. “Billions Biden” will make sure California is okay, ar least until the 2024 Presidential election.

Financing Bidenomics! The Good, The Bad And The Ugly (Rising Bond Total Returns, Rising Refinancing Costs, Falling Mortgage Purchase Demand)

Like the spaghetti western “The Good, The Bad And The Ugly,” Bidenomics has had similar effects on financing. Some good, some bad and a lot of uglies.

The good! For investors like pension funds the own US Treasuries, inflation has led The Federal Reserve to raise interest rates. This is good for investors holding short-term debt. The Bianco Fixed Income Total Return Index is soaring!!

The Bad: Well, the flip-side of the same coin is that debt refinancing costs have soared.

The Ugly. There are many contenders for losers under Bidenomics and current Fed (garbled) policies. But I choose … mortgage demand collapse with rising home prices and rising mortgage rates. Mortgage rates are up 165% under Biden.

And mortgage demand (applications) have been crushed.

Also on the ugly side, global aggregate corporate yields have collapsed.

So, there have been winners with Bidenomics (the top 1%), and lots of losers.

US Investment-grade Bond Yields Have Biggest Two-day Drop Since April 2020 And Covid Economic Shutdown (10Y-2Y Treasury Curve Remains Steeply Inverted)

It has been over three years since the disastrous Covid economic shutdowns of 2020. And here we are again!

US investment-grade bond yields have just had the biggest two-day drop since April 2020.

And the US Treasury 10Y-2Y curve remains steeply inverted.

Help me Jerome!

The Empire Strikes Out! Empire Fed Manufacturing Unexpectedly Crashes Into ‘Contraction’ (Falls To -14.5!)

The Empire (State) Strikes Out! Contraction (or economic slowdown) is hitting New York State!

After three strong ‘beats’ in a row, the Empire State Manufacturing Survey crashed back into contraction, well below expectations in December (from +9.1 to -14.5, +2.0 exp).

The drop takes the measure from ‘expansion’ at 7-month-highs to ‘contraction’ at 4-month-lows…

Source: Bloomberg

The new orders fell six points to -11.3, pointing to a decline in orders for a third consecutive month, and the shipments index fell sixteen points to -6.4, indicating that shipments fell.

The unfilled orders index held steady at -24.0, a sign that unfilled orders continued to fall significantly.

After rising into positive territory last month, the inventories index retreated fourteen points to -5.2, suggesting that inventories moved lower.

The delivery times index dropped ten points to -15.6, its lowest reading in several years, a sign that delivery times shortened.

The index for number of employees fell four points to -8.4, its lowest level in several months, pointing to a modest decline in employment levels.

On the bright side, the prices paid index moved down six points to 16.7, suggesting an ongoing moderation in input price increases, while the prices received index held steady at 11.5, a sign that selling price increases remained modest.

Is this the start of ‘soft’ data’s reversion to ‘hard’ reality?

The Fed – with its six rate-cuts – better hope so.

Using PF Flyer Decoder Ring To Decode Powell’s Fed Message

Yes, you need a PF Flyer magic decode ring to decode Powell’s latest message.

This week’s central-bank bonanza brings with it the usual set of ambiguous and often impenetrable statements and press conferences.

Traders and investors must spend precious time deciphering them. For those who wouldn’t mind a break from this parlor game, there are some markets that don’t march to the beat of the global policy cycle, and offer diversification benefits for portfolios.

The game was in full flow at Wednesday’s Federal Reserve meeting, as the central bank patiently unpicked the higher-for-longer stitching it had spent many months carefully inculcating in the market.

Anyone who had listened to it on financial conditions, keeping rates restrictive for an extended period, or who thought Powell meant it when he implied he was a Paul Volcker and not an Arthur Burns, is now left trying to figure out if the Fed’s reaction function has indeed changed.

Adding confusion to the game are the dots. They reinforced the dovish message, with the median dot implying three cuts next year versus two back in September.

But with one dot implying six cuts, two implying none and the rest all spread in between, this isn’t exactly sure-footed clarity.

It’ll be repeated again today with the ECB, BOE, the SNB and the Norges Bank all meeting to set rates (the SNB held rates steady and the Norges unexpectedly hiked). For those who can trade only G7 markets, there is not much choice but to play the game.

However, for those looking for markets less reliant on the Delphic utterances of central bankers, there are other options.

The problem is that most bond markets tend to be quite alike over the medium-to-longer term.

Interest rate cycles are typically quite synchronized (with the US the most influential), and capital can flow freely around most of the world.

To show the broad uniformity of bond markets we use a statistical tool called principal component analysis.

PCA is a way of making sense of large data sets. For instance, a retailer may have reams of data on how users use its website: how long they spend on it, which pages they visit, where they hover their mouse, etc. PCA will tell you which input – or combination of inputs – has the greatest explanatory power in determining the total time users spend on the website (something they would want to maximize).

Using PCA on yields from 40 countries, we can show that over half of global bond market moves are described by just one factor.

This not a trivial result. It means we could replace our data on 40 bond markets by this one component and it would capture more than half of the variance of the individual yields.

A bond market that was similar to this component would therefore be a good proxy for the global bond market. However, as the mathematician Carl Jacobi advised, we should always invert. A more interesting question is: which bond markets look least like this factor?

The chart below shows how each of the 40 bond markets are correlated to the first PCA factor. Most have a high correlation – more than 75% – but what stands out is the handful of markets with a low or negative correlation.

Japan and Turkey are among those with a negative correlation, while China’s correlation is close to zero.

This is intuitive.

Japan has been running a deliberately counter-cyclical monetary policy, while Turkey until recently was running a through-the-looking-glass one, cutting rates in the face of rampant inflation. And China’s economy is in deflation, at odds with every other major DM and EM country.

The above analysis provides analytical backing for the intuition that Japan et al have provided diversification for global bond portfolios in recent years, while most other markets, e.g. Europe, the US, Australia, New Zealand, etc are low-resolution facsimiles of each other and therefore have delivered few diversification benefits.

Of course, there will be other things to consider before adding a country’s bond index to a portfolio, such as how overbought or oversold it is, how liquid it is, the expected stance of the central bank, and so on.

But if the correlations persist, such a market should produce a more resilient and lower-volatility bond portfolio.

We can extend this analysis to look at stocks.

Global equity markets are even more similar to one another than bond markets, with the first component explaining 60% of the total move. Nonetheless, applying PCA offers up some portfolio diversification candidates (using as our data set MSCI country indices in USD).

Indeed, it can be shown that the first PCA component of equity markets is highly correlated to the US’s manufacturing ISM, elegantly demonstrating that in large part global stocks are driven by macro.

Indonesia, UAE and Chile’s stock markets are all negatively correlated to the global equity move, and therefore the global macro cycle, while European markets move almost in lockstep with it. As the chart below shows, Indonesia’s market (white line) remained supported in late 2022/23, as its market bottomed in July 2022 and rallied through, while other markets went on to make a new low in October of that year.

Indonesia et al also have had among the lowest returns of all global equity markets this year. It is relatively common for the markets that are among the worst performers one year to be the among the top the following year.

We can complete the analysis by looking at commodities.

The first PCA component here explains about half the move of all commodities, a similar proportion to global bond markets. PCA shows that precious metals, such as gold, silver and platinum are the most negatively correlated to commodities.

As almost all commodities are traded in dollars, the first component is quite similar to the DXY.

So to some extent we are asking which commodities are most negatively correlated to the dollar. Precious metals typically exhibit a more negative dollar correlation than most other commodities. Further, in the current environment they should offer some protection against inflation.

The lack of variation among macro-driven markets makes portfolio investment challenging as it is easier to add risk rather than uncorrelated factors.

The above PCA analysis shows that Japanese bonds, Indonesian equities and platinum are examples of assets that may confer some diversification advantages for global portfolios.

At the very least, you may not have to pay as much attention to central bankers.

The magic Fed Decoder ring!

No, that isn’t Mike Pence, RINO from Indiana.