The Fed Killed Inflation? US Home Prices Surged For 9th Straight Month In October (+4.8% YoY), Led By Miami And Detroit(?)

So much for “The Fed killed inflation” narrative. Inflation is still alive and well in housing prices. Particularly in cities like Miami and Detroit? Maybe the Lions winning their division for the first time in 30 years helped!

The S&P CoreLogic Case-Shiller U.S. National Home Price NSA Index, covering all nine U.S. census divisions, reported a 4.8% annual change in October, up from a 4% change in the previous month. The 10-City Composite showed an increase of 5.7%, up from a 4.8% increase in the previous month. The 20-City Composite posted a year-over-year increase of 4.9%, up from a 3.9% increase in the previous month. Detroit reported the highest year-over-year gain among the 20 cities with an 8.1% increase in October, followed again by San Diego with a 7.2% increase. Portland fell 0.6% and remained the only city reporting lower prices in October versus a year ago.

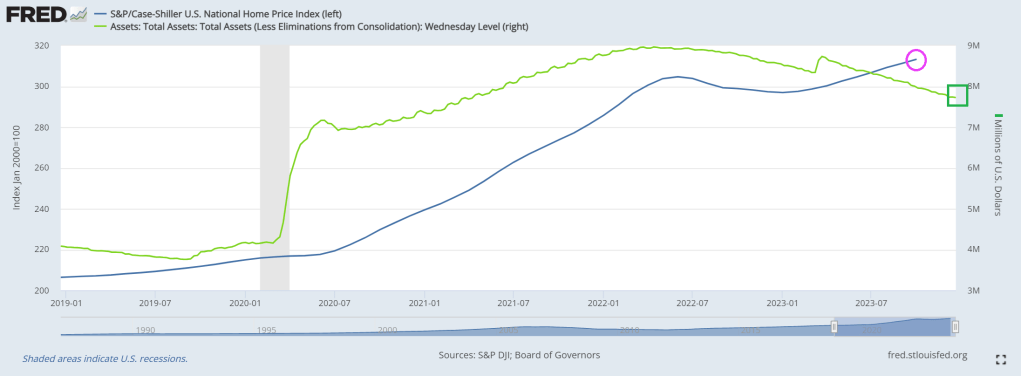
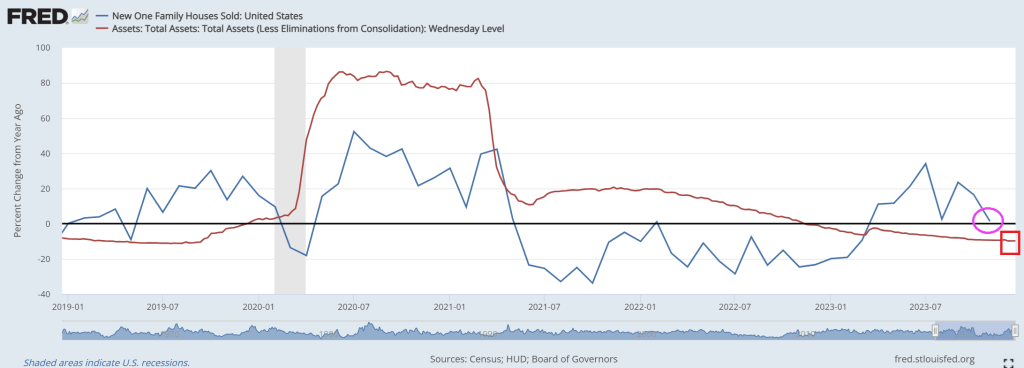
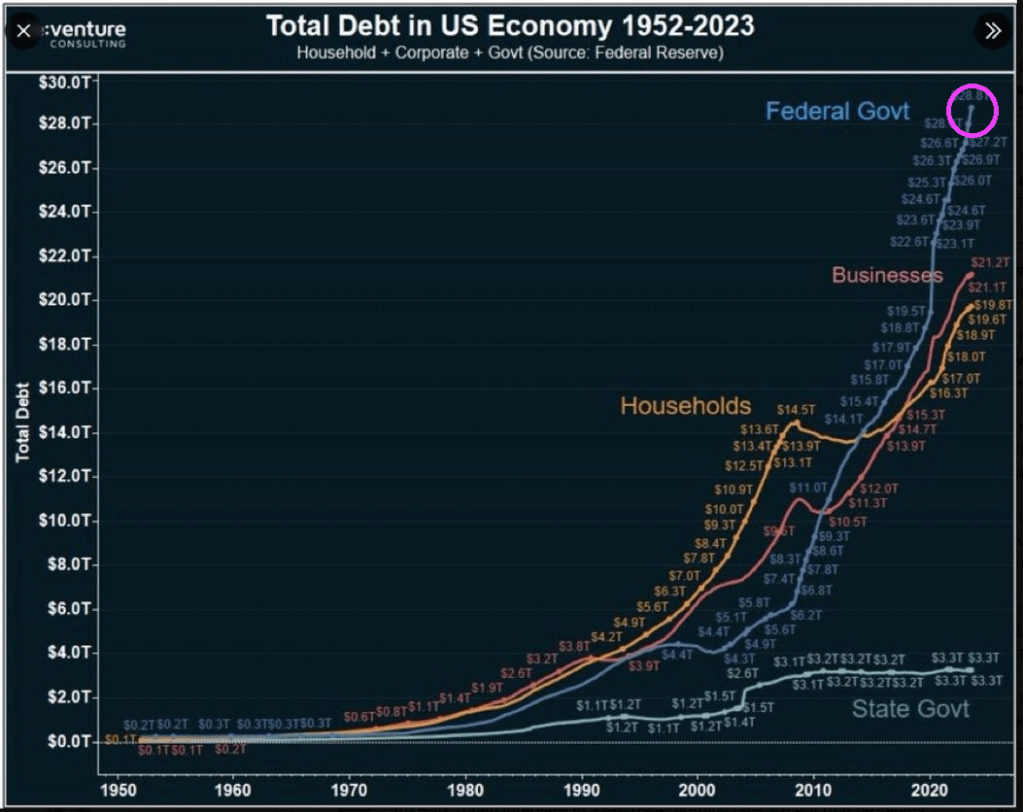
The Case-Shiller National Home Price index was up 4.8% in October as The Federal Reserve keeps its monstrous foot on the balance sheet pedal.

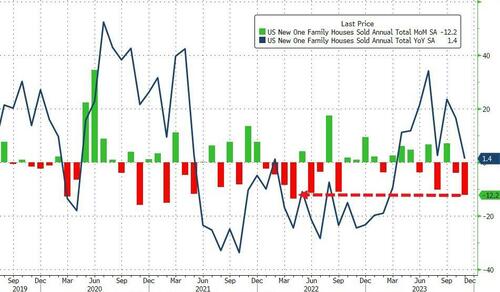
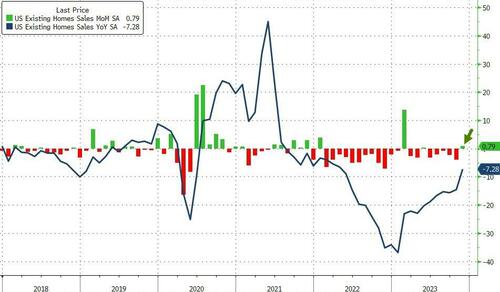
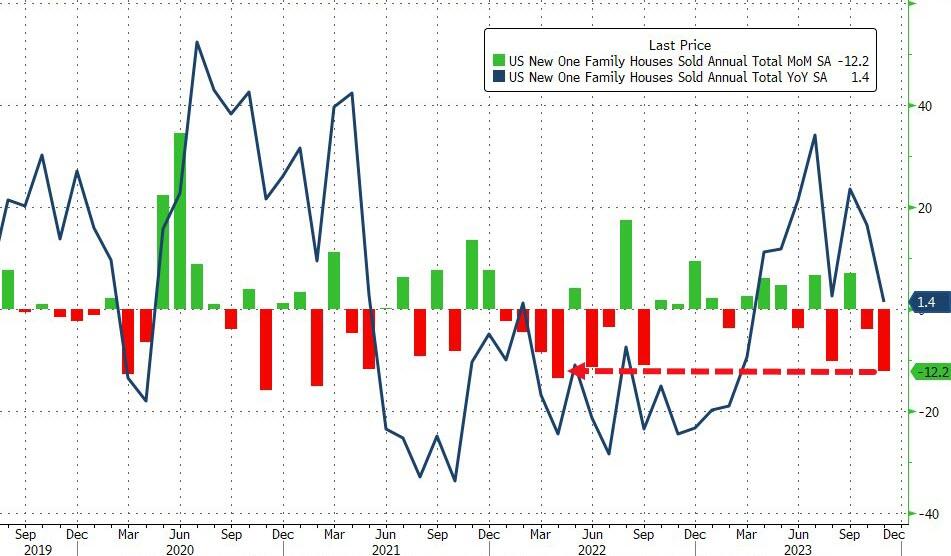
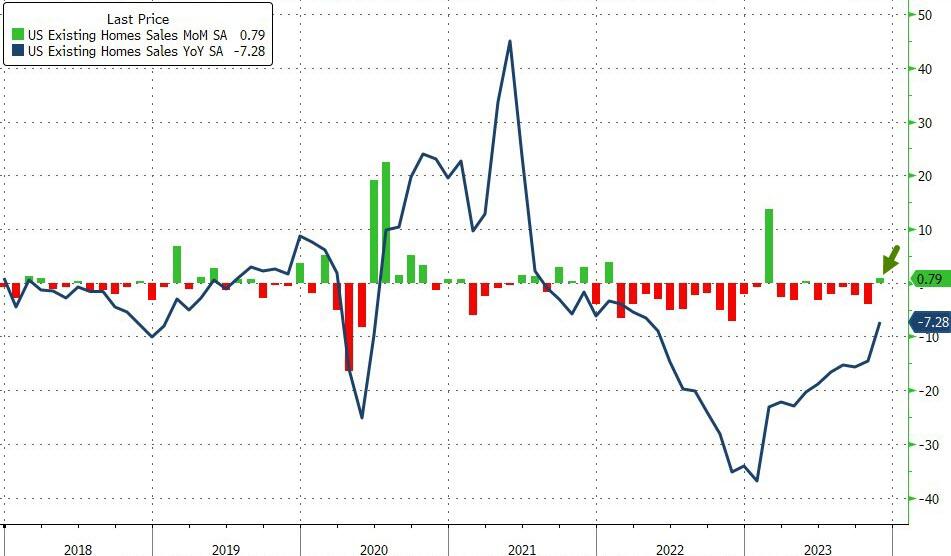
Home prices in America’s 20 largest cities rose for the 9th straight month in October (the latest data released by S&P Global Case-Shiller today), up 0.64% MoM (slightly better than the +0.60% MoM expected).

That pushed the YoY rise in prices up 4.87% – the fastest pace since Dec ’22…

Source: Bloomberg

…but as the chart shows the MoM gains are slowing rapidly.

“U.S. home prices accelerated at their fastest annual rate of the year in October”, says Brian D. Luke, Head of Commodities, Real & Digital assets at S&P DJI.

“We are experiencing broad based home price appreciation across the country, with steady gains seen in nineteen of twenty cities.”

Miami and Detroit saw the biggest MoM gains while the West Coast dominated the MoM price declines with San Francisco, Portland, and Seattle worst.

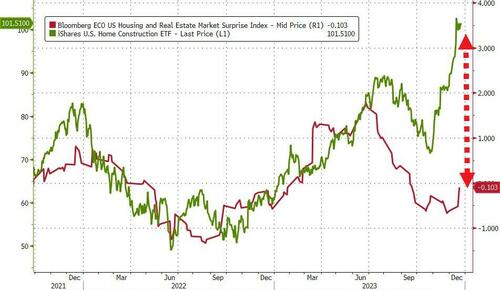
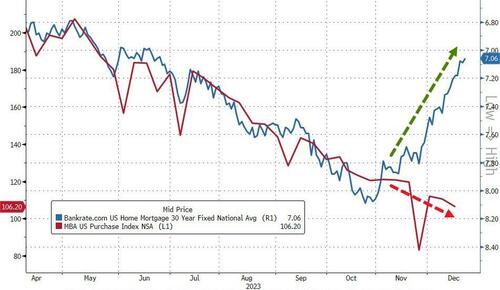
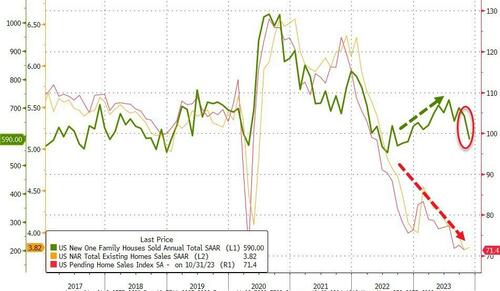
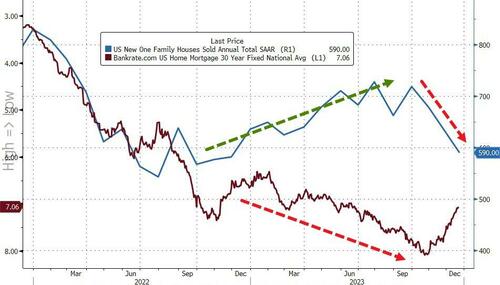
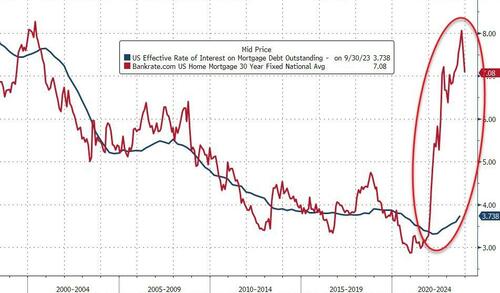
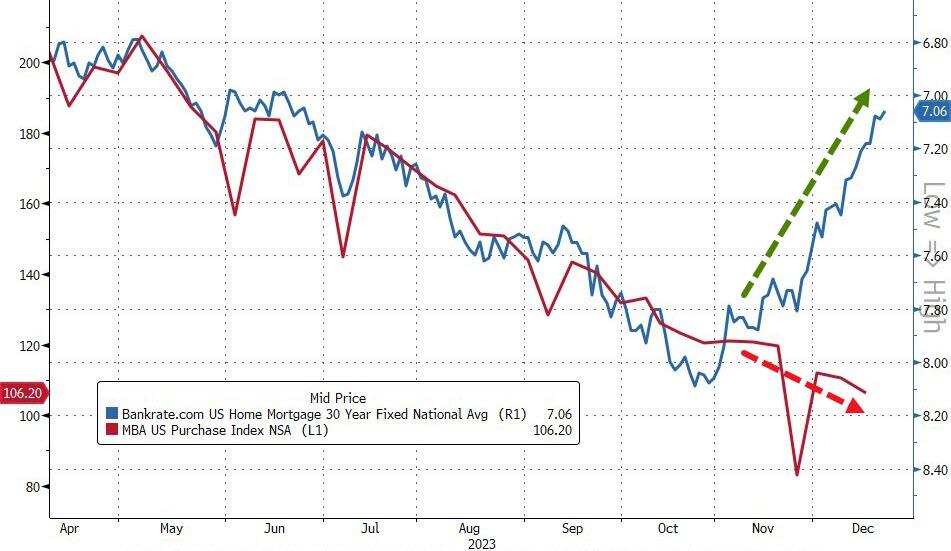
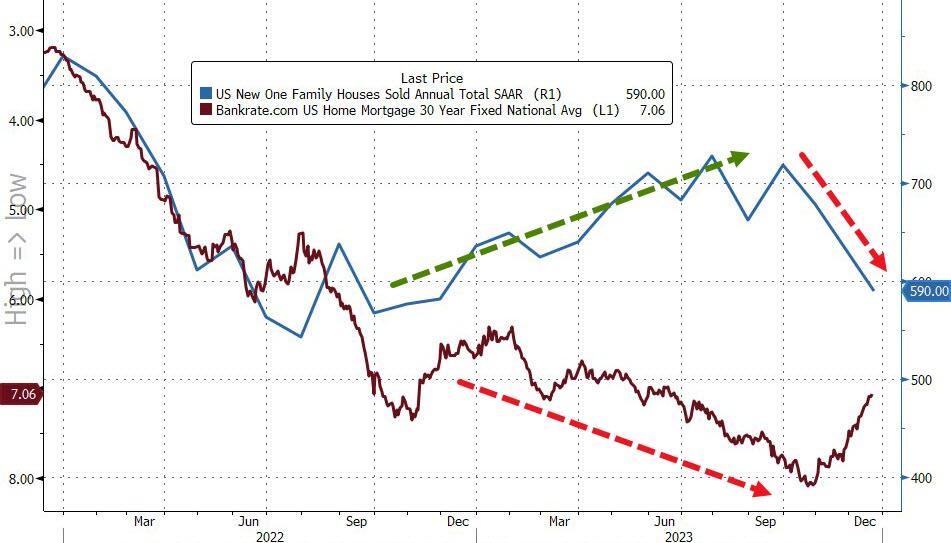
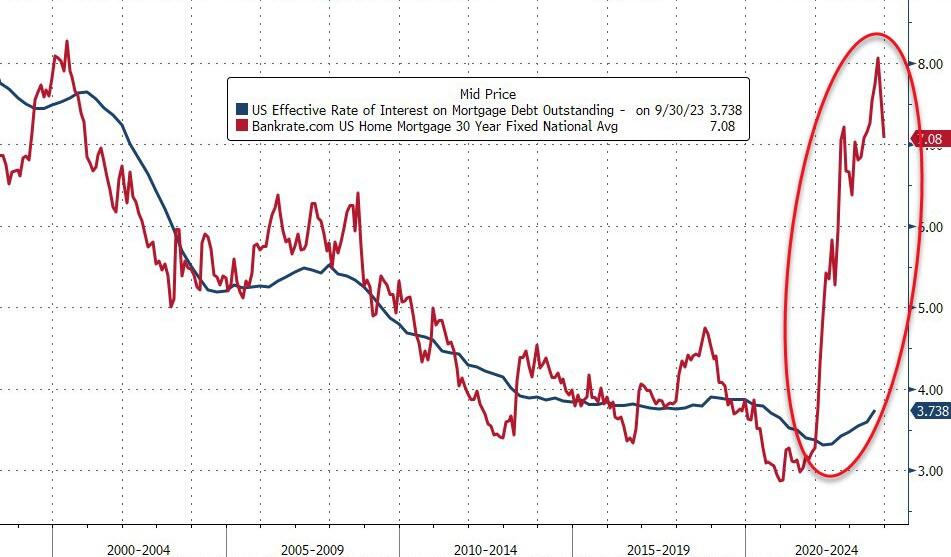
But, judging by the resumption of the rise of mortgage rates since the Case-Shiller data was created, we would expect prices to also resume their decline…

Source: Bloomberg

So prices are up, mortgage rates are actually falling again now (lagged)… so The Fed is re-blowing the same bubble?

Well, at least Detroit is near the top! Playing in Rocket Mortgage stadium.

The US Misery Index, Christmas Edition! Americans Experienced 20% Higher Food Prices, 19% Higher Rents And 61% Higher Gasoline Prices Under Bidenomics, Yet Misery Index Is Almost Back To “Normal”

Have a holly, jolly Christmas! Despite it being far more expensive under Bidenomics.

The ‘Misery Index’ is near its lowest level since pre-COVID, but Misery Index masks the true horrors of Bidennomics: 20% higher food prices, 19% higher rents and 61% higher gasoline prices under Bidenomics.

Americans should be in a better financial position heading into the holidays, according to a famous formula developed in the 1960s under President Lyndon Johnson.

The sum of U.S. unemployment and inflation – known as the “misery index” – fell to 6.8% in November from 7.5% the previous month. That’s the lowest since the summer and fast approaching pre-Covid levels.

The misery index is calculated by adding up the current unemployment rate (3.7%) and the inflation rate (3.1%). The formula provides a simple way to gauge whether the well-being of Americans is improving or not.

Misery peaked in April 2020 when the index spiked to 15%, the highest since 1982. Conditions have improved since the early onset of Covid, but it hasn’t been smooth sailing.

After falling back to 7.7% in January 2021, the index re-accelerated over the next two years as inflation surged. The misery index was 12.5% in June 2022—the same month that annual inflation hit 9.1%.

The unemployment component of the index has been faring well since Covid emergency measures were lifted back in 2021. The unemployment rate has remained below 4% for nearly two years—even as the economy begins to slow.

But economists warn that the misery index doesn’t offer a complete picture of how the average American is doing.

You can tell just by asking them how they feel about the economy and personal finances.

How do Americans really feel?

Economist Greg Ip, who heads economic commentary at The Wall Street Journal, compared the misery index to the University of Michigan’s consumer sentiment index—one of the most closely-watched consumer surveys.

“Based on historic correlations, sentiment has been more depressed this year than you would expect given the level of economic misery,” Ip wrote, arguing that consumers are more pessimistic than the misery index would suggest.

A deeper dive into the sentiment data reveals that Americans are still frustrated about inflation and the impact of high interest rates on their finances. And while the consumer sentiment index rose in December—breaking a four-month skid—some economists attributed it to a temporary holiday boost ahead of Christmas.

“Consumer spirits are perking up for the holiday season which is a sign Christmas is still coming this year,” said Christopher Rupkey, chief economist at FWDBONDS, a New York-based financial research company.

A separate sentiment survey from LSEG/Ipsos paints an even less enthusiastic picture of the average consumer.

The December primary consumer sentiment index—which measures Americans’ attitudes toward jobs, investments, the economy, and personal finances—declined from November and was only up slightly compared to 12 months earlier.

According to the survey, attitudes toward the current situation, investments, and jobs “showed significant declines this month.”

The impact of cumulative inflation

As Creditnews Research reported in a recent study, Americans aren’t celebrating the slowdown in inflation because they’re still reeling from the cumulative price increases of the past three years.

While inflation has fallen to 3.1%, consumer prices have increased by a cumulative 19% since the start of 2020. Food prices are up a whopping 25% over that period.

Americans spent the better part of two years—April 2021 to January 2023—seeing inflation grow faster than their paychecks. That trend reversed in February of this year.

But even with stronger purchasing power this year, the vast majority of Americans (92%) said they reduced their spending in the six months through September, according to a Morning Consult survey for CNBC.

A majority of respondents across all wage brackets said current economic conditions negatively impacted their finances.

So, while the Misery Index indicates that the inflation RATE has slowed, it masks the fact that Americans are far worse off under Bidenomics.

What If Biden’s Open Border Fiasco Is The Final Act Of Left’s Infamous Cloward-Piven Strategy? (59% Of Non-Citizen-Households On Welfare As US Debt Hits $34 TRILLION And Unfunded Liabilites Hit $212.6 TRILLION)

Biden is lucky in that many portray him as a senile, dumb US Senator who happens to be President. Perhaps Biden is actually insidious allowing for open borders in the hopes of crashing the US economy by overloading the welfare system and driving national debt through the roof?

To the extent that this was Biden’s mission, destruction of the US economy, he has been wildly successful. According to the Center For Immigration Studies, 59% of non-citizen-headed households receive welfare.

Biden, like Clinton and Obama before him, has been a Cloward-Piven discipile. Who are Cloward and Piven you ask? Two sociologists at Columbia University. (Cloward pass away in 2001, while Piven is still living). Here are Cloward and Piven attending the Voter Registration (aka, Motor Voter Law) Act signing by President “Willie Slick” Clinton.

The Cloward-Piven strategy is to overload the welfare system to the point of chaos, take control and implement Marxism through government force. To that extent, Biden and his incoherent sidekick, Kamala Harris, have been wildly successful. Sociology and Political Science are two of the most worthless college degrees (with Management in the Business School being a close third). Taking advice from Sociologists or Political Science majors or faculty is insane.

Biden funneled nearly 1.4 million illegal aliens into the U.S. — in FY 2023 alone.

Biden should be familiar to Latin American, African and Chinese immigrants who are used to Marxist dictators who try to have their political opponents taken of the ballots and prosecucted.

Yes, the US welfare rolls are overflowing with illegal immigrants and unfunded liabilities are out of control. Perhaps Biden and Harris should be replaced with Cloward and Piven (even though Cloward is dead). But Newsom, Hillary Clinton and Michelle Obama share the idiocy of the Columbia sociology faculty members. Hillary even teaches a course at Columbia!

Speaking of immbeciles in government, AOC claims abortion is a religious sacrament. Yes, under Biden, the US is officially a third world country!

What about compassion for immigrants? Great! Let’s close the borders and return to LEGAL immigration to halt human trafficking, Fentanyl imports, and cartels controlling the border. But Cloward-Piven’s strategy is best accomplished with open borders and weak-willed politicians.

Bidenomics Isn’t Working! Conference Board Leading Economic Index Fell Again In November

Biden says over and over again the Bidenomics is working. It isn’t working.

The Conference Board Leading Economic Index® (LEI) for the U.S. declined by 0.5 percent in November 2023 to 103.0 (2016=100), following a (downwardly revised) decline of 1.0 percent in October. The LEI contracted by 3.5 percent over the six-month period between May and November 2023, a smaller decrease than its 4.3 percent contraction over the previous six months (November 2022 to May 2023).

Alarm! US New Home Sales Crash In November, Despite Plunging Rates (New Home Sales Down -12.2% From October)

Alarm! New home sales dropped like Biden’s popularity in November, down -12.2% from October.

While existing home sales bounced very modestly off record lows in November, it has been the ‘strength’ of new home sales – with buyer heavily subsidized by homebuilders – that has held up the housing market.

Of course, investors don’t care about actual fundamentals, rates are down so ‘buy buy buy’ the builders…

Source: Bloomberg

Trouble is, even as mortgage rates have plunged recently, applications for home purchases has continued to decline…

Source: Bloomberg

And while mortgage rates have declined (rapidly), they remain massively high relative to the effective mortgage rate for all Americans. That difference is the ‘subsidy‘ that homebuilders have to fill to enable buyers – and it’s still yuuuge!

Source: Bloomberg

So, just how many new homes were sold in November?

The last few months have been very choppy for new home sales but November clarified that homebuilders just hit a wall on their subsidization!

New home sales crashed 12.2% MoM – the biggest MoM drop since April 2022. That dragged the YoY change to just 1.4%…

Source: Bloomberg

9 of the last 10 months have seen downward revisions to the new home sales SAAR!

Source: Bloomberg

New home sales fell in the South by the most, followed by the West. The Northeast and Midwest saw increased sales…

Source: Bloomberg

The new home sales SAAR printed 590k (well below the 690k exp) – the lowest since Nov 2022… catching down to existing home sales reality…

Source: Bloomberg

And another catch-up to reality for sales, even as rates tumble…

Source: Bloomberg

Finally, we note that the median new home priced jumped to $434.7k from $414.9k…

Source: Bloomberg

The median existing home price dropped to lowest since April while median new home price jumped to highest since August

Odd that these ‘actual’ new home sales are plunging as ‘soft survey’ data shows homebuilder sentiment rising, and housing starts.

Biden’s Fiscal Inferno! Treasury Warns Budget Deficit Up 13%, Debt Reaching $34 Trillion (Don’t Forget About $212.5 TRILLION In Unfunded Liabilities)

It‘s Biden’s Fiscal Inferno! Insane open borders, insane green spending, wars in Ukraine, Gaza and growing restlessness around Taiwan. Inflation. And a demented 81-year old President in charge.

The U.S. government ran a budget deficit of $381 billion so far into the 2024 fiscal year, which represents a 13% increase from this same time period last year.

The deficit is $44 billion higher than it was at the end of November 2022, according to the latest data released by the U.S. Department of the Treasury.

Congress passed a “laddered” continuing resolution in November with a final expiration date of February 2. Conservative House Republicans have been calling for a reduction in federal spending to reduce the budget deficit. Congress must pass another spending bill to keep the government funded past Feb. 2.

The specific cuts the House GOP is considering remains unclear at this time, but any reduction in spending is likely to hit roadblocks in the Democratic-led Senate. Senate Majority Leader Chuck Schumer, D-N.Y., has criticized previous GOP attempts to cut domestic spending levels.

In September, House Republicans were trying to cut annual spending by about $120 billion, which still would not balance the budget. Congressional Democratic leaders were critical of their approach at the time.

Senate congressional leaders are currently debating a foreign assistance package that would provide additional aid to Ukraine and Israel as well as humanitarian assistance for Palestinian refugees along with money for U.S. border security. Senate leaders said on Tuesday that both sides were closer to a deal, but a formal agreement hasn’t been reached yet.

“With regard to the border discussion, I think it’s pretty safe to say that we’ve made some significant progress, but we obviously aren’t there,” McConnell said at the Capitol during his weekly news conference on Tuesday.

On the House side, Republicans have argued that additional aid for Israel and Ukraine should be paid for or “offset” by equivalent spending reductions. Schumer has said that such foreign assistance does not need to be paid for since it is considered emergency spending.

Senators are still in Washington negotiating on the package but the House has left town for the holidays.

Scott Hodge, president emeritus and senior policy adviser at the Tax Foundation, a nonpartisan tax policy 501(c)(3) nonprofit, said the U.S. Treasury reporting a 13% increase in the deficit compared to November 2022 shows the U.S. government continues to go down the wrong path when it comes to fiscal policy.

“It is being driven by federal spending, which is up by $152 billion, a 17% increase compared to the same month in 2022. The monthly deficit would have been worse if decent economic growth hadn’t boosted federal tax collections by $108 billion, or 19%,” Hodge told Just the News.

“The problem with the federal budget is basic math—the growth in spending continues to outpace the growth in tax collections. This is why our national debit is heading toward $34 trillion. It cannot go on forever without serious economic consequences,” he added.

Maya MacGuineas, president of the Committee for a Responsible Federal Budget, shared a similar perspective on the matter. “The longer we allow our debt to worsen, the less room we ultimately have to respond to the kinds of global emergencies we’re seeing in the world today,” she said.

“This leaves policymakers with a choice: make the hard choices today by paying for our priorities and putting the national debt on a sustainable trajectory, or saddle the next generation with an even worse situation,” she added.

The national debt in January of 2020 was $17.2 trillion, according to historical data from the Peterson Foundation. By contrast, the national debt is currently $33.9 trillion, according to the U.S. Treasury.

And don’t forget that $212.5 TRILLION in unfunded liabilities.

US Existing Home Sales Decline -7.28% Since Last Year (UP 0.8% MoM)

For November, US existing home sales are down -7.28% since last year. At least that is an improvement over -14.6% YoY in October.

Despite homebuilder sentiment ticking up (along with their stock prices) and housing starts soaring – buoyed by a 100bps decline from multi-decade highs in mortgage rates – analysts expected a small 0.4% MoM decline in existing home sales in November (after October’s big drop).

Instead, existing home sales beat expectations by rising 0.8% MoM in November, which pulled the YoY decline up to just 7.28%…

Source: Bloomberg

“The latest weakness in existing home sales still reflects the buyer bidding process in most of October when mortgage rates were at a two-decade high before the actual closings in November,” said NAR Chief Economist Lawrence Yun. “A marked turn can be expected as mortgage rates have plunged in recent weeks.”

The total existing home sale SAAR bounced very marginally off record lows…

Source: Bloomberg

Regional sales were mixed:

  • Existing-home sales in the Northeast slipped 2.1% from October to an annual rate of 470,000 in November, down 13.0% from November 2022. The median price in the Northeast was $428,600, up 4.8% from the prior year.
  • In the Midwest, existing-home sales rose 1.1% from the previous month to an annual rate of 940,000 in November, down 8.7% from one year ago. The median price in the Midwest was $280,800, up 4.9% from November 2022.
  • Existing-home sales in the South improved 4.7% from October to an annual rate of 1.77 million in November, a decline of 4.3% from the prior year. The median price in the South was $351,500, up 3.4% from last year.
  • In the West, existing-home sales slumped 7.2% from a month ago to an annual rate of 640,000 in November, down 8.6% from one year before. The median price in the West was $603,200, up 5.3% from November 2022.

Mortgage rates are down, but leave a long way for home sale to drop still…

Source: Bloomberg

But, the gap between current rates and effective rates for Americans is still immense…

Source: Bloomberg

The median existing-home price for all housing types in November was $387,600, an increase of 4.0% from November 2022 ($372,700), but down MoM…

All four U.S. regions posted price increases.

“Home prices keep marching higher,” Yun added.

“Only a dramatic rise in supply will dampen price appreciation.”

Well, with housing starts accelerating in the latest data and Powell’s massive pivot, has The Fed re-ignited its 3rd housing bubble?

And the buying condition for housing sinks to all-time low.

Mortgage Purchase Demand Falls To 1995 Levels (-4% WoW, -18% YoY)

You better think twice! Mortgage demand has fallen to its lowest level since 1995.

Mortgage applications decreased 1.5 percent from one week earlier, according to data from the Mortgage Bankers Association’s (MBA) Weekly Mortgage Applications Survey for the week ending December 15, 2023.

The Market Composite Index, a measure of mortgage loan application volume, decreased 1.5 percent on a seasonally adjusted basis from one week earlier. On an unadjusted basis, the Index decreased 3 percent compared with the previous week.  The seasonally adjusted Purchase Index decreased 1 percent from one week earlier. The unadjusted Purchase Index decreased 4 percent compared with the previous week and was 18 percent lower than the same week one year ago.

The Refinance Index decreased 2 percent from the previous week and was 18 percent higher than the same week one year ago.

The average contract interest rate for 30-year fixed-rate mortgages with conforming loan balances ($726,200 or less) decreased to 6.83 percent from 7.07 percent, with points increasing to 0.60 from 0.59 (including the origination fee) for 80 percent loan-to-value ratio (LTV) loans.

Fire! November US Housing Starts Explode +14.8% In November As New Home Prices Collapse By -20% YoY

There is a sudden fire in housing as housing starts soar in November.

Housing Starts:
Privately‐owned housing starts in November were at a seasonally adjusted annual rate of 1,560,000. This is 14.8 percent above the revised October estimate of 1,359,000 and is 9.3 percent above the November 2022 rate of 1,427,000. Single‐family housing starts in November were at a rate of 1,143,000; this is 18.0 percent above the revised October figure of 969,000. The November rate for units in buildings with five units or more was 404,000.

Building Permits:
Privately‐owned housing units authorized by building permits in November were at a seasonally adjusted annual rate of 1,460,000. This is 2.5 percent below the revised October rate of 1,498,000, but is 4.1 percent above the November 2022 rate of 1,402,000. Single‐family authorizations in November were at a rate of 976,000; this is 0.7 percent above the revised October figure of 969,000. Authorizations of units in buildings with five units or more were at a rate of 435,000 in November.

Median NEW home prices dropped -20% YoY.

1-unit housing starts exploded, but permits declined.

Housing Market Index Remains Depressed Under Bidenomics As Federal Debt SOARS (Its A Long Way To The Bottom!)

As AC/DC sang; “Its a long way to the top bottom.” But Bidenomics is sending us there!

Today, the NAHB/Wells Fargo Housing Market Index rose slightly on falling mortgages. But the housing market index remains depressed since Biden seized the reigns of power in 2021.

The Federal government added $7 trillion in debt since 2020 while it took 215 years to get to $7 trillion before Covid and Bidenomics.

In what can simply be called fiscal insanity, The Federal government is borrowing like there is no tomorrow (given that Biden is 81 years old, this isn’t far off) displacing businesses and households. Heaven help us if the Federal government has to borrow more money to fight a real war like World War II.

So, the massive Federal debt gorging isn’t helping the housing market.