Despite The Fed’s attempts at cooling inflation down to 2%, we are seeing a re-animation of price increases. this time with home prices.
On a year-over-year basis, the Freddie Mac National FMHPI was up 6.0% in October, from up 5.1% YoY in September. The YoY increase peaked at 19.1% in July 2021, and for this cycle, bottomed at up 0.9% in April 2023. …
vv
Austin TX is the big loser, down -11.2% from peak. Followed by Idaho (largely people escaping from Newsomland (California) and speculators. The sixth leading area is Lake Havasu AZ.
As of October, 7 states and D.C. were below their previous peaks, Seasonally Adjusted. The largest seasonally adjusted declines from the recent peak were in Idaho (-4.5%), Utah (-2.7%), D.C. (-2.0%), and Nevada (-1.6%). Nevada, Idaho and Utah are now known as the Mild, Mild, West due to sagging home prices.
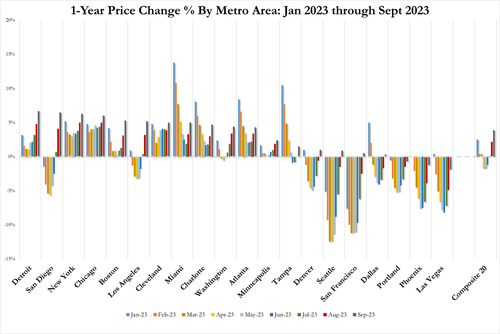
For cities (Core-based Statistical Areas, CBSA), here are the 30 cities with the largest declines from the peak, seasonally adjusted. Austin continues to be the worst performing city.
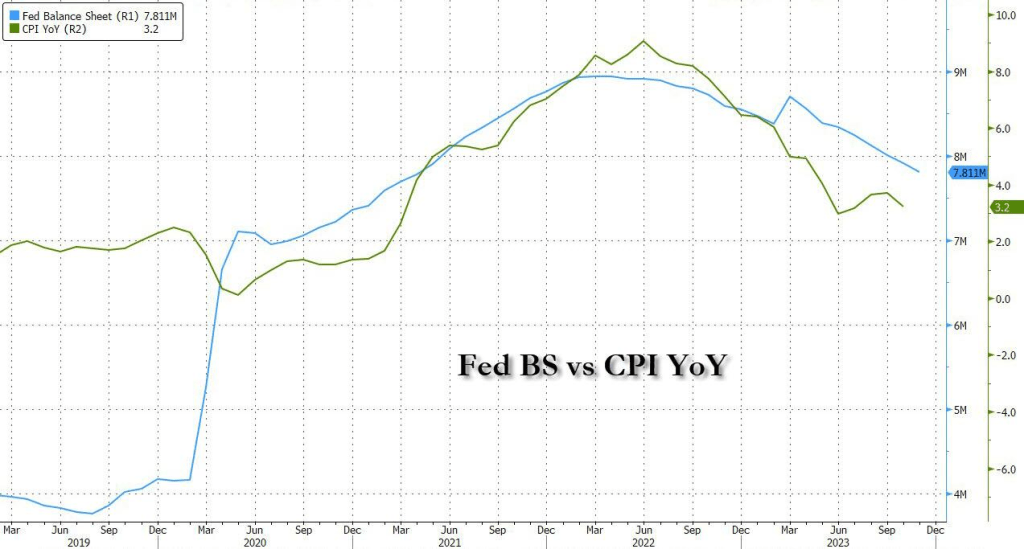
Speaking of inflation and The Fed, Biden claiming he lowered inflation is laughable if it wasn’t so sad. It is all The Fed. And their timidness is shrinking their balance sheet is contributing to persistent inflation.
So, yes, inflation is growing again. This time it is persisent and growing.
The US housing and mortgage markets are thunderstruck by The Fed’s attempts at cooling inflation down to 2%.
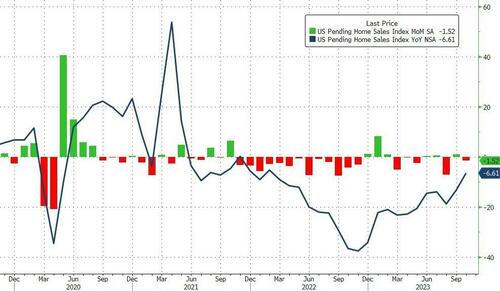
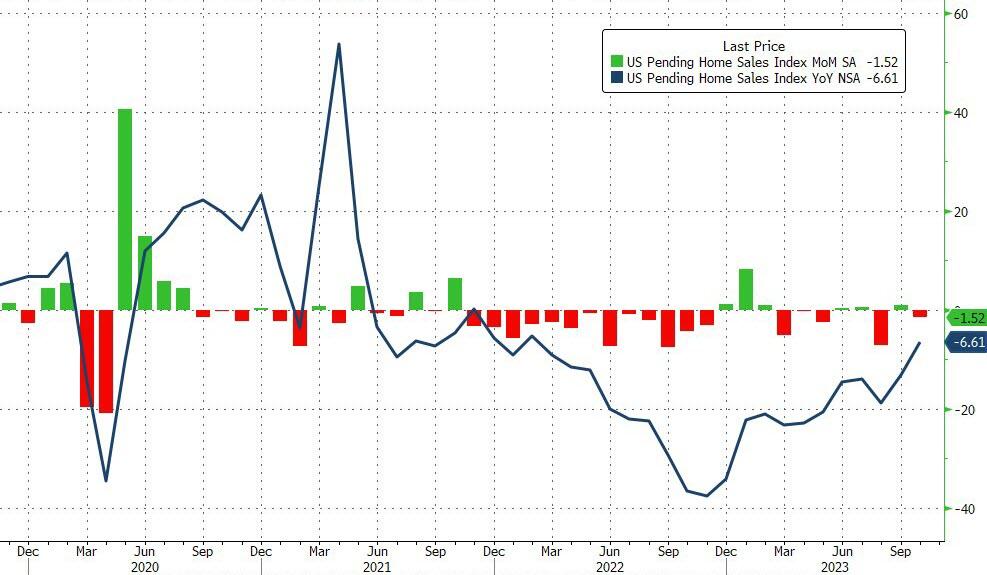
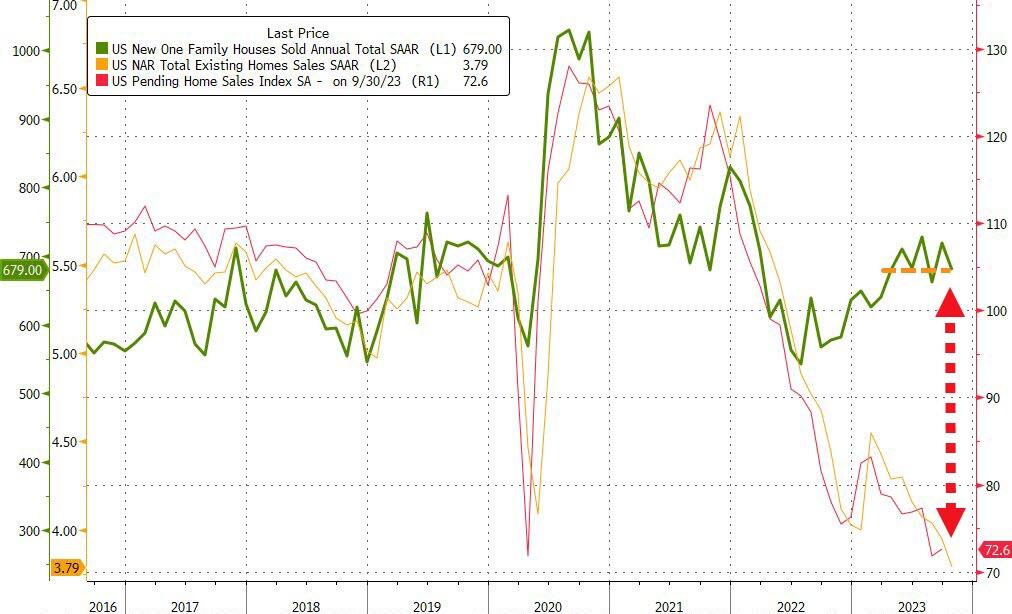
After a small bounce last month – following the puke in August – pending home sales dropped 1.5% MoM in October (better than the 2.0% MoM decline expected). This left YoY sales down 6.6% (negative for the 23rd straight month)…
Source: Bloomberg
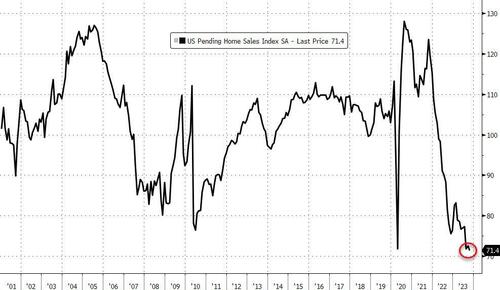
The Pending Home Sales Index dropped back to a new record low…
Source: Bloomberg
By region, only the Northeast saw an increase in pending sales last month.
Sales fell the most in the West, down 6%, while contract signings in the South and Midwest slipped 1.9% and 0.4%, respectively.
Home sales are rising in places with more inventory, Lawrence Yun, NAR’s chief economist said, noting that purchases of new houses are up so far this year because of builders’ ability to create inventory.
“During October, mortgage rates were at their highest, and contract signings for existing homes were at their lowest in more than 20 years,” Yun said in a statement.
“Recent weeks’ successive declines in mortgage rates will help qualify more home buyers, but limited housing inventory is significantly preventing housing demand from fully being satisfied.”
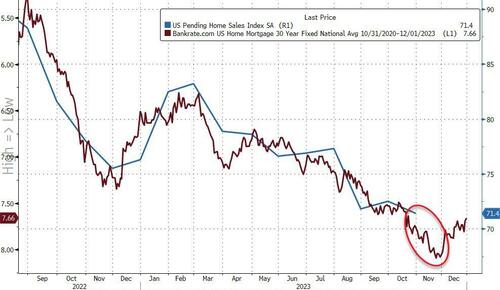
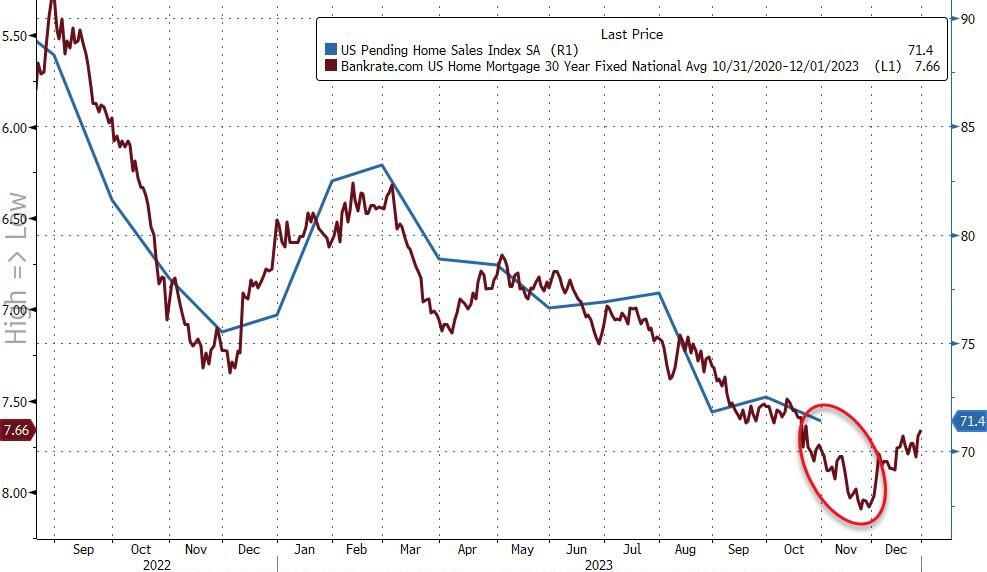
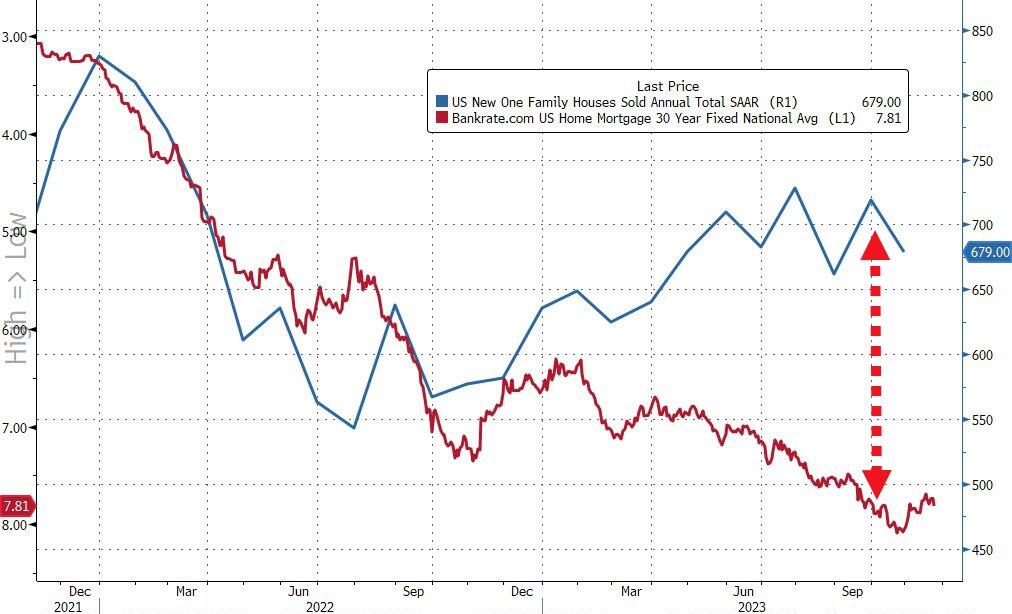
The trend in pending home sales is following the mortgage rate (with a one month lag) and is set to fall further still…
Source: Bloomberg
The pending-home sales report is a leading indicator of existing-home sales given houses typically go under contract a month or two before they’re sold.
How long with Powell and his pals be able to keep this ‘higher for longer’ stress up as Americans’ largest source of wealth evaporates?
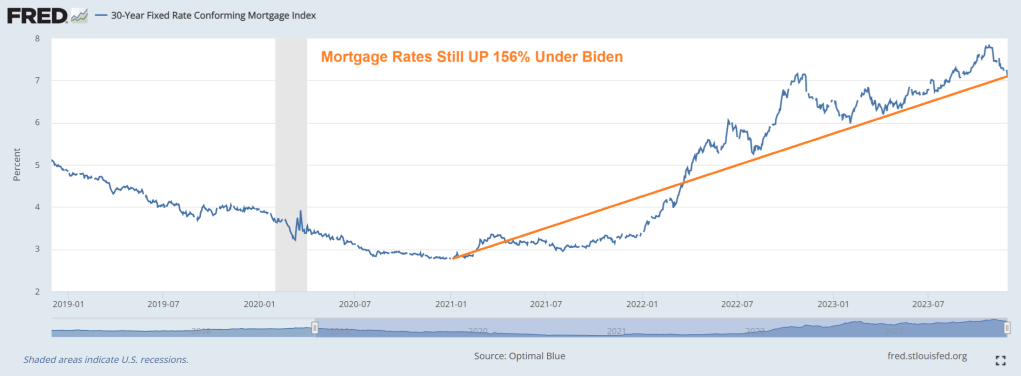
Mortgage rates have fallen recently, but are still up a staggering 156% under Biden.
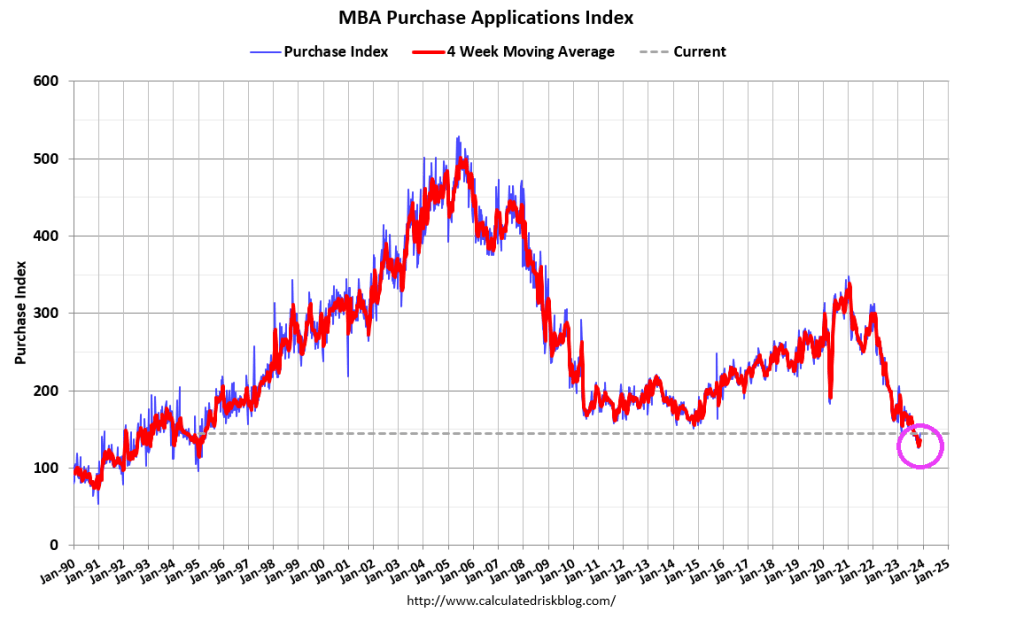
And mortgage purchase applications keep falling.
Here is The Fed keeping a close eye on the housing and mortgage market.
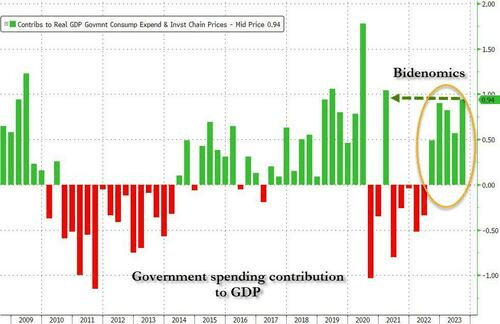
But was it organic growth or simply The Federal Government funding the defense and green energy industies with trillions in spending?
One factor has been government spending which grew an unsustainably 4.7% in real terms over the last year. Outside the pandemic, this is one of the fastest rates in decades and works at a cross purpose with monetary policy objectives.
Bidenomics is code for massive Federal spending (and debt) to fund Federal priorities: wars in Ukraine, Israel and likely involvement around Taiwan. And the costly switch to green energy (but not nuclear, for some reason).
If the US economy growing simply to function as a war machine and wealth transfer mechanism from the middle class to the 1%, we are on the Highway To Hell. Personal consumption contributed 2.44% to the bottom line GDP print in Q3, down from the pre-revision number of 2.69% but well above Q2’s 0.55%.
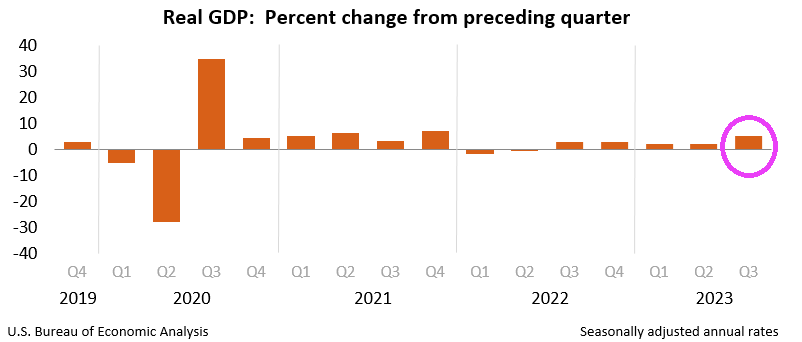
As expected, Q3 Real GDP was revised upwards to 5.2% annualized. Of course, this shatters JKP’s talking points that Biden inherited a train wreck of an economy from Trump. Q3 2020 Real GDP grew at over 30%.
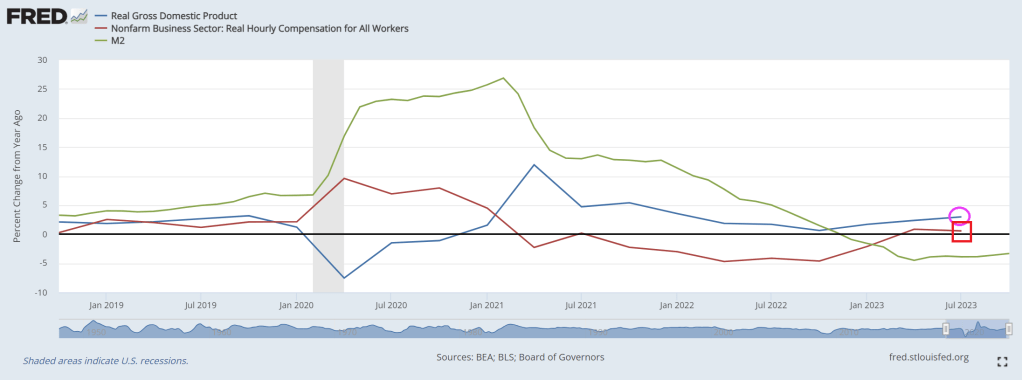
And on a year-over-year (YoY) basis, US real GDP grew at 3.0% in Q3. Unfortunately, real hourly compensation grew at a measly 0.6% YoY.
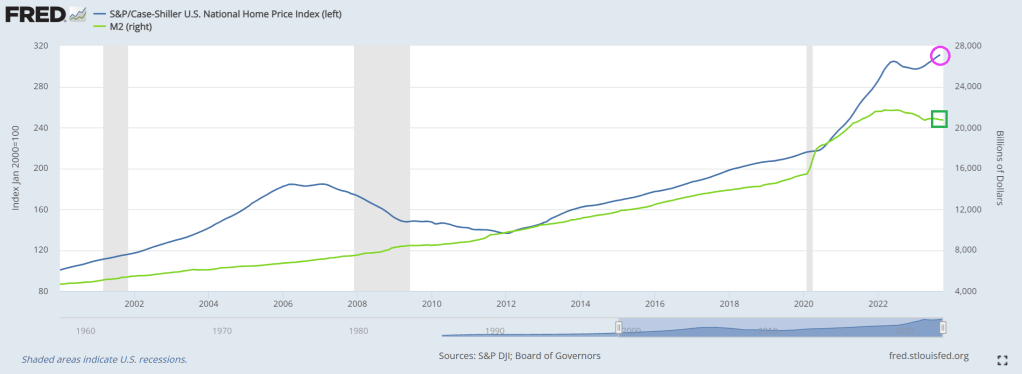
Meanwhile, home prices have hit an all-time high. Too bad real wages are so low.
Why is growth so strong? One factor has been government spending which grew an unsustainably 4.7% in real terms over the last year. Outside the pandemic, this is one of the fastest rates in decades and works at a cross purpose with monetary policy objectives.
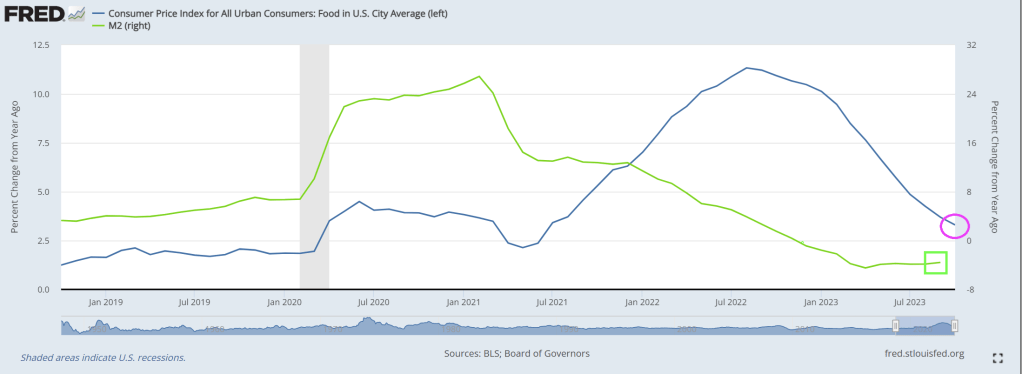
Despite Biden/KJP’s ridiculous lies about about this Thanksgiving being the 4th “cheapest” in history, inflation while cooling is still way up under Biden. In fact, food prices are up 25% since 2020.
Since 2020, US groceries are up 25%, used cars climbed 35% and rents roughly 20%. In 2020, a survey showed a 4-person household spent an average of $238.32 in a week on food at home. A similar survey in 2023 showed that figure had jumped 32% to $315.22.
Notice that food CPI peaked at 11.33% in August 2022 and has been declining since as M2 Money growth dies.
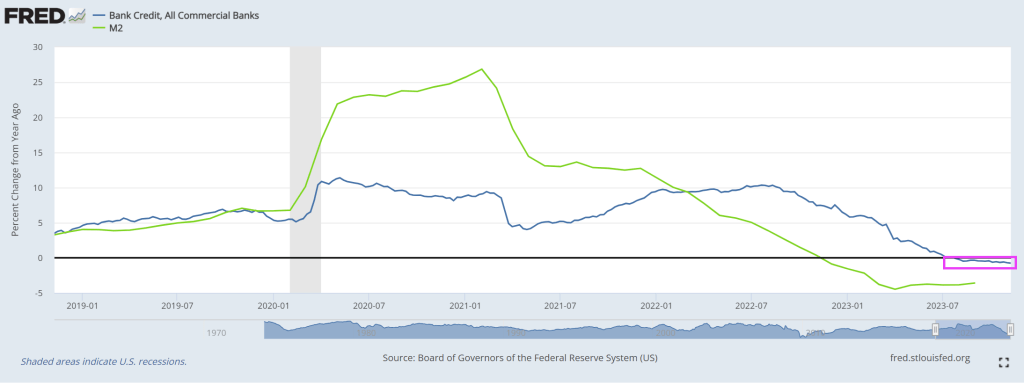
Of course, Biden blames high prices on … anyone but himself and big spending Congress. “Biden admits prices ‘too high’ but blames sellers for 18% inflation.” Sure Joe, the big spending bills you championed as part of Bidenomics that helped surge M2 Money supply (green line) has nothing to do with price increases, just the evil private sector.
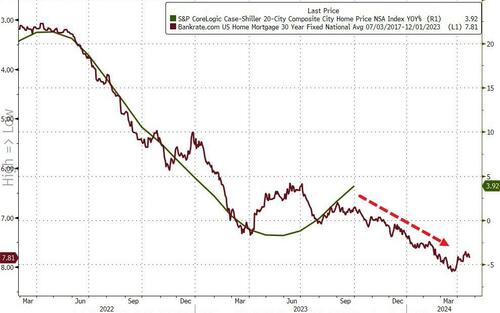
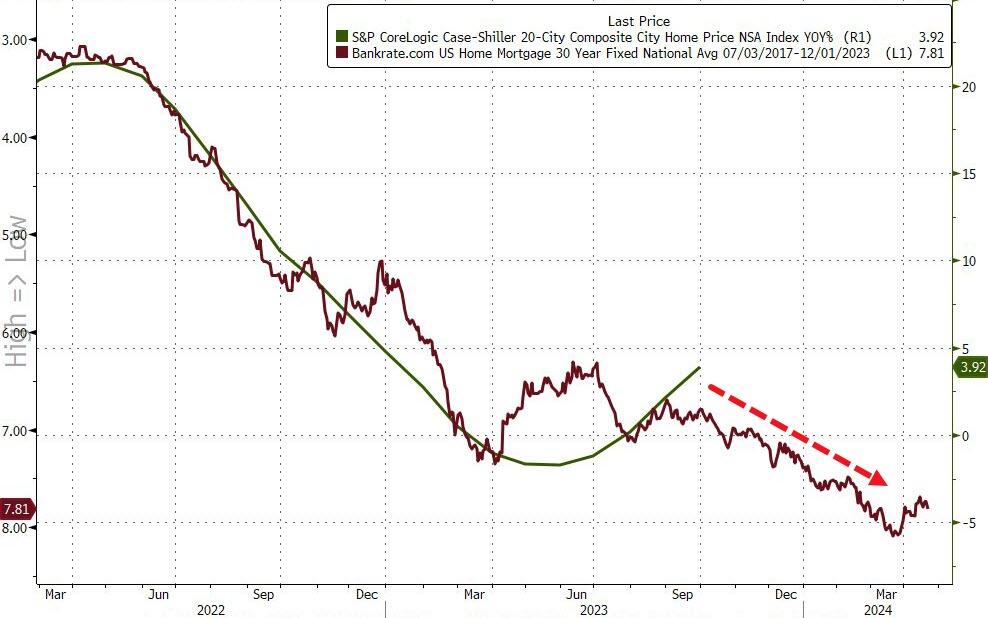
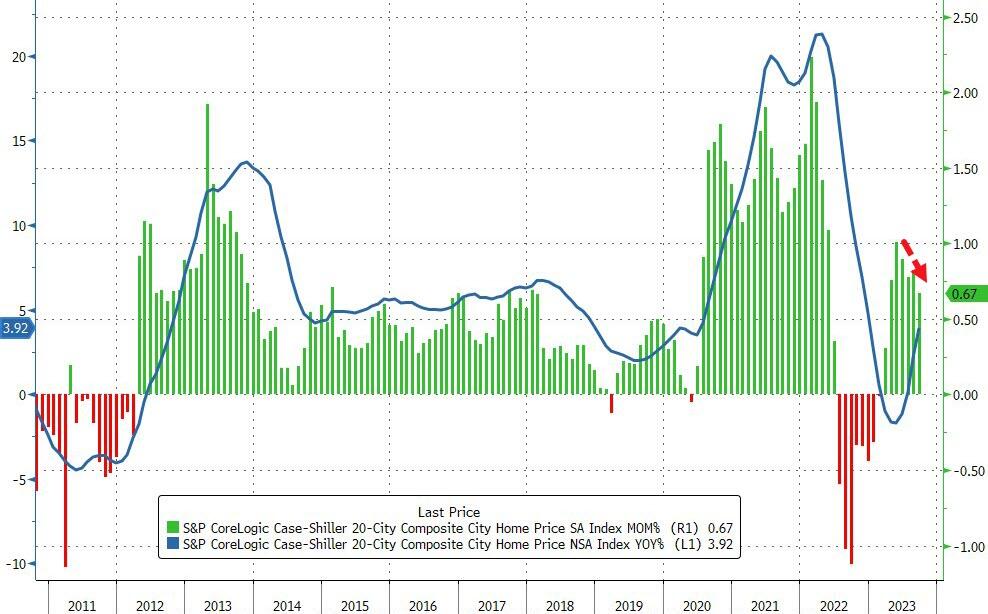
That pushed the YoY rise in prices up 3.92% – the fastest pace since Dec ’22 – but as the chart shows the MoM gains are slowing rapidly.
Source: Bloomberg
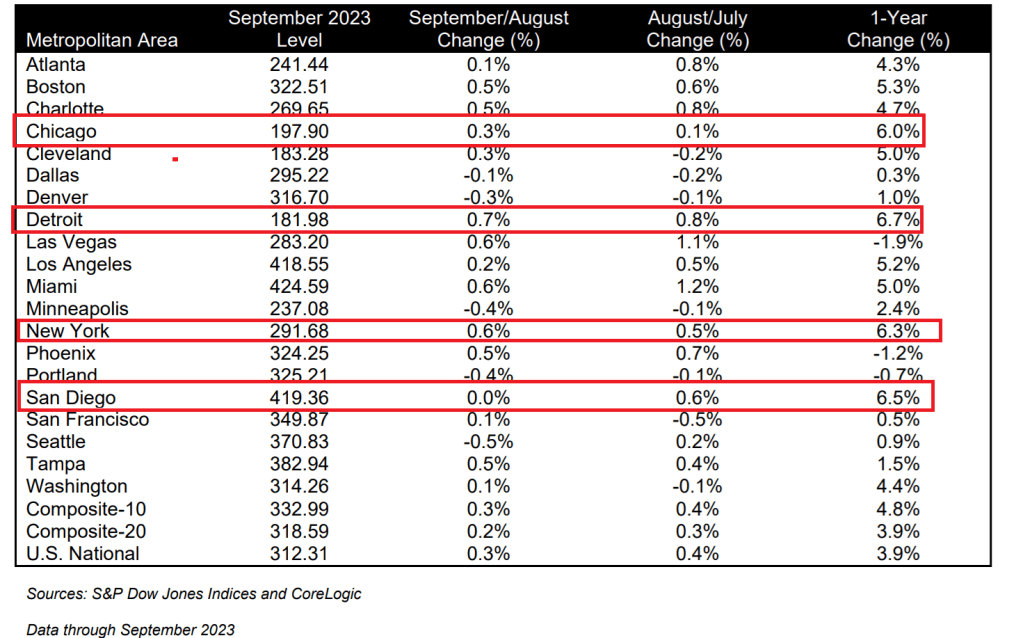
“On a year-over-year basis, the three best-performing metropolitan areas in September were Detroit (+6.7%), San Diego (+6.5%), and New York (+6.3%),” according to Craig J. Lazzara, Managing Director at S&P DJI.
“We’ve commented before on the breadth of the housing market’s strength, which continued to be impressive. On a seasonally adjusted basis, all 20 cities showed price increases in September”
But, judging by the resumption of the rise of mortgage rates since the Case-Shiller data was created, we would expect prices to also resume their decline…
Source: Bloomberg
Inventory is increasing (as homebuilders dump new homes on to the market), but existing home-buyers and -sellers are stuck still (affordability for the former and the mortgage cost gap for the latter), and – despite the market’s hopes – The Fed isn’t cutting rates any time soon (unless the economy utterly collapses). Be careful what you wish for…
Odd that 4 metro areas with 6% or higher home price growth are all cities with larger illegal immigrant migration: Chicago, Detroit, New York and San Diego (all blue cities). This is what is called housing displacement, A surge in immigration leads to rent stock being absorbed and housing prices rising.
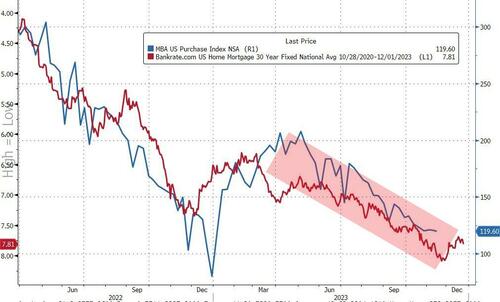
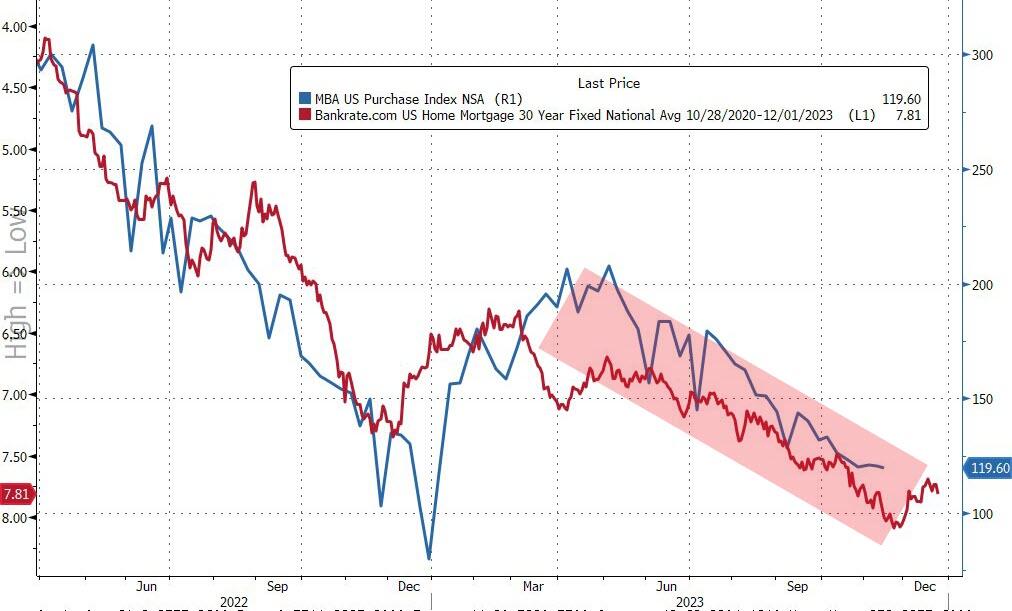
As a reminder, The Mortgage Bankers Association’s index of home-purchase applications tumbled to 120 – the lowest level since 1995 – as mortgage rates hit 8% for the first time in 23 years in October.
Source: Bloomberg
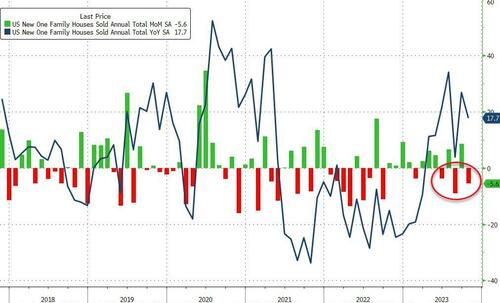
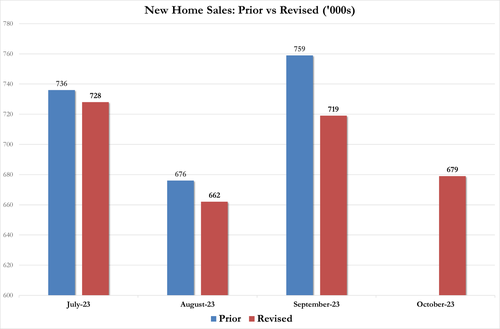
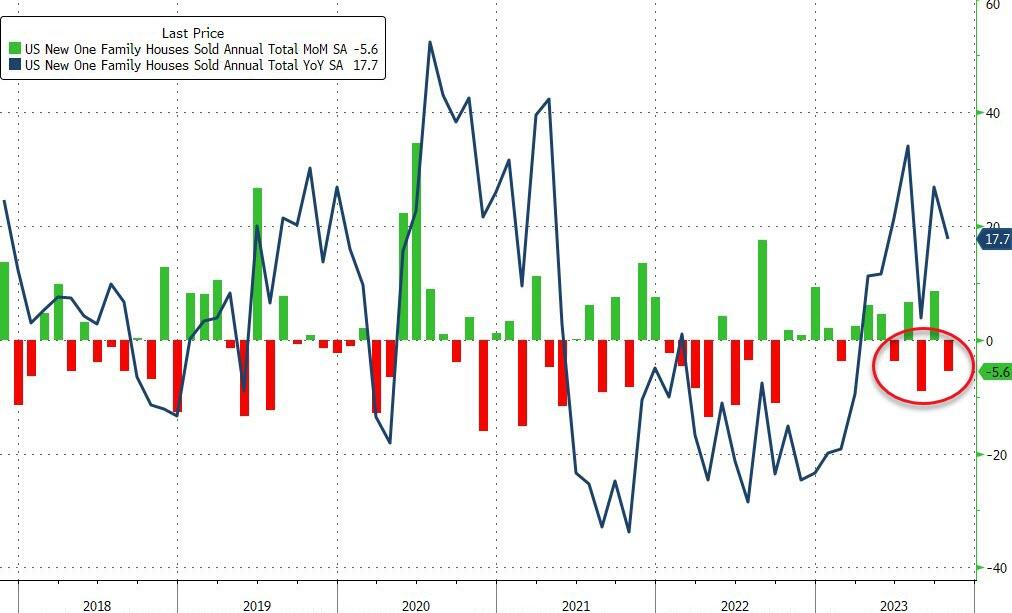
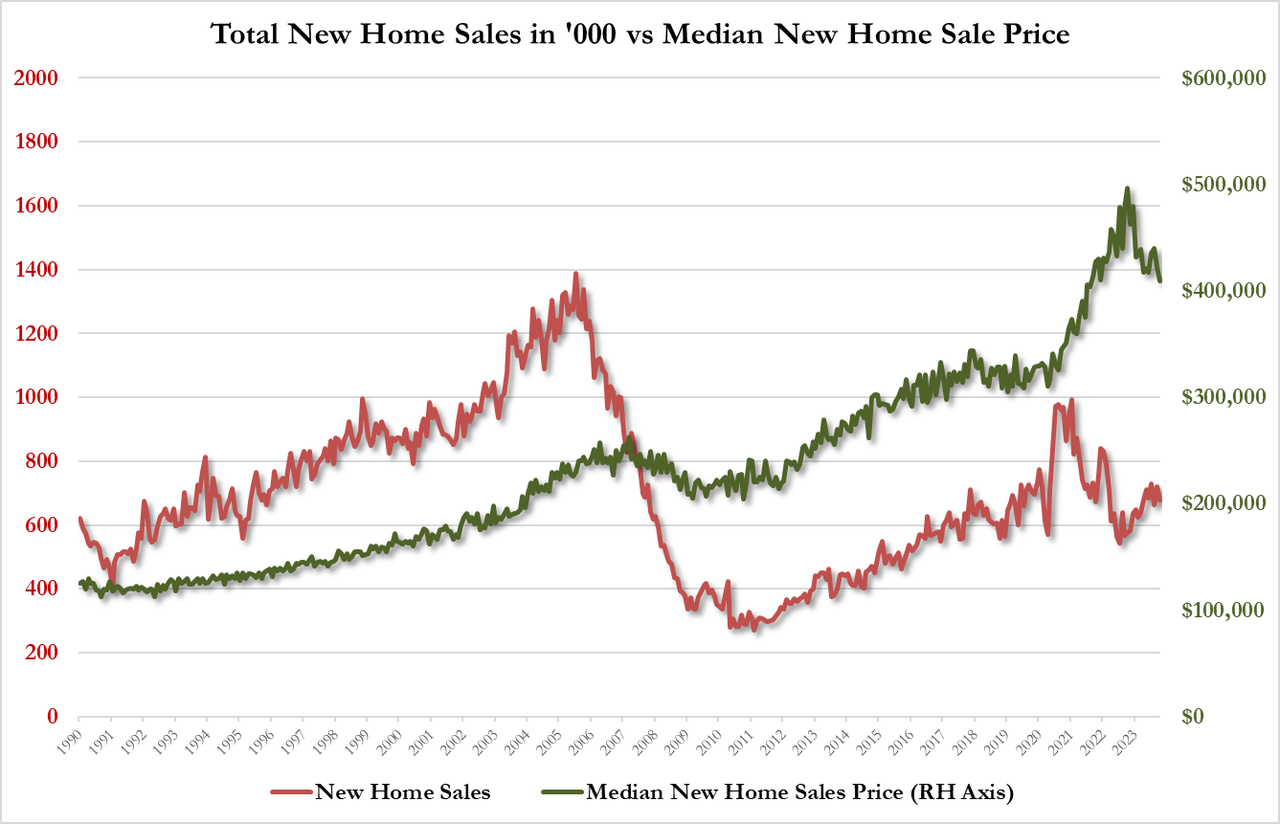
So, it should be no surprise that new home sales were even worse than expected, plunging 5.6% MoM (and making it even worse, the 12.3% MoM jump in Sept was revised down to +8.6%)…
Source: Bloomberg
The trend of downward revisions continues…
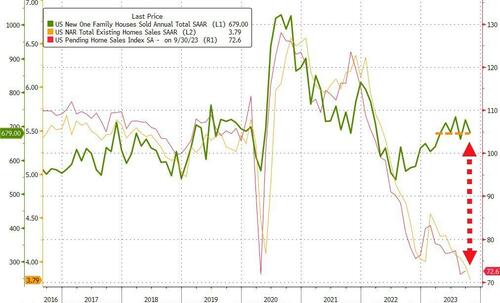
The New Home Sales SAAR of 679k is flat from April (that was below all economists’ forecasts)…
Source: Bloomberg
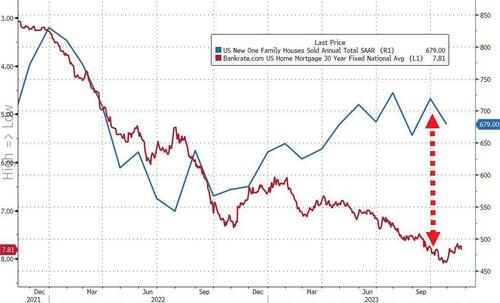
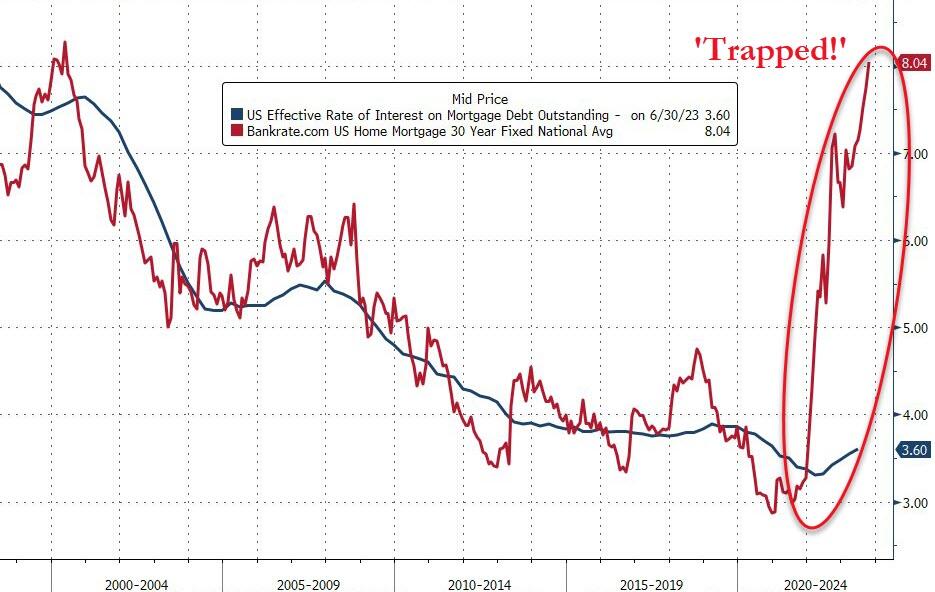
It appears the homebuilders finally hit their wall eating the gap between these two lines was just not sustainable…
Source: Bloomberg
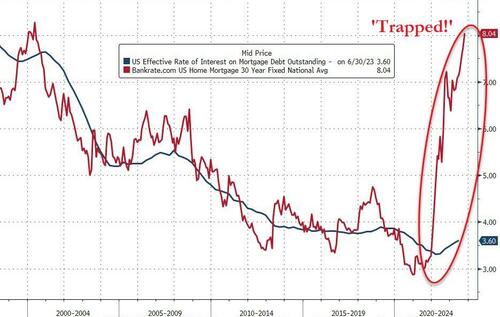
And as we noted previously, homebuilders can’t be filling this gap either – between the current 30Y mortgage rate and the effective rates that borrowers are currently paying on their home loans – (i.e. subsidizing new home sales) forever…
Source: Bloomberg
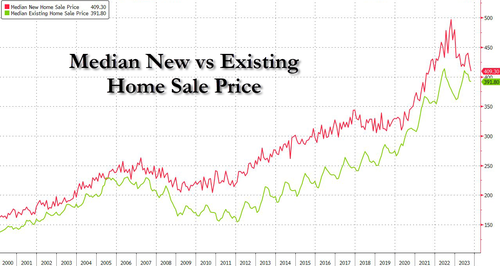
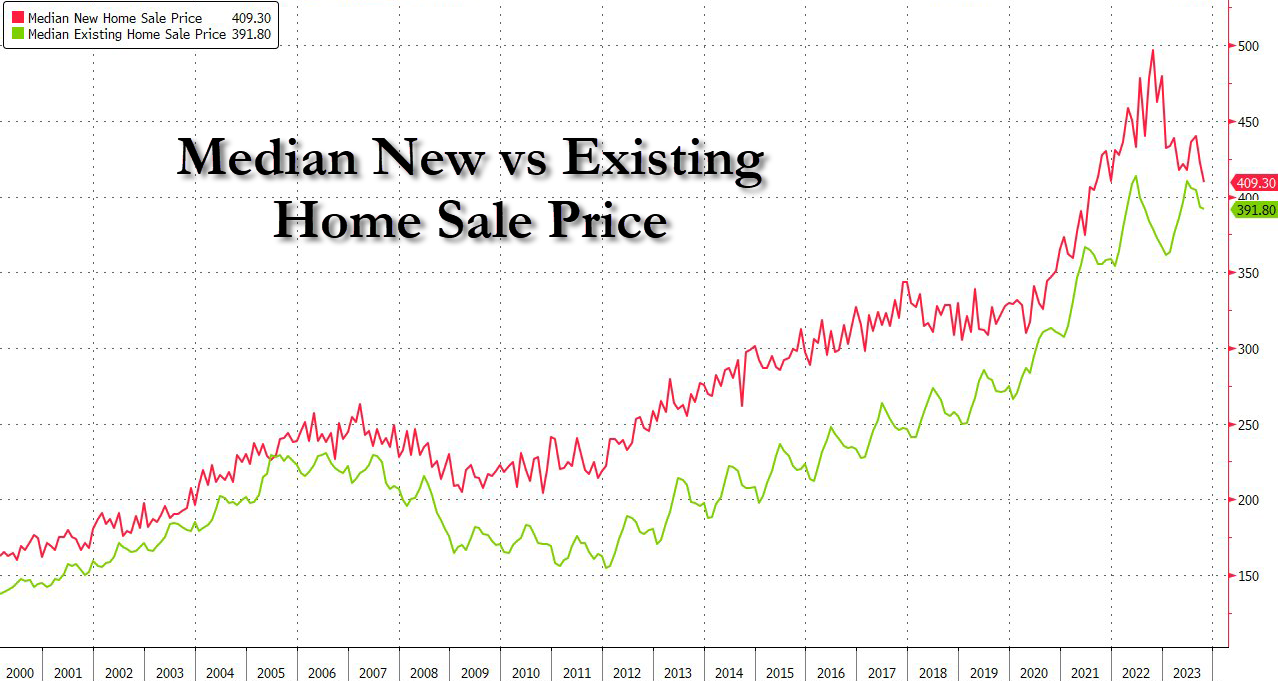
The median new home price fell 17.6% y/y to $409,300; average selling price at $487,000
That is the lowest median price since Aug 2021, catching back down to existing home prices…
Source: Bloomberg
Is Powell winning his war on affordability? Or crushing the middle class’s main source of wealth? Or is it Hammer Time??
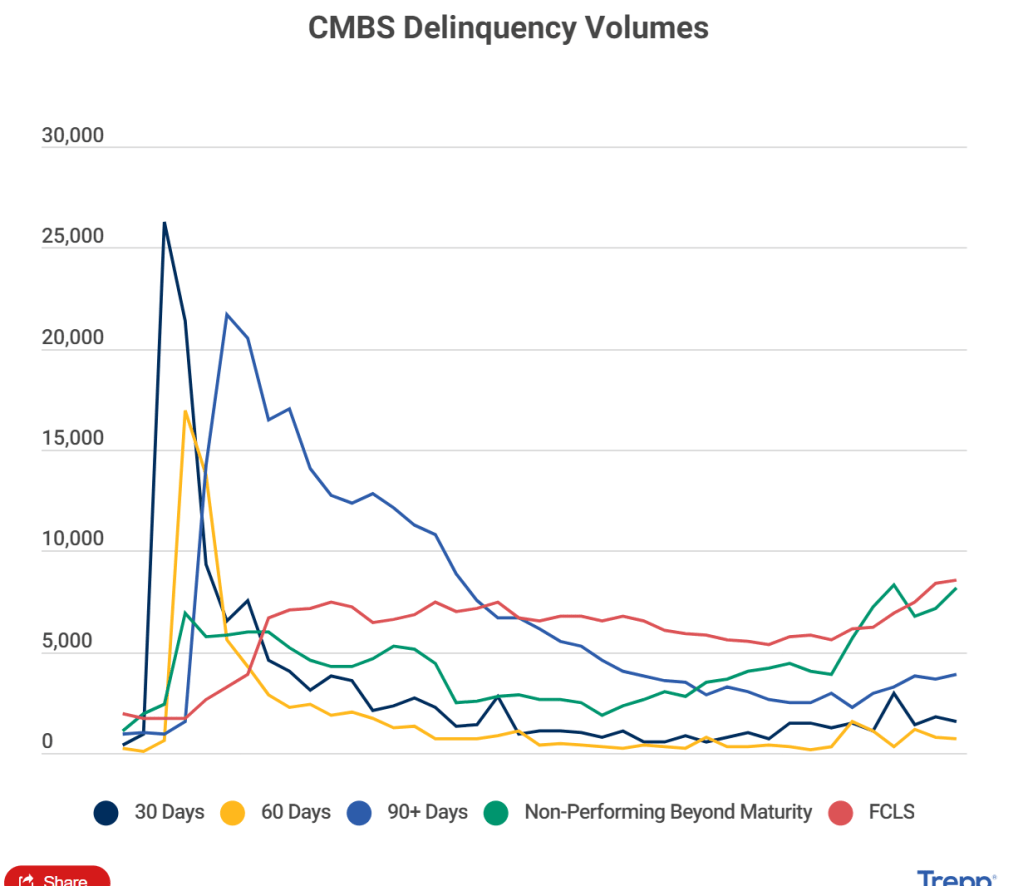
According to Trepp, the volume of CMBS delinquency increased 49.4% during 10 months through October.
Looking for more? This piece has been taken from Trepp and Commercial Real Estate Direct’s Q3 2023 Quarterly Data Review. Access the magazine here.
The volume of CMBS loans that are classified as delinquent increased by 49.4% during the 10 months through October to $27.91 billion. That volume amounts to 5.07% of the $601.98 billion universe tracked by Trepp. In contrast, delinquencies at the end of last year amounted to 3.03% of the $616.15 billion universe then extant.
Office Sector Drives Increase in Delinquency Volumes
The driver of the increase was the office sector, which had a 261% increase in delinquency volumes over the 10-month period through October. A total of 199 loans with a balance of $9.59 billion, or 5.91% of all CMBS office loans were at least 30 days late with their payments, as of the end of October. At the end of last year, 115 loans with a balance of $2.65 billion, or 1.63% of office loans, were delinquent.
The sector’s prospects are unlikely to improve as office occupancy rates have declined in most of the country’s major markets. That’s been driven by a substantial pullback in demand from office-using tenants.
Hit especially hard have been loans with floating coupons that are maturing and need interest-rate cap agreements in place before they qualify for term extensions. Those rate caps have skyrocketed in price in lockstep with interest rates.
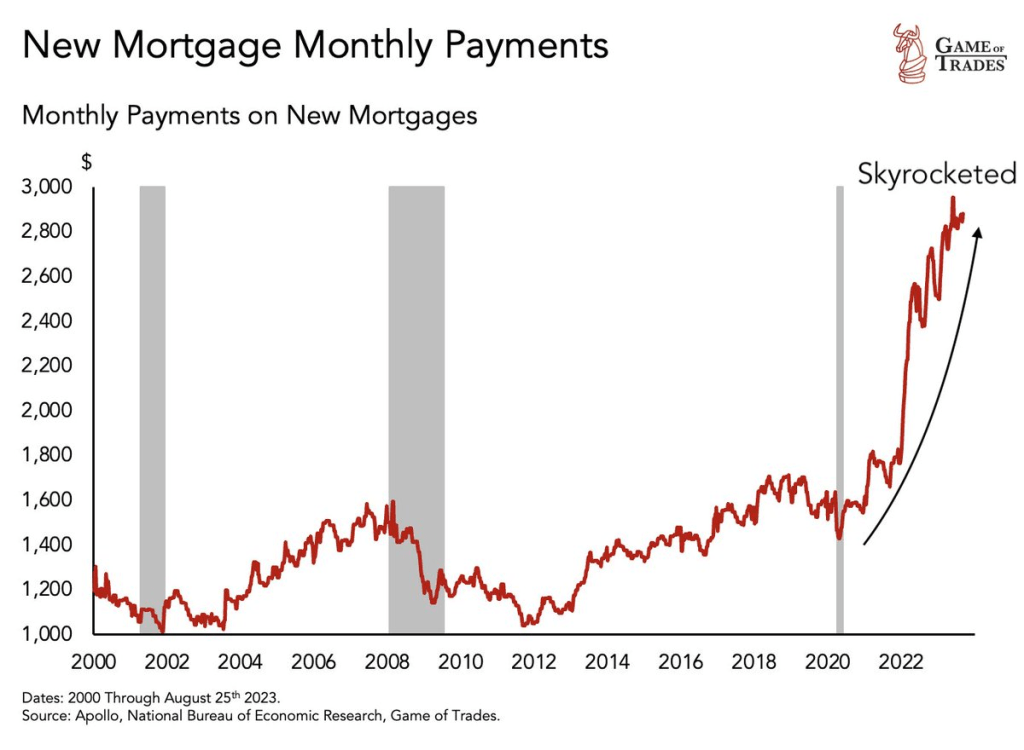
On the residential side, The Fed is helping drive mortgage payments through the roof!
The Federal Reserve reminds me of The Stones’ song “Tumbling Dice.” Why? The Fed can’t tell if inflation is cooling or re-accelerating. Hence, they are just rolling dice.
Let’s start with mortgage rates, a critical component of the housing and CRE markets. Mortgage rates remain up 163% since 2021, not great for housing affordability. Despite recent small declines in the mortgage rate. The 10Y-2Y Treasury curve is also going deeper into reversion … again.
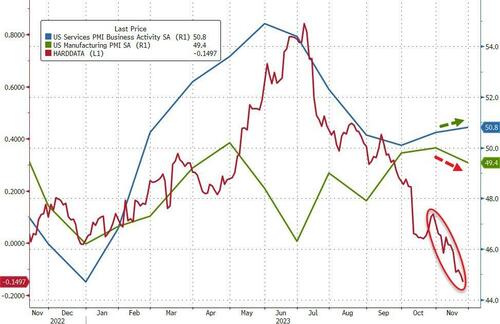
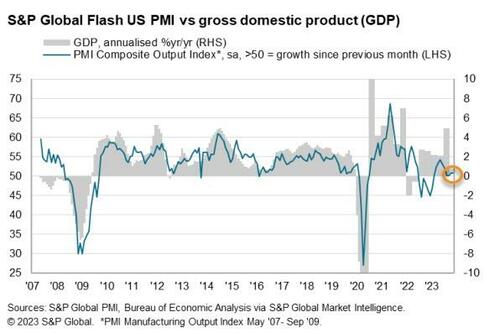
However, the data was more mixed with US Manufacturing falling more than expected to 49.4 – back into contraction – (vs 49.9 exp) from 50.0 in October. However, US Services unexpectedly rose from 50.6 to 50.8 (exp 50.3).
“The US private sector remained in expansionary territory in November, as firms signalled another marginal rise in business activity. Moreover, demand conditions – largely driven by the service sector – improved as new orders returned to growth for the first time in four months.
The upturn was historically subdued, however, amid challenges securing orders as customers remained concerned about global economic uncertainty, muted demand and high interest rates.
Businesses cut employment for the first time in almost three-and-a-half years in response to concerns about the outlook. Job shedding has spread beyond the manufacturing sector, as services firms signalled a renewed drop in staff in November as cost savings were sought.
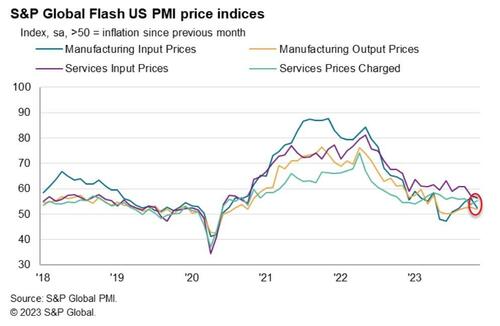
“On a more positive note, input price inflation softened again, with cost burdens rising at the slowest rate in over three years. The impact of hikes in oil prices appear to be dissipating in the manufacturing sector, where the rate of cost inflation slowed notably.
Although ticking up slightly, selling price inflation remained subdued relative to the average over the last three years and was consistent with a rate of increase close to the Fed’s 2% target.”
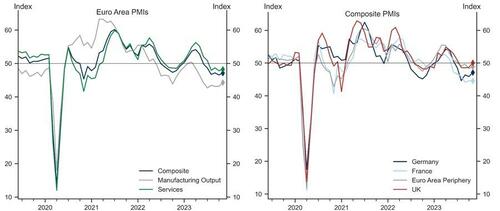
The US data comes after yesterday’s Euro area composite flash PMI increased by 0.6pt to 47.1, above consensus expectations, driven by a meaningful acceleration in Germany and the periphery, partially offset by a marginal decline in France. In the UK, the composite flash PMI improved meaningfully and entered expansionary territory at 50.1, above consensus expectations, on the back of a pickup in both sectors, with the services sector index entering positive territory at 50.5.
Goldman sees three main takeaways from today’s data.
First, we see a potential turning point in Euro area activity, with forward-looking indicators all improving in November, potentially setting a positive stage for the remainder of the year and the beginning of 2024. While the improvement seems to be broad-based, the upside surprises in the manufacturing sector in Germany and the Euro area as a whole may point to early signs of the sector’s revival.
Second, inflationary pressures, after moderating for some time, show signs of renewed intensification in the Euro area, as reflected by the output and input price components ticking up in November.
Third, UK growth momentum was meaningfully better than last month, and is picking up across the board, with the headline and services indices coming in above 50. This, however, is now accompanied by an increase in cost pressures, with both the input and output price indices edging up in November.
Finally, back to the US, S&P Global found that US business uncertainty was also heightened among US firms, as expectations regarding the year-ahead outlook slipped to the weakest since July.
A record 130.7 million people are expected to shop in stores and online in the U.S. on Black Friday this year, the National Retail Federation (NRF) estimates. The event is known for crowds lining up at big-box stores at dawn to scoop up discounted TVs and home appliances.
But at 6 a.m. on Friday at a Walmart in New Milford, Connecticut, the parking lot was only half full.
“It’s a lot quieter this year, a lot quieter,” said shopper Theresa Forsberg, who visits the same five stores with her family at dawn every Black Friday. She was at a nearby Kohl’s (KSS.N) store at 5 a.m.
Fifth Avenue, one of the world’s top shopping streets, is dead quiet on Black Friday — at least by New York’s boisterous standards.
The strip of high-end shops from brands like Louis Vuitton and Cartier has largely recovered since its pandemic lull, where vacancies had once reached nearly 30% in Midtown East. Some vestiges of that struggle remain, with a few empty storefronts covered up or filled with little art installations. Yet the street has managed to keep its title as the most expensive retail area on the planet by rent per square foot, according to Cushman & Wakefield.
Mortgage rates up 163% since 2021, manufacturing PMI in contraction and Black Friday shopping muted. Not good. The Fed is rolling the dice on what to do next.
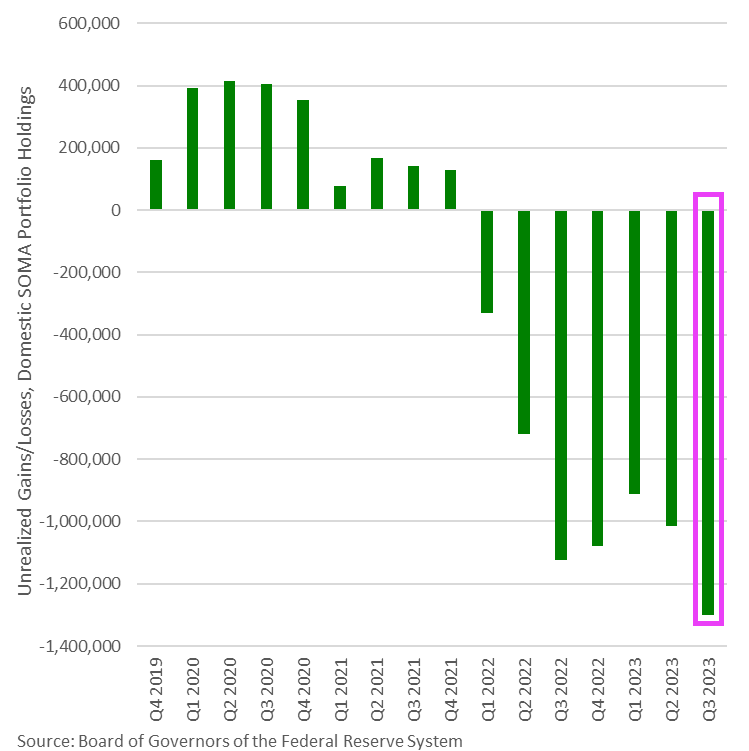
Specifically when The Federal Reserve can post massive unrealized losses and US taxpayers foot the bill? Wouldn’t it be nice to be a private organization that sends your losses to US Treasury??
The US Federal Reserve is a private organization that engages in legal interest rate manipulation and gets to send it losses to US Treasury.
Fed’s unrealized losses on the balance sheet just broke $1.3 trillion for first time ever – truly unprecedented; the amortized cost is 20.4% more than the mark-to-market price of the balance sheet; recall that selling a devalued security reduces the impact on the money supply.
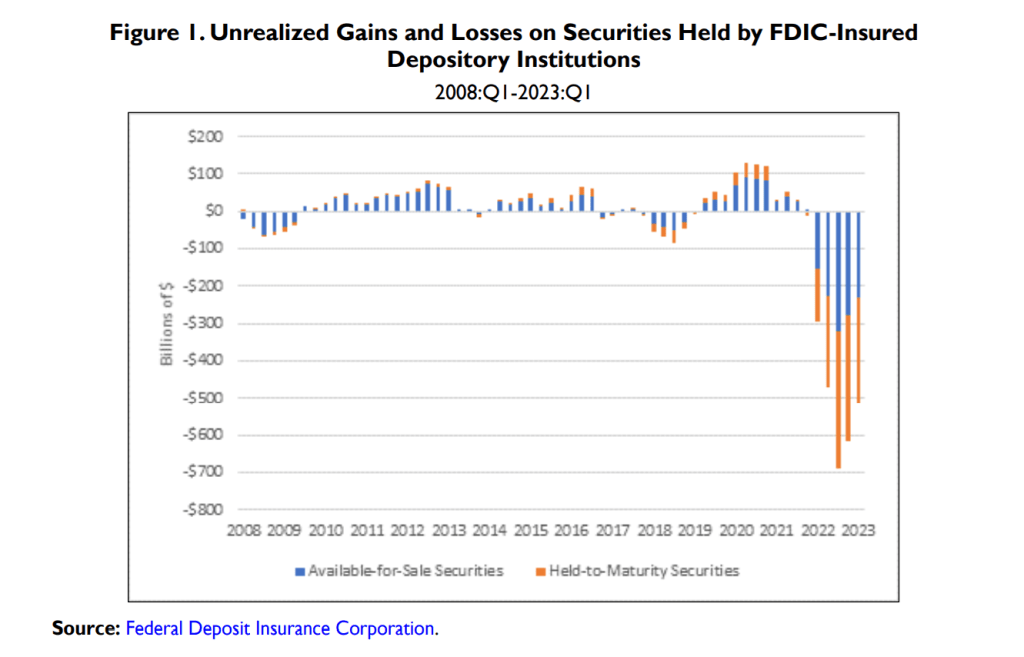
FDIC-insured banks are suffering massive losses from Bidenomics too.
US bank credit growth has been negative for 16 straight weeks.
The Fed is on my list of organizations that should be dismantled and done away with.


You must be logged in to post a comment.