The Federal Reserve will be the backstop of the Treasury market this year to alleviate dysfunction resulting from its increasing size and the retreat of regular buyers.
That’s the view of Credit Suisse Group AG analyst Zoltan Pozsar, who in a note to clients Friday predicted the Fed will restart asset purchases during the summer of 2023.
In Pozsar’s analysis, relative-value funds won’t buy Treasuries unless they cheapen a lot relative to overnight index swaps, and banks with sagging reserves are more likely to tap the funding markets than to buy Treasuries. FX-hedged buyers have been “priced out,” and geopolitical events have reduced large reserve managers’ appetite for US debt, he said.
Flagging demand from marginal buyers will depress demand for Treasury auctions, sparking selloffs in equities, credit and emerging markets, according to Pozsar.
“This is a ‘checkmate-like’ situation,” he wrote. “The Fed won’t be a pivot and the terminal rate may have to go higher still, neither of which augurs well for either risk assets or Treasuries.”
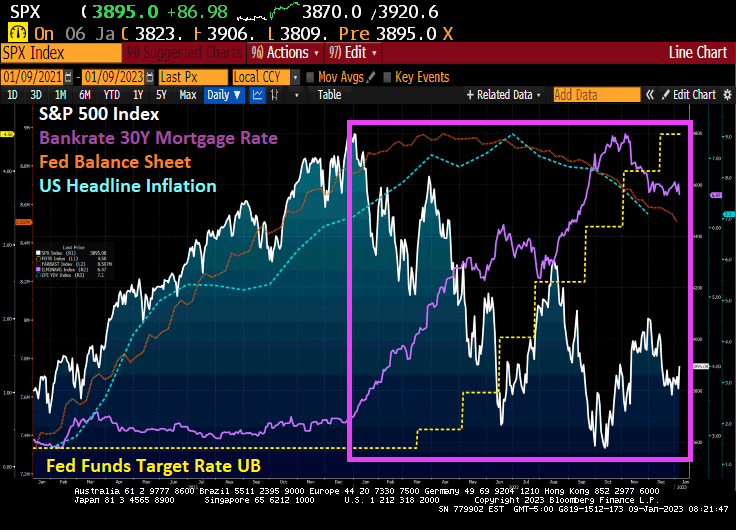
As The Fed started to raise rates (yellow line) to fight inflation (blue dashed line), the S&P 500 index started to fall. Note that The Fed’s balance sheet (purple line) is mirroring the inflation rate.
Fed Funds Futures point to Zoltan’s reversal in June 2023.
Will The Fed pivot? Zoltan says yes, the talking Fed heads say no.
US headline inflation began to soar as soon as Joe Biden became President. A combination of massive stimulus spending related to the Covid economic shutdown and his war on fossil fuels, driving up gasoline and diesel fuel prices. In other words, headline inflation rose from 1.4% Year-over-year (YoY) at the end of December 2020 to 9.1% YoY in June 2021. It has now simmered down to 7.1% YoY as The Fed continues to remove monetary stimulus.
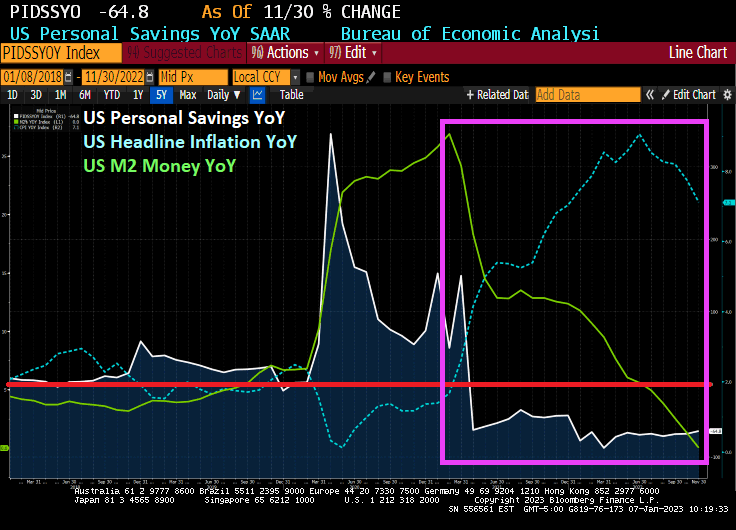
How have consumers coped with inflation caused by massive Federal spending and Biden’s anti-fossil fuel policies? In November, personal savings dropped -64.8% YoY. This marks 20 straight months of declining personal savings.
US M2 Money growth YoY is now … 0%. That is the lowest in US history.
The December jobs report is out and the top-line number is … 223k jobs were added. That is strong enough to give The Federal Reserve the green light to raise rates.
But while it was a good jobs report, it shows the inflation tax in full view. Hourly wage growth year-over-year (YoY) was 4.6% in December. Unfortunately, the inflation tax was 7.1% in November. If we assume that the inflation rate in December is the same, the REAL hourly wage growth was -2.5% YoY.
But it is likely that headline inflation cooled a bit in December as The Fed continues tightening. But unless headline inflation cooled to 4.6% YoY, the inflation tax is positive and destructive.
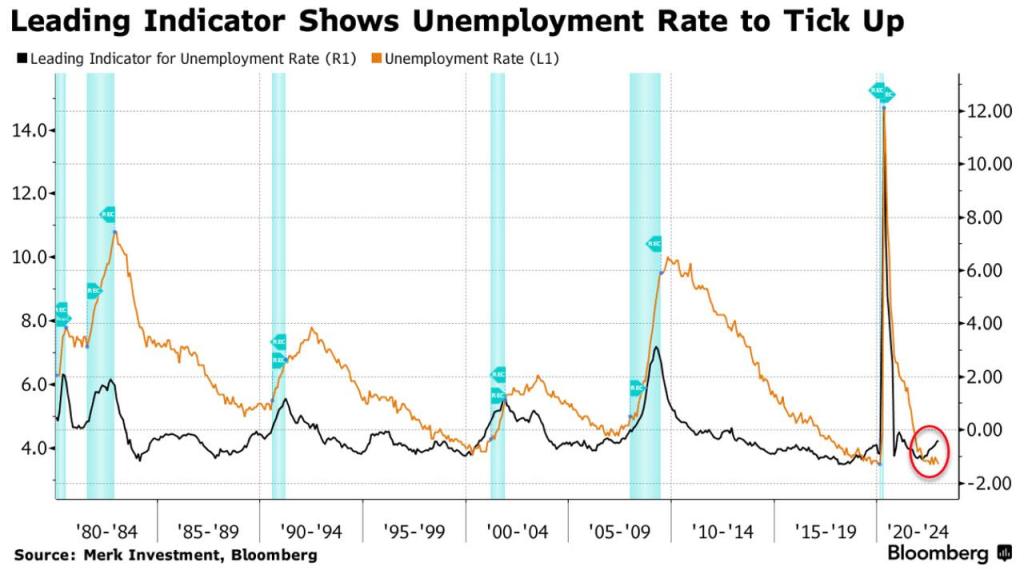
The average weekly hours employed fell to 34.3 while U-3 unemployment rate fell.
Here are the rest of the numbers.
The most glaring data point is Full-Time Workers -1K; Part-Time Workers +679K.
And the leading indicator for unemployment is ticking up.
Silvergate Capital Corp. shares plunged after the bank said the crypto industry’s meltdown triggered a run on deposits, prompting the company to sell assets at a steep loss and fire 40% of its staff.
Customers withdrew about $8.1 billion of digital-asset deposits from the bank during the fourth quarter, which forced it to sell securities and related derivatives at a loss of $718 million, according to a statement Thursday. Executives said on a conference call that Silvergate may become a takeover target.
“In response to the rapid changes in the digital asset industry during the fourth quarter, we took commensurate steps to ensure that we were maintaining cash liquidity in order to satisfy potential deposit outflows, and we currently maintain a cash position in excess of our digital asset related deposits,” Chief Executive Officer Alan Lane said in the statement.
The collapse of Sam Bankman-Fried’s FTX sparked a crisis for Silvergate, which held deposits for FTX units and Alameda Research, the trading firm at the heart of the crypto exchange’s downfall. Lawmakers are also scrutinizing the bank.
Silvergate plunged 44% to $12.34 at 9:48 a.m. in New York, the steepest decline since the La Jolla, California-based company went public in November 2019. The stock is down 91% in the past 12 months. Signature Bank, which said in December that it intended to shed as much as $10 billion deposits from digital-asset clients, fell 5.8% to $111.05.
Silvergate Capital Corporation operates as a bank holding company. The Company, through its subsidiary Silvergate Bank provides a banking platform for innovators, especially in the digital currency industry, and developing product and service solutions addressing the needs of entrepreneurs. Silvergate Capital serves customers in the United States.
Silvergate once saw the crypto industry as giving it a huge growth opportunity. Over the course of a decade, it transformed itself from a firm catering to small businesses into a publicly traded company known for providing banking services to major crypto clients such as Coinbase Global Inc. and Gemini Trust Co. — as well as FTX and Alameda Research.
At least Solana is on the rise.
Sam Bankman-Fried will go down in history as commiting one of the greatest financial frauds in world history. Why did he have four meetings with Biden’s top staffers prior to FTX’s crash and burn?
And with it, ISM Manufacturing Report for December is showing weakness. New orders (orange line) is down to 45.2 (below 50 is contraction) and the prices paid is down to 39.4 (white line). All this is happening as The Fed raises its target rate (yellow line) and removes monetary stimulus (green line).
This gives us “The Devil’s Tower” looking economic spike after massive Covid-related monetary stimulus and Federal government repeated stimulus.
Speaking of Already Gone, look at the US Treasury 10Y-2Y yield curve with slowing M2 Money growth. Yield curve inversion is more about vanishing M2 Money growth than it is a forecast of recession.
Mortgage applications generally nosedive in the last two weeks of the year (seasonality effect), but Federal Reserce monetary tightening to fight inflation is making the last two weeks worse than usual.
Mortgage applications decreased 13.2 percent from two weeks earlier, according to data from the Mortgage Bankers Association’s (MBA) Weekly Mortgage Applications Survey for the week ending December 30, 2022. The results include adjustments to account for the holidays. It marked the lowest mortgage applications since 1996.
The Market Composite Index, a measure of mortgage loan application volume, decreased 13.2 percent on a seasonally adjusted basis from two weeks earlier. On an unadjusted basis, the Index decreased 39.4 percent compared with the two weeks ago. The holiday adjusted Refinance Index decreased 16.3 percent from the two weeks ago (2WoW) and was 87 percent lower than the same week one year ago (YoY). The seasonally adjusted Purchase Index decreased 12.2 percent from two weeks earlier. The unadjusted Purchase Index decreased 38.5 percent compared with the two weeks ago and was 42 percent lower than the same week one year ago.
Notice that purchase applications are declining with slowing M2 Money growth showing the impact of The Fed trying to remove the punchbowl.
The week-over-week (or WoW) numbers are pretty bad.
First, banks are stashing cash with the New York Fed on an “overnight basis” although it is looking pretty permanent to me. Repos (or repuchase agreements) soared to $2.55 TRILLION as of 12/30/22.
But this morning we see the US Treasury 10-year plummeting -15 basis points. As I used to tell my University of Chicago, Ohio State and George Mason finance students, any 10 basis point shift (plus or minus) is a big deal. Something is happening.
The 10-year Treasury yield plunging -15 bps is a “good thing” for the mortgage market in that US mortgage rates will likely follow suit and fall.
Today is all quiet of the financial market front since the US stock
Today is all quiet of the financial market front since the US stock and bond markets are closed. But as the new year starts, we have to ask the following question: is the US already in a recession?
A simple measure of IMPENDING recession is the US yield curve which is currently inverted. Typically, a recession occurs within months of the yield curve inverting. But if we look at real GDP growth, the Atlanta Fed GDP tracker is at 3.7%, so no recession there (two consecutive quarters of negative GDP growth is often used as a measure of recession).
But another indicator of “all is not well” is the CBOE Put/Call Ratio. Typically, the Put/Call Ratio spikes during a recession. But on December 28, 2022, the Put/Call Ratio spiked to its highest level since 1996. Although it has calmed down to 0.84 on December 30, 2022. Suffice it to say that there is enormous uncertainty in markets.
Covid begat massive Fed monetary stimulus and an excuse for the Federal government to go on a series of spending sprees (Covid “relief”, Instrastructure, Inflation Reduction, and now the $1.7 Trillion pork-laden Omnibus bill). Now that historic big spender Nancy Pelosi (CA-D) is no longer Speaker, will her successor have such a voracious spending appetite? The US economy is still benefitting from Covid-related stimulus which also helped generate 40-year highs in inflation.
Thanks to inflation, US workers have had 20 consecutive months of negative wage growth. But as M2 Money growth slows to a halt, so will real average hourly earnings.
The traditional measures of recession (unemployment and Real GDP growth) are NOT pointing to recession, but 20 straight months of negative wage growth points to bad news for workers. Throw in an inverted yield curve and massive volatility in the CBOE Put-Call Ratio and we have a party … that I don’t want to attend.
As we begin 2023 (and I am still bummed-out over Ohio State University losing a nail-bitter to Georgia in the Peach Bowl), we need to look at the condition of one of the most important sectors of the US economy.\, housing.
If we look at the US Housing Leading Growth index (courtesy of RecessionAlert.com) has slumped to its worst reading since the recessions of 1982 and 2008.
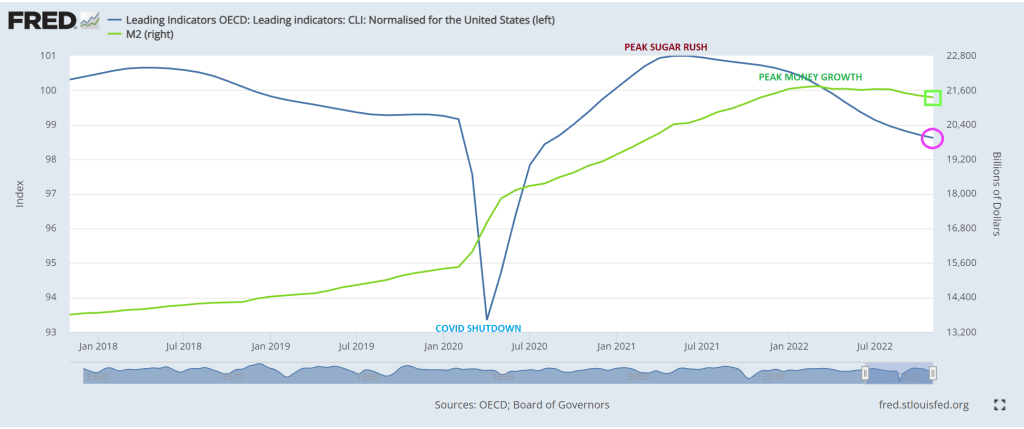
And then we have the OCED leading indicators for the US falling as M2 Money growth slows.
My favorite chart shows US home price growth falling faster than University of Michigan football team’s national championship home hopes.
Will this prompt The Federal Reserve to pivot? Only time will tell.
2022 is one of the record books and not in a Tiger Woods way. Call it a year of pain.
First, the US enacted policies that drove up energy prices (goin’ green) that reverberated through the entire economy in the form of higher prices. Second, The Federal Reserve, in attempt to combat runaway inflation, started removing the excessive monetary stimulus that had been around since Fed Chair Bernanke initiated QE, the seemingly unlimited purchase of Treasury and Agency MBS securities. Janet Yellen continued the massive asset purchases and zero interest rate policies or ZIRP. Now that inflation has struck the American middle class hard, we are seeing Fed Chair Powell doing what Bernanke and Yellen wouldn’t do — remove the monetary punchbowl.
Using Robert Shiller’s on line data, US stocks and bonds have had an awful year, the worst combined year since 1871.
US equity returns have been demolished under the NEW dual mandate (goin’ green = rising prices = Fed tightening).
Let’s see how two of the most famous investment gurus did in 2022, Warren Buffet and Cathie Wood. Buffet’s Bershire Hathaway Class A equity was UP 4% in 2022, while Cathie Wood’s ARK Innovation ETF collapsed by -67% in 2022.
Here is the clinker. The US economy (as well as the global economy) seem dependent on “cheap money” from Central Banks like The Federal Reserve. So the question is … will The Fed pivot? Fed talking heads are saying no, but Fed Funds investors are saying yes to a pivot after June 2023.
Ulysses S Grant was the President the last time the combined stock and bond market was this bad.


You must be logged in to post a comment.