Bidenomics, the massive Federal spending spree that helped drive inflation to 40 year highs, is the most top-down Soviet-style command economy model imaginable.
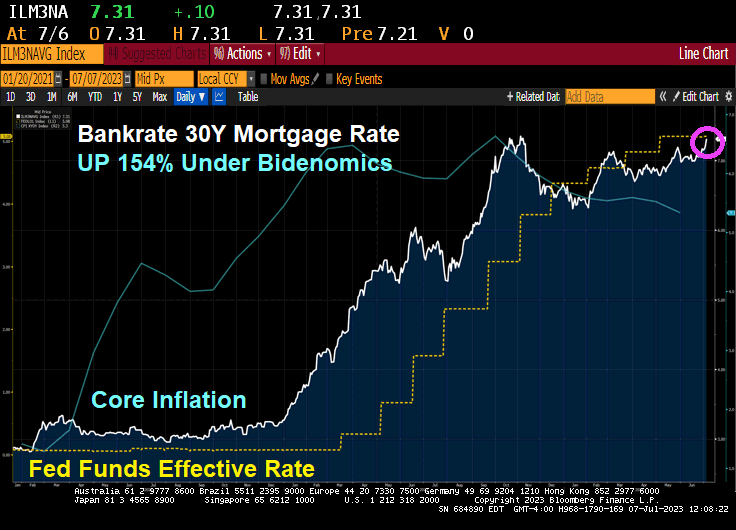
As The Fed battles Bidenflation, the 30-year mortgage rate has now risen to 7.31%, a far cry from 2.88% when Biden was installed as President. That is a 154% increase in the 30-year mortgage rate under Bidenomics.
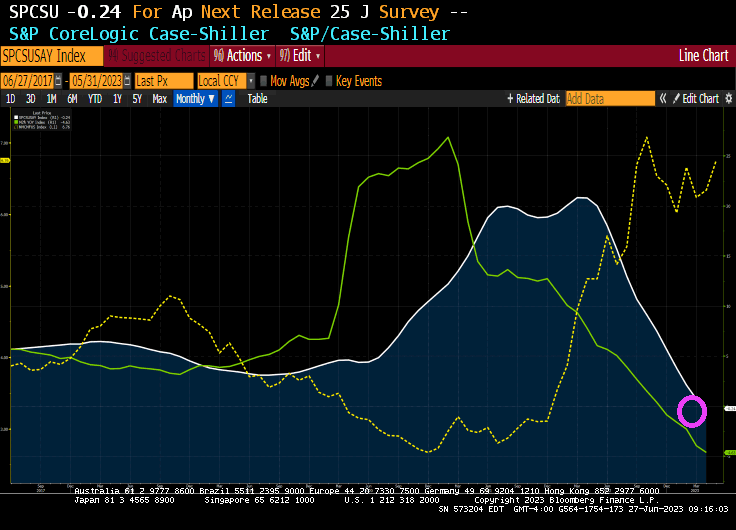
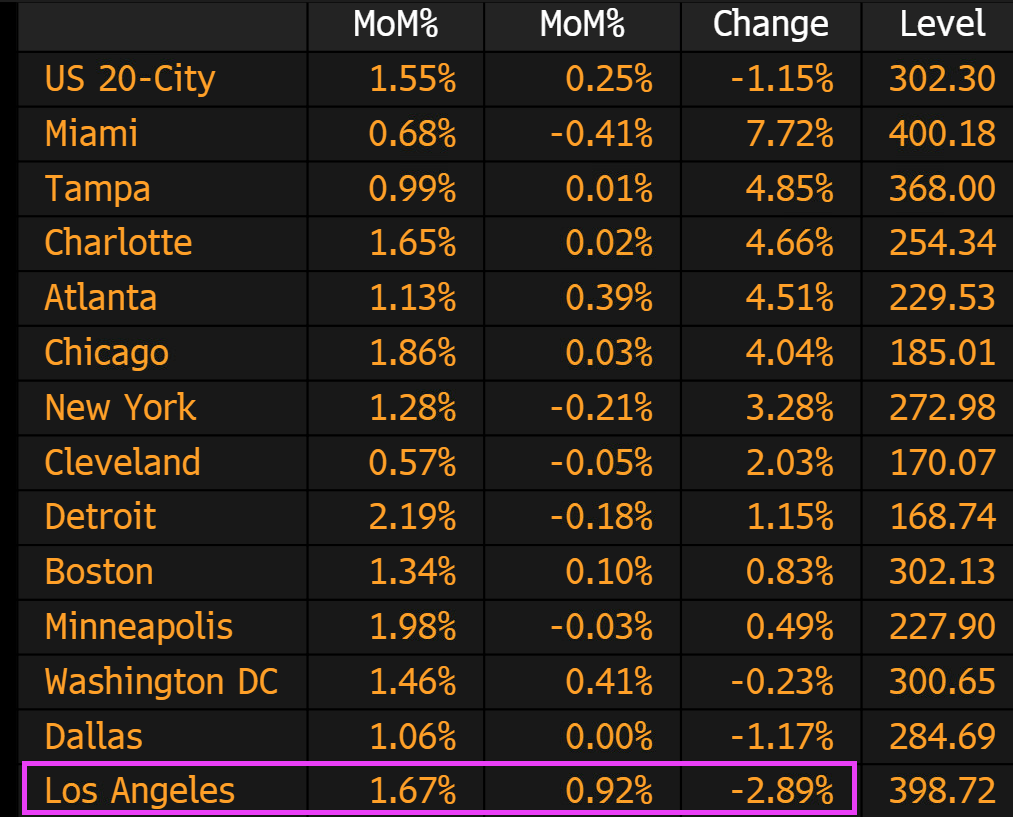
The S&P CoreLogic Case-Shiller U.S. National Home Price NSA Index, covering all nine U.S. census divisions, reported a -0.2% annual decrease in April, down from a gain of 0.7% in the previous month. The 10-City Composite showed a decrease of -1.2%, down from the -0.7% decrease in the previous month. The 20-City Composite posted a -1.7% year-over-year loss, down from -1.1% in the previous month.
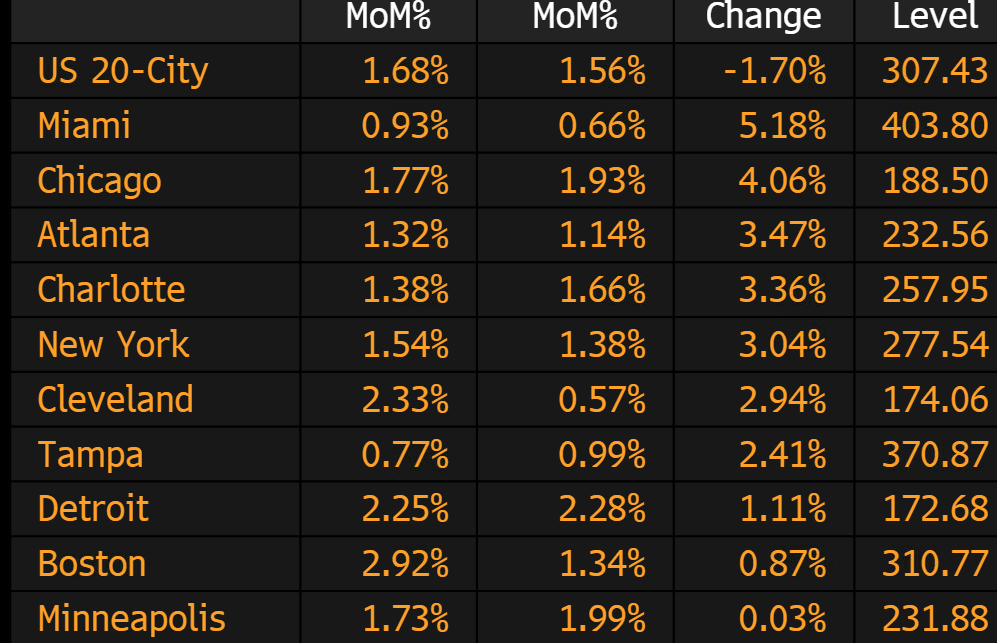
The winners in April? Miami and … Chicago?
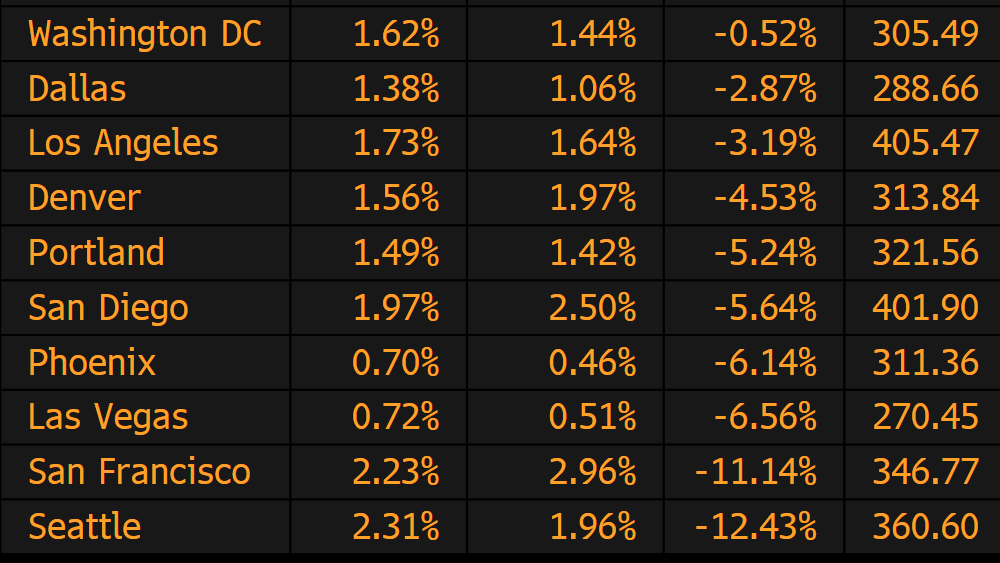
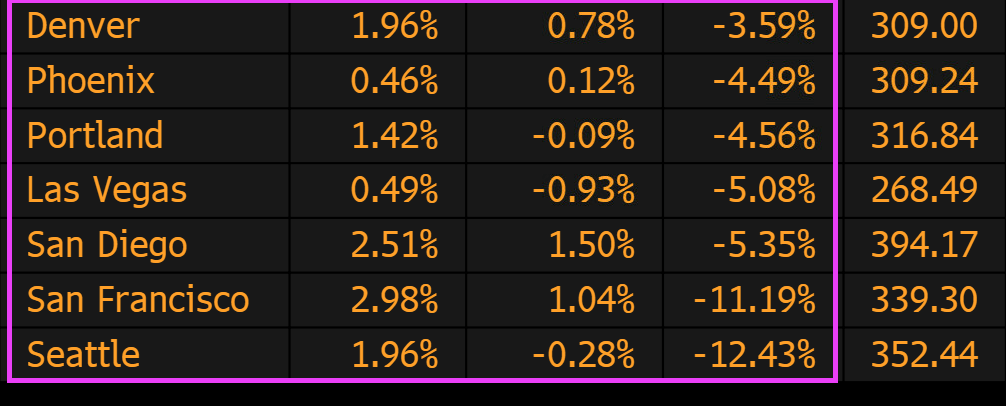
The biggest losers in April? Seattle and San Francisco both suffered YoY losses over -11%.
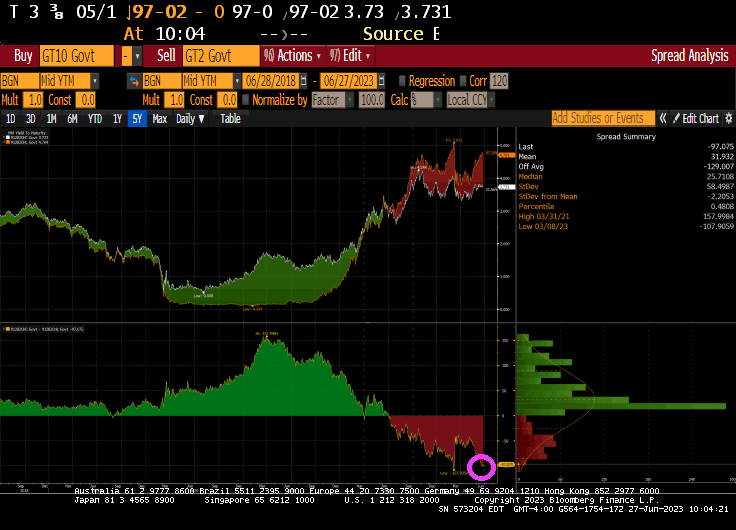
The US Treasury 10Y-2Y yield curve remains steeply inverted at -97 basis points.
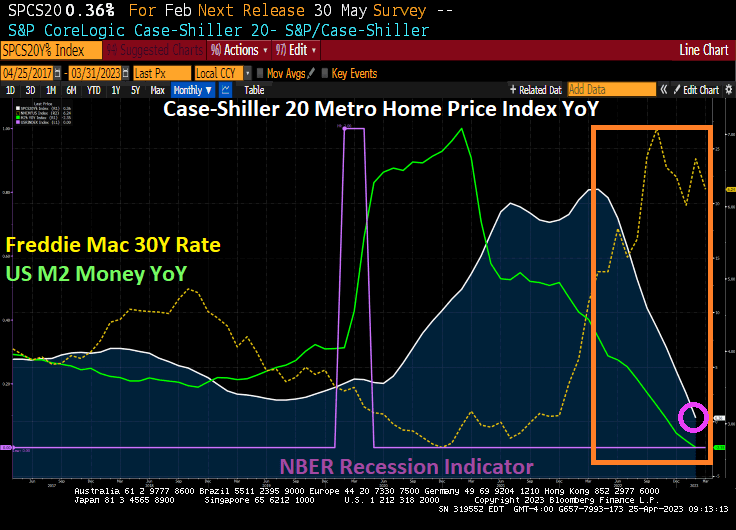
Resident Biden and Congress unleashed inflation of the unsuspecting American middle class. Now real estate is starting to feel the pain of Fed monetary tightening.
For March, the S&P CoreLogic Case-Shiller 20 metro home price index actually fell -1.15% YoY as The Fed continues to tighten its monetary noose on the US economy.
The biggest losers in terms of home prices? The west! Los Angeles, Denver, Phoenix, Portland, Las Vegas, San Diego, San Francisco and Pramila Jayapal-ville, Seattle.
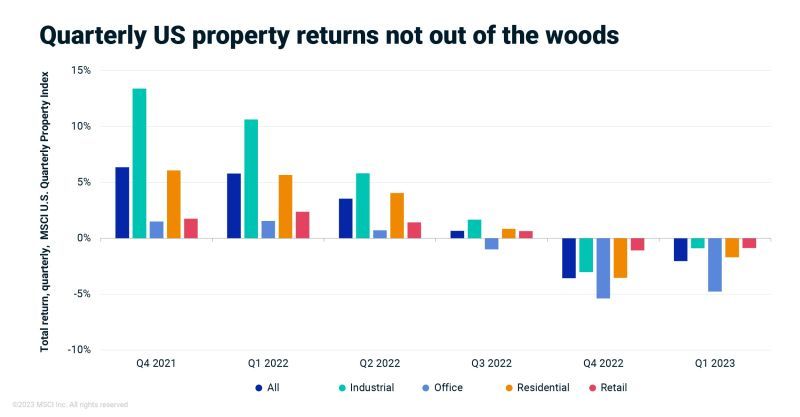
On the commercial real estate side, quarterly returns were all negative in Q1 2023. Especially office space.
California Governor Gavin Newsom (Nancy Pelosi’s newphew). “Watch me make housing values collapse!” Abracadabra!
This is last data dump for mortgage demand (applications) before Biden’s idiotic woke mortgage policies go into effect (taxing those with good credit to subsidize those with lousy credit) take effect. I call this Bolshevik Biden’s Mortgage Market.
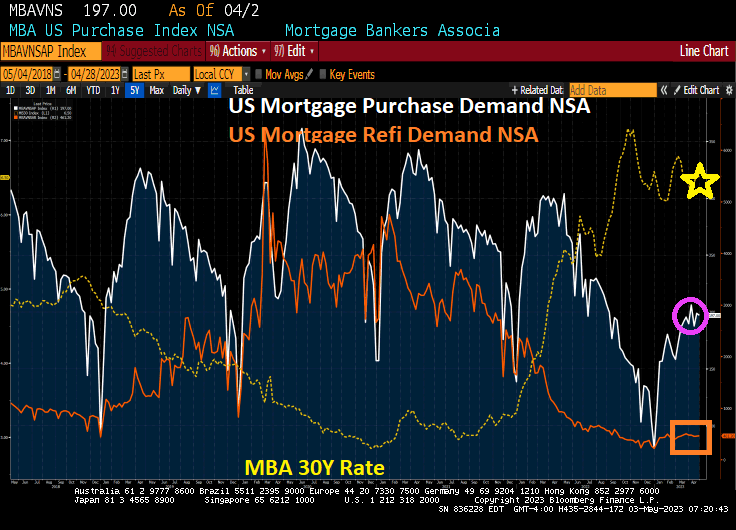
Mortgage applications decreased 1.2 percent from one week earlier, according to data from the Mortgage Bankers Association’s (MBA) Weekly Mortgage Applications Survey for the week ending April 28, 2023.
The Market Composite Index, a measure of mortgage loan application volume, decreased 1.2 percent on a seasonally adjusted basis from one week earlier. On an unadjusted basis, the Index decreased 0.4 percent compared with the previous week. The Refinance Index increased 1 percent from the previous week and was 51 percent lower than the same week one year ago. The seasonally adjusted Purchase Index decreased 2 percent from one week earlier. The unadjusted Purchase Index decreased 1 percent compared with the previous week and was 32 percent lower than the same week one year ago.
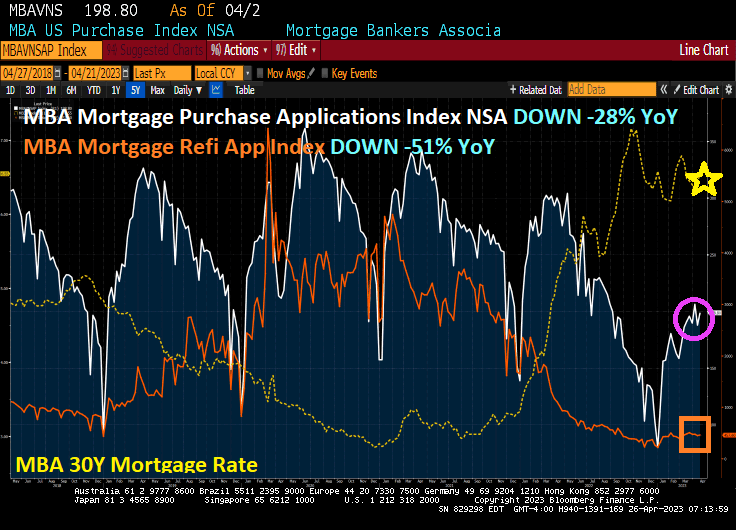
Mortgage applications increased 3.7 percent from one week earlier, according to data from the Mortgage Bankers Association’s (MBA) Weekly Mortgage Applications Survey for the week ending April 21, 2023.
The Market Composite Index, a measure of mortgage loan application volume, increased 3.7 percent on a seasonally adjusted basis from one week earlier. On an unadjusted basis, the Index increased 5 percent compared with the previous week. The Refinance Index increased 2 percent from the previous week and was 51 percent lower than the same week one year ago. The seasonally adjusted Purchase Index increased 5 percent from one week earlier. The unadjusted Purchase Index increased 6 percent compared with the previous week and was 28 percent lower than the same week one year ago.
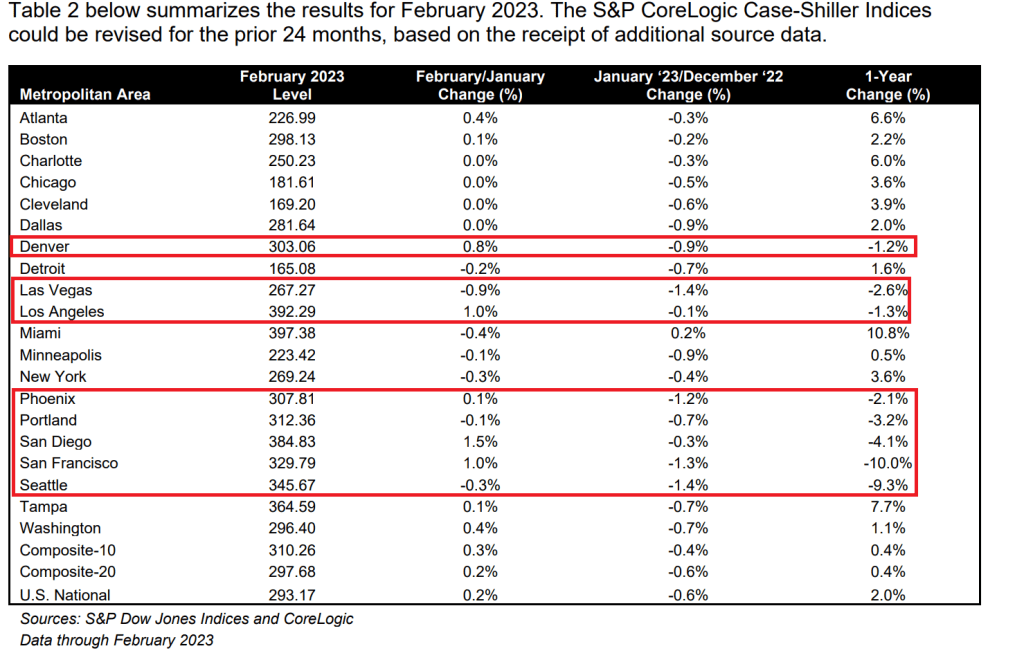
Drifting into darkness, we have the West getting battered with my old hometown of San Francisco leading the pack at -10% YoY with Seattle down -9.3% YoY.
You know things are bad out west when Cleveland, Detroit and Chicago are gaining ground in prices. And Miami was up 10.8% YoY.
Mortgage applications increased 5.3 percent from one week earlier, according to data from the Mortgage Bankers Association’s (MBA) Weekly Mortgage Applications Survey for the week ending April 7, 2023.
The Market Composite Index, a measure of mortgage loan application volume, increased 5.3 percent on a seasonally adjusted basis from one week earlier. On an unadjusted basis, the Index increased 6 percent compared with the previous week. The Refinance Index increased 0.1 percent from the previous week and was 57 percent lower than the same week one year ago. The seasonally adjusted Purchase Index increased 8 percent from one week earlier. The unadjusted Purchase Index increased 9 percent compared with the previous week and was31 percent lower than the same week one year ago.
Well, the regional banking crisis has one positive outcome: mortgage rates dropped -46 basis points since last week. The result? Mortgage demand increased 2.9 percent week-over-week (WoW). Although I don’t recommend banking incompetence by bank management and “regulators” as a strategy to increase mortgage demand.
Mortgage applications increased 2.9 percent from one week earlier, according to data from the Mortgage Bankers Association’s (MBA) Weekly Mortgage Applications Survey for the week ending March 24, 2023.
The Market Composite Index, a measure of mortgage loan application volume, increased 2.9 percent on a seasonally adjusted basis from one week earlier. On an unadjusted basis, the Index increased 3 percent compared with the previous week. The Refinance Index increased 5 percent from the previous week and was 61 percent lower than the same week one year ago. The seasonally adjusted Purchase Index increased 2 percent from one week earlier. The unadjusted Purchase Index increased 2 percent compared with the previous week and was 35 percent lower than the same week one year ago.
The rest of the story.
We need a doctor to fix this mess, just not Dr. Yellen or Dr. Jill.
US mortgage rates fell last week by the most since the end of July, slipping below 7% and helping generate a bounce in purchase applications that otherwise remain depressed, but only in the Seasonally Adjusted data. The NON-Seasonally Adjusted data show a hefty decline.
The contract rate on a 30-year fixed mortgage decreased 24 basis points to 6.9% in the week ended Nov. 11, according to Mortgage Bankers Association data released Wednesday. The group’s index of applications to buy a home rose 4.4% — the most since June — but is still near the weakest level since 2015.
But the bounce was in Seasonally Adjusted data only. The NON-seasonally adjusted data remained depressed.
Mortgage applications decreased -10.0 percent SA from one week earlier, according to data from the Mortgage Bankers Association’s (MBA) Weekly Mortgage Applications Survey for the week ending November 11, 2022. This week’s results include an adjustment for the observance of Veterans Day.
The Refinance Index decreased -11.44% percent from the previous week and was 88 percent lower than the same week one year ago.The unadjusted Purchase Index decreased -10 percent compared with the previous week and was 46 percent lower than the same week one year ago.
Mortgage purchase applications will continue to fall in NSA terms since it is the Winter and home buying season won’t really start until January. Refinancing applications actually dropped -11.44% even with the drop in mortgage rates.
The data. As my former students know, I like the “raw” data, better known as NON-seasonally adjusted (NSA) data and avoid seasonally-adjusted data (SA) since it hides what is going on.
And on The Fed Futures Front, The Federal Reserve is still looking a hiking their target rate from 4% to just under 5%.
As The Fed takes away the massive monetary punch bowl, mortgage rates have risen to the highest since November 2008. And with the withdrawal of monetary stimulus (raising Fed Target Rate), mortgage purchase applications have declined.
Here is a photo of The Federal Reserve fighting the housing and mortgage market.


You must be logged in to post a comment.