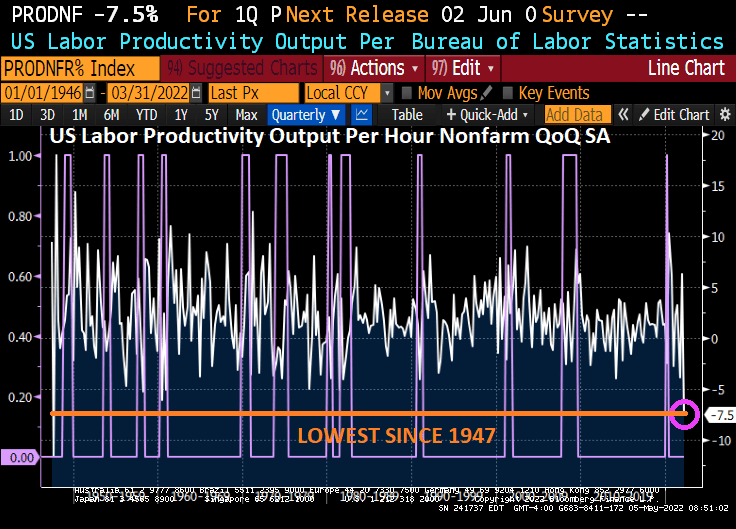
Here’s some simple Medusa math for you: negative growth + payroll gains = negative productivity. Negative productivity + high labor costs = very high unit labor costs. That’s not a pretty picture for the economy or for companies, and the Q1 figures were even worse than expected — productivity fell by 7.5%, pushing unit labor costs up by 11.6%. Nasty.
In fact, labor productivity fell to the lowest level since 1947 and President Harry Truman.
Of course, Biden’s green energy policies have led to crushing inflation.
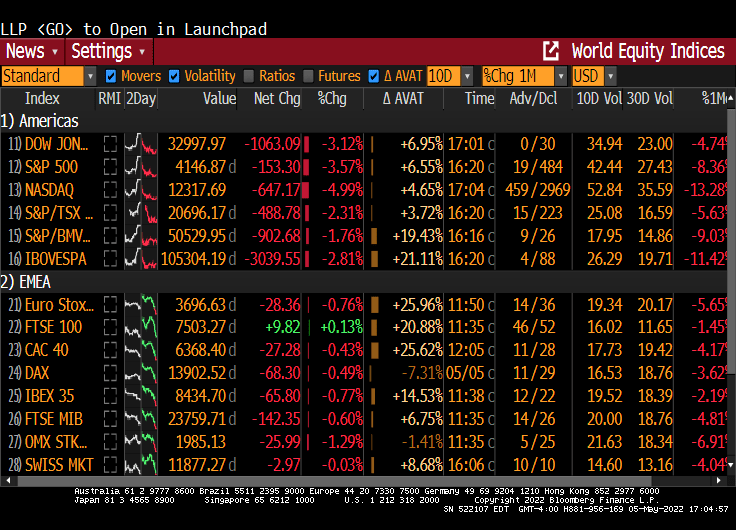
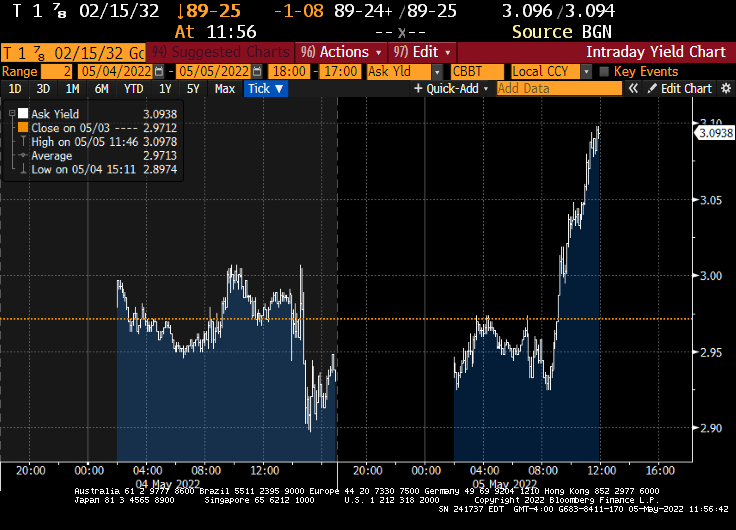
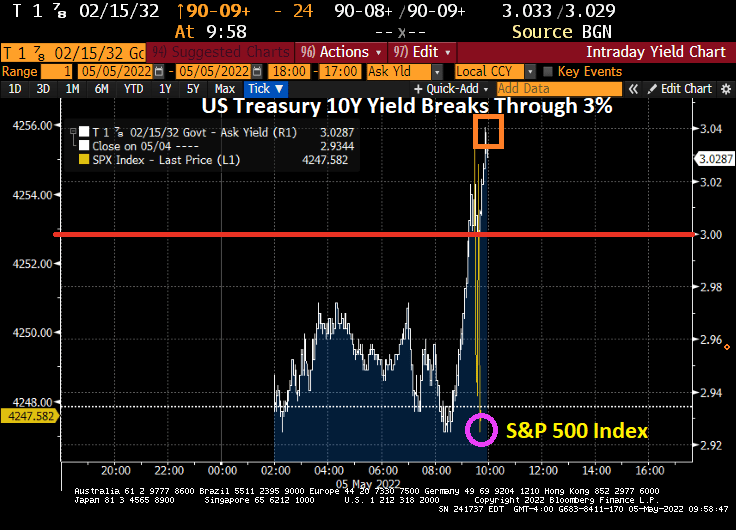
So, after Fed Chair Powell (aka, Jay The Revelator) said yesterday that “No Signs US Economy ‘Vulnerable’ To Recession”, we saw the S&P 500 index dive 1.5% and the 10-year Treasury yield break through the 3% barrier.
Biden’s policies are a Medusa-touch on the economy.
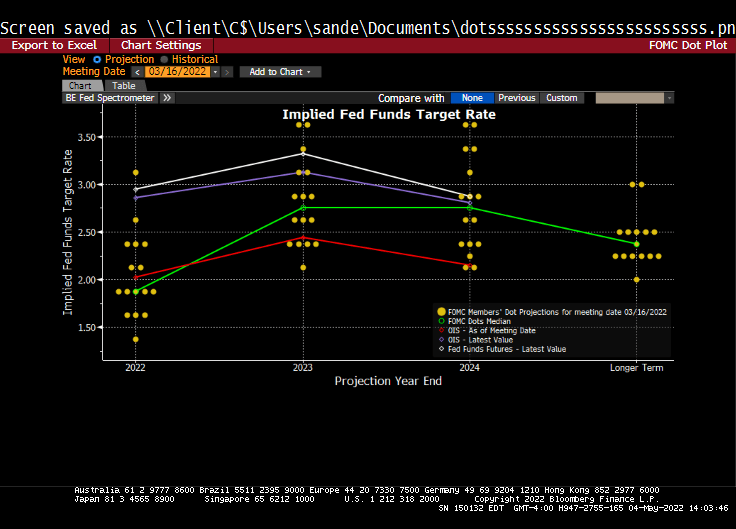
Well, the Fed’s talking heads have been saying a 50 basis point hike was coming in May … and it appeared!
And it looks like 9 rate hikes are a comin’ by February 2023.
The Fed’s Dot Plots shows a cooling of Fed rate hikes by 2024 and beyond.
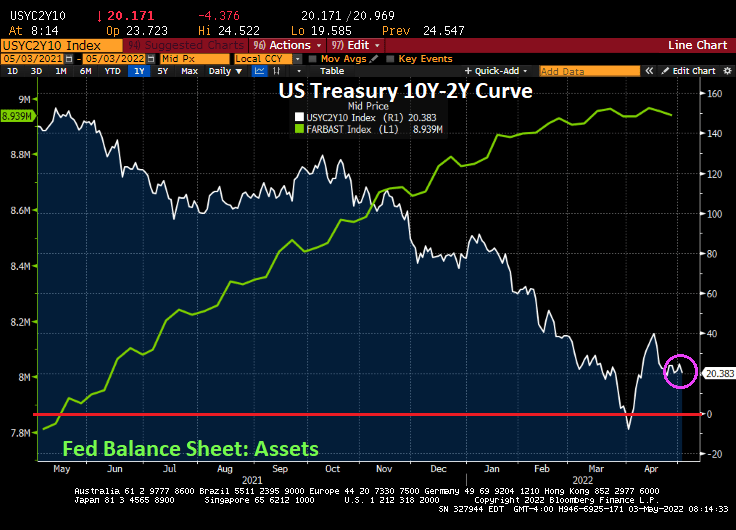
Here is the path of Balance Sheet peel-off.
The US Treasury actives curve is up by 14 bps at the 10-year tenor and up 17 bps at the 2-year tenor.
The plan will see $30 billion of Treasuries and $17.5 billion on mortgage-backed securities roll off. After three months, the cap for Treasuries will increase to $60 billion and $35 billion for mortgages.
I could read the Fed’s speech on their decision, but since The Fed has been so highly politicized, I don’t really care what they say. Only what they do.
The U.S. Treasury market is showing signs of stress that may have implications for whether the curve keeps steepening.
Over the past month the curve has retraced from an inversion to a steepening driven by a surge in yields on benchmark 10-year bonds. That has led to interesting outlier indications, as traders weigh the outlook for Federal Reserve interest rate increases and inflation.
The US Treasury yield curve has settled-in at 20.383 bps (effectively zero) as The Fed continues its war on inflation.
On the SOFR front, we see SOFR Coupons being slow to benefits from Fed rate hikes. So, SOFR Coupons are behaving like Stouffer’s lasagna, frozen and tasteless.
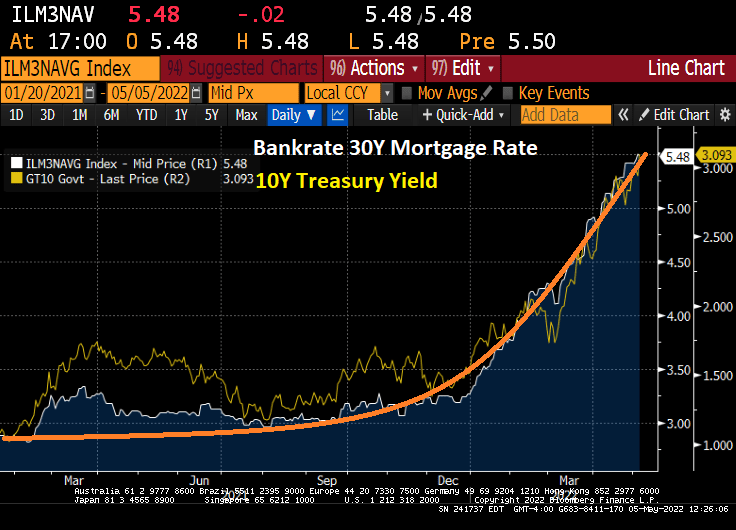
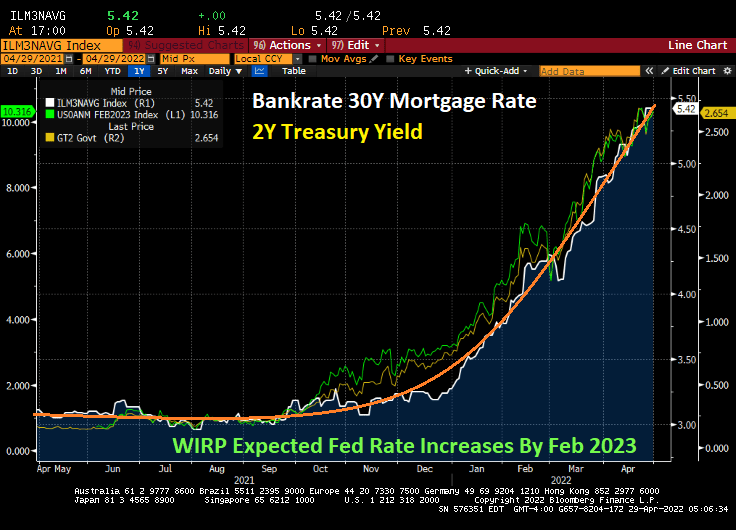
On the other hand, mortgage rates continue to soar on EXPECTATIONS of Fed rate hikes.
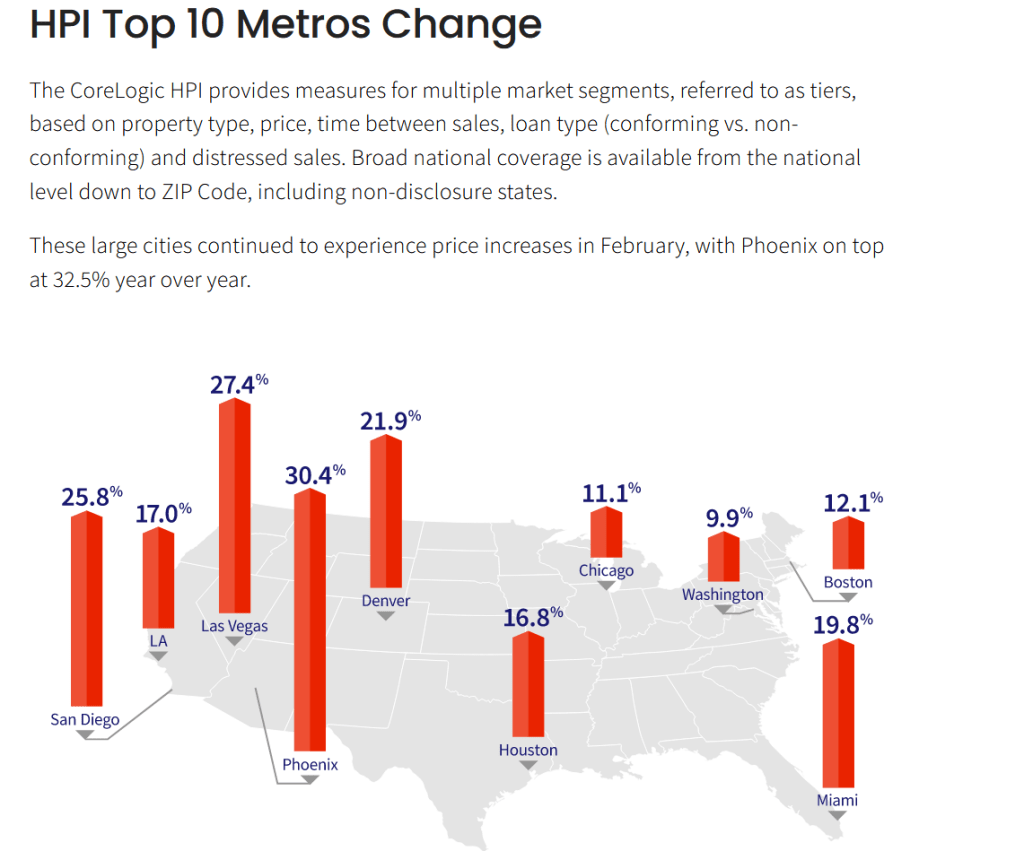
Phoenix AZ leads the top ten at 30.4% with Washington DC lagging at 9.9%.
So, its official. The Federal Reserve is best exemplified by former Yankee/Mets first baseman “Marvelous” Marv Throneberry. When players presented Mets’ manager Casey Stengel with a birthday cake but neglected to give piece of cake to Throneberry, Stengel replied to Throneberry when asked why no cake, “Because I was afraid your were going to drop it.”
Just like The Federal Reserve, the honorary Marv Throneberry of the the global economy.
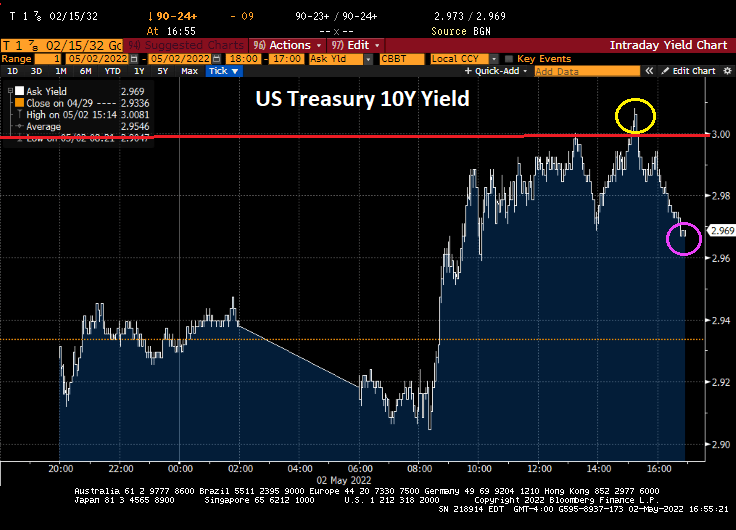
Today we saw the 10-year Treasury Note yield break through the 3% barrier, then retreat as is there was a reflecting barrier at 3%.
And in Europe, we saw a flash crash allegedly caused by Citi’s trading desk.
The selloff was triggered by a large erroneous transaction made by the U.S. bank’s London trading desk, according to people with knowledge of the matter who asked not to be identified discussing private information. A knee-jerk selloff in OMX Stockholm 30 Index in five minutes wreaked havoc in bourses stretching from Paris to Warsaw toppling the main European index by as much as 3% and wiping out 300 billion euros ($315 billion) at one point.
The US Dollar rose again as expectations of Fed monetary tightening due to inflation become a reality.
A measure of U.S. manufacturing activity unexpectedly dropped in April to the lowest level since 2020 as growth in orders, production and employment softened.
The Institute for Supply Management’s gauge of factory activity fell to 55.4 last month from 57.1, according to data released Monday. The Manufacturing Prices index remained elevated.
As the 10-year Treasury yield tries to breech the 3% barrier.
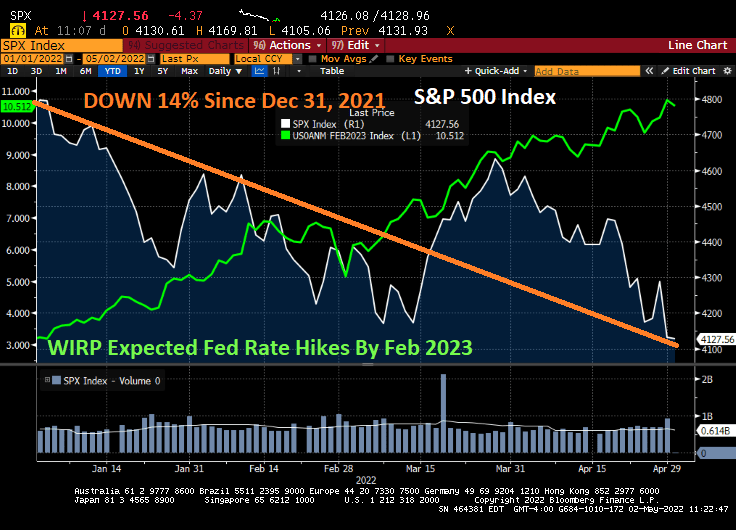
And as The Fed continues to threaten tightening of their monetary follicies, the S&P 500 index is down 14% since Dec 31, 2021.
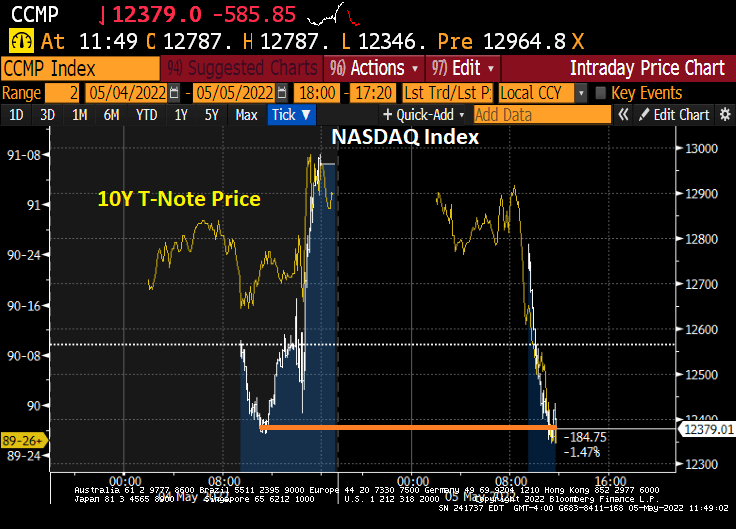
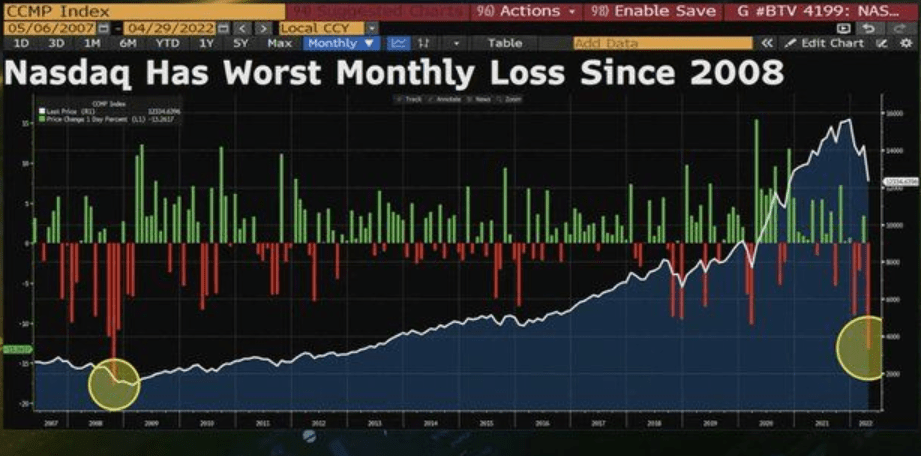
And the NASDAQ had it worst monthly loss since 2008.
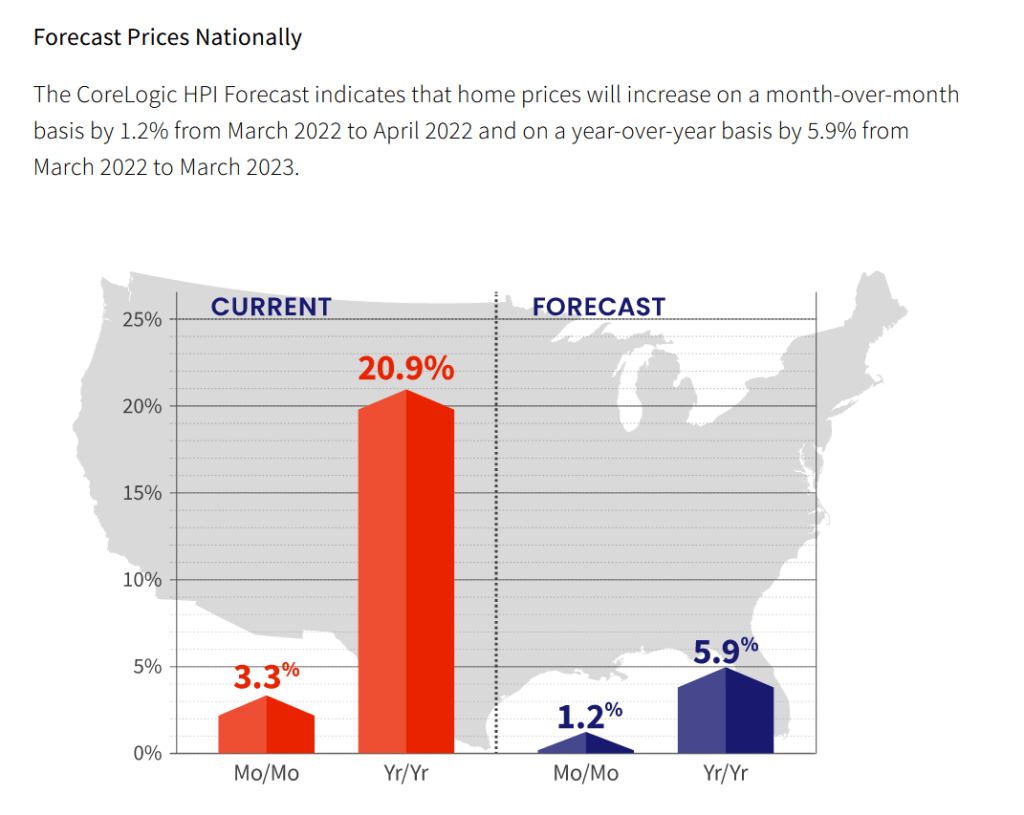
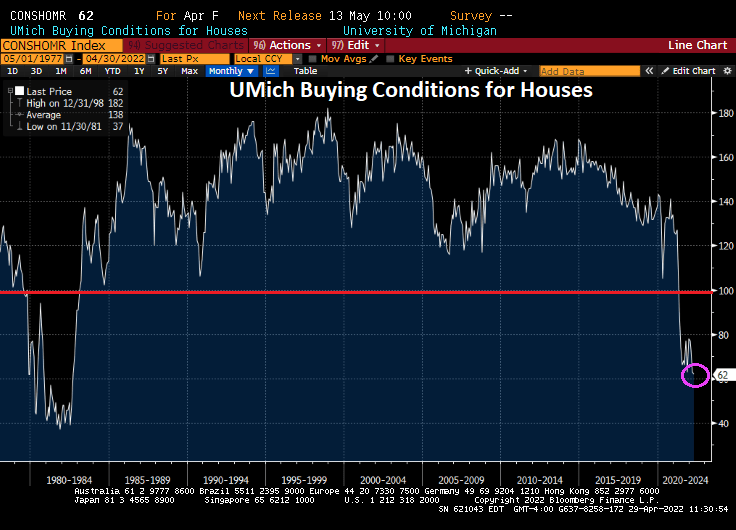
Rising home prices and The Fed signaling an end to the perpetual punch bowl have resulted in the University of Michigan buying conditions for houses to hit the lowest level since 1982.
While bearish sentiment in markets highest since 2009 in the stock market.
I don’t get why Biden created a “Disinformation Control Board” led by Nina Jankowicz – a disinformation spewer. We already have disinformation media outlets like CNN, MSNBC, ABC, CBS, NBC, New York Times, Washington Post, etc., so why create a Federal control board? All in time for the midyear elections!!
If this move by Biden doesn’t terrify you, then you didn’t study history.
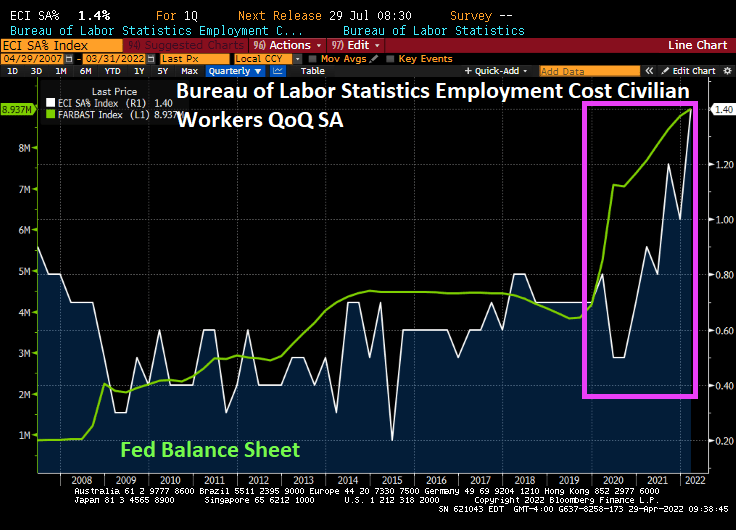
Not only has The Federal Reserve driven M2 Money Velocity to near historic lows, but now we find out that the Employment Cost Index just rose to a historic high.
Of course, a variety of minimum wage laws have helped drive up employments costs. Don’t tell lawmakers that minimum wage laws lead to higher inflation since they typically deny responsibility for anything. But I can almost picture the 4 Horsemen of the Inflation Apocalypse (Powell, Biden, Pelosi, Schumer) sitting around asking “What we can do to make inflation worse?”
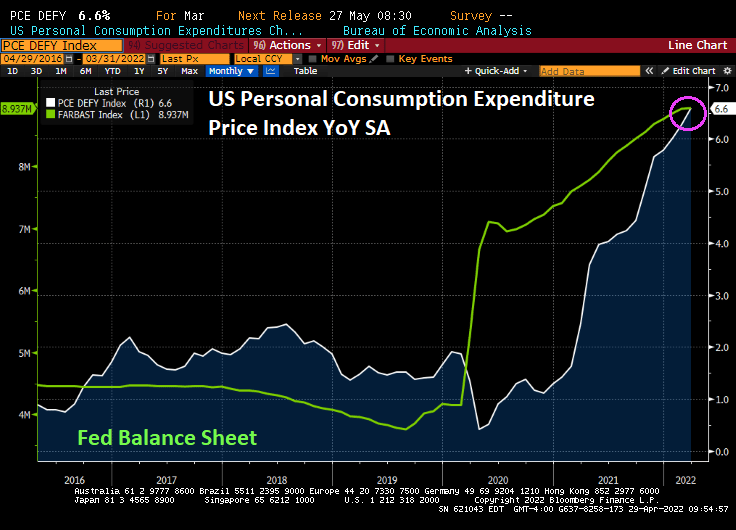
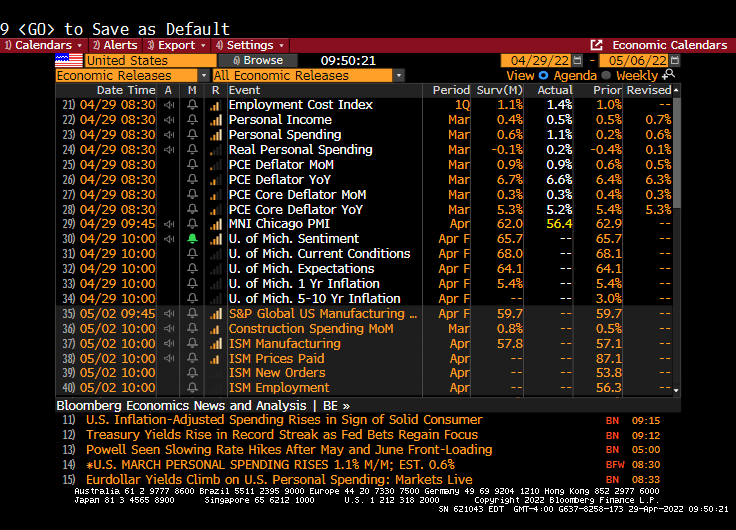
We did see the PCE Deflator YoY rise to 6.6%, the highest since 1982, the highest in 40 years.
Personal spending increased to 1.1% in March, probably panicking buying over further inflation.
A PCE Deflator of 6.60% leads to a Taylor Rule estimate of 9.05% for The Fed Funds Target Rate.
M2 Money Velocity (GDP/M2 Money) peaked in Q3 1997, but after several bouts of Fed money printing, M2 Money Velocity is near the all-time low at 1.1216 In Q1 2022. And M2 Money stock is still growing at a torrid pace of 9.9% YoY. But the massive overreaction of The Federal Reserve in response to the Covid outbreak has led to near zero money velocity.
Now with The Federal Reserve considering removing the monetary stimulus, what will happen to US GDP left to survive on its own?
An example of how The Fed’s expected tightening of monetary policy can be seen in the meteoric rise in mortgage rates.
So, the US has hit terminal money velocity. I wish The Fed lots of luck going forward.
Is Charlie Sheen the Chairman of The Federal Reserve Board of Governors?? That must be Lael Brainard falling out of the sky with Charlie Sheen (aka, Jerome Powell).


You must be logged in to post a comment.