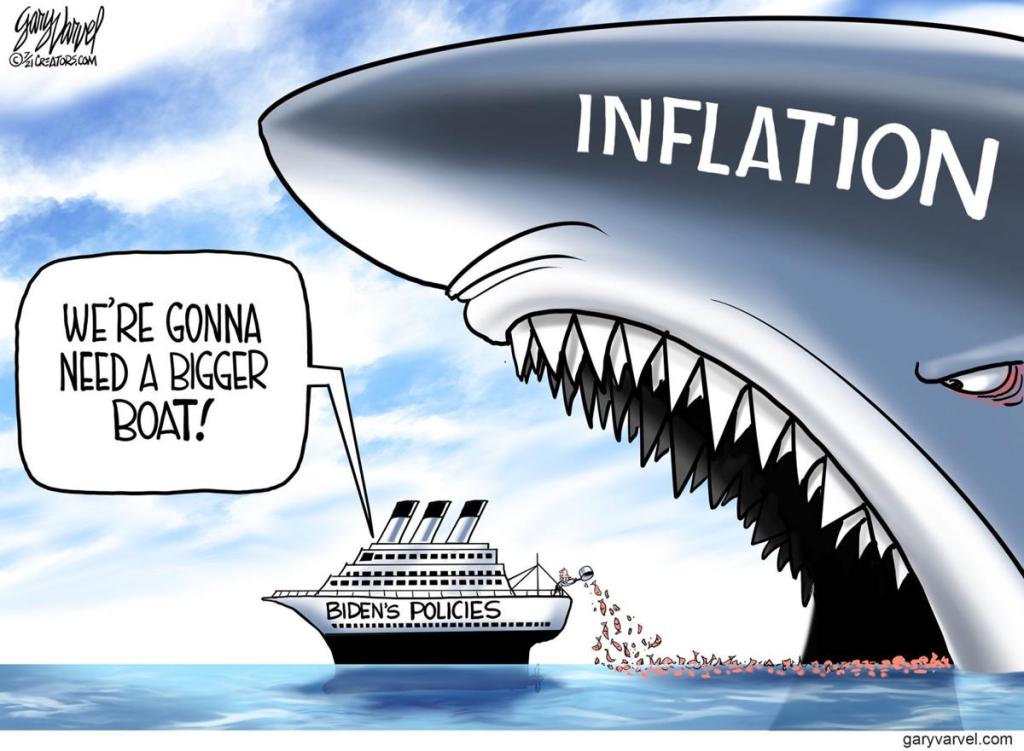
The U.S. is poised to enter Year Three of the pandemic with both a booming economy and a still-mutating virus. But for Washington and Wall Street, one Covid aftershock is starting to eclipse almost everything else.
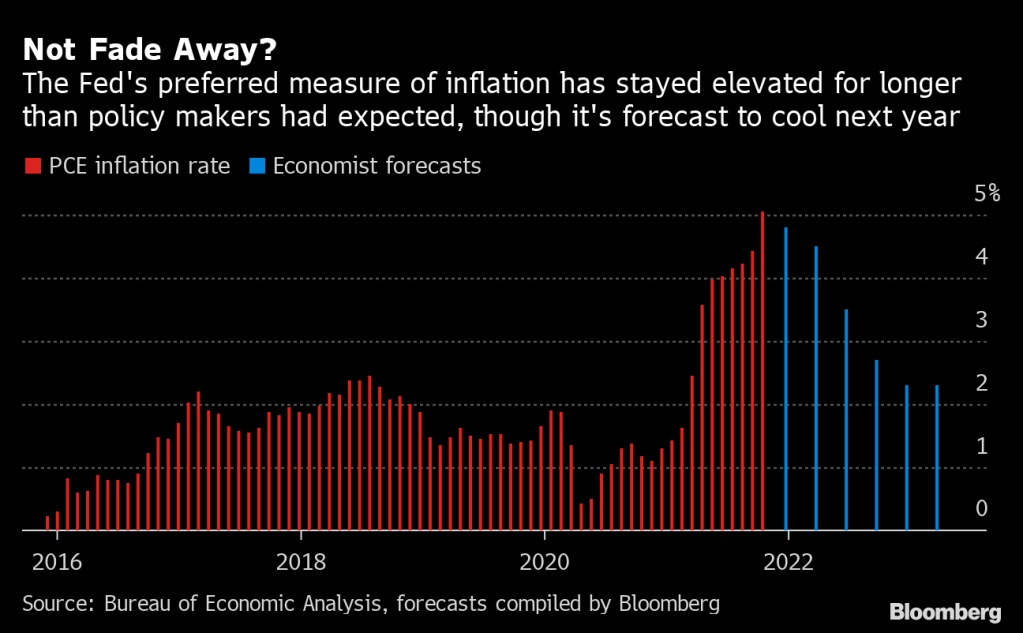
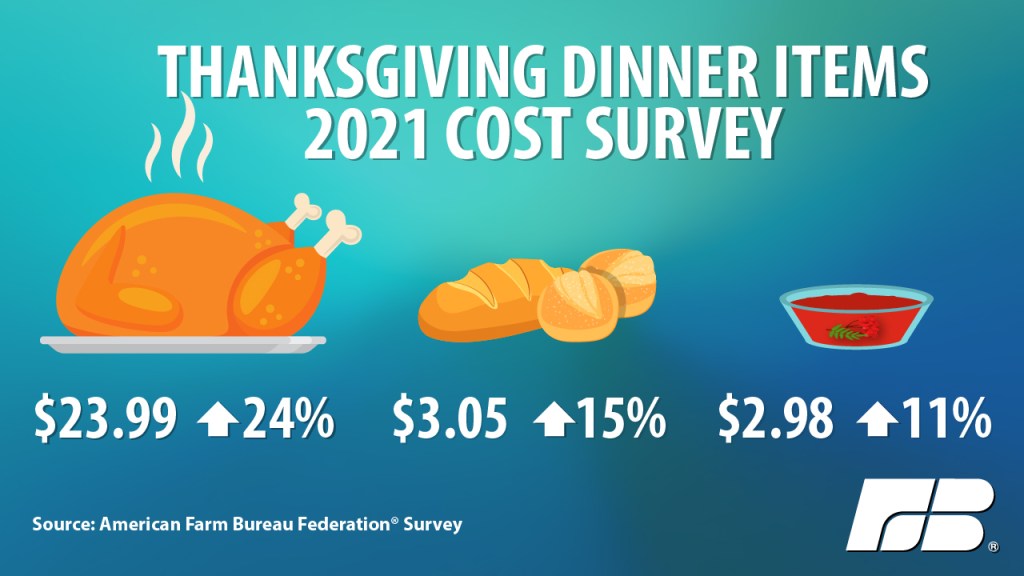
Already-hot inflation is forecast to climb even further when November data comes out on Friday, to 6.8%. That would be the highest rate since Jimmy Carter was president in the early 1980s — and in the lifetimes of most Americans.
And the CPI change since last year, according to the Federal Reserve of St Louis FRED is a staggering 16.262%.
And with U.S. Jobless Claims plunge to 52-year low, its about time that The Fed begins removing the humongous monetary stimulus.
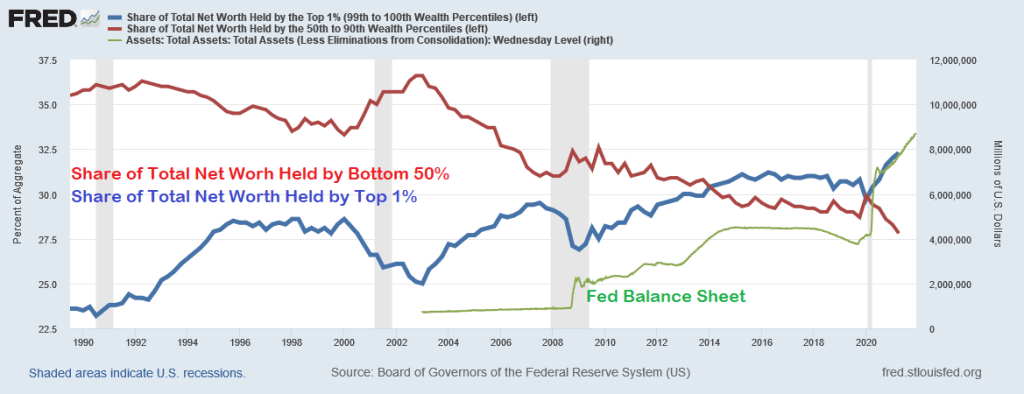
After all, largely thanks to Federal Reserve policies, we have seen the greatest wealth redistribution in US history … to the top 1%.
China cut the amount of cash most banks must hold in reserve, acting to counter the economic slowdown in a move that puts the central bank on a different policy path than many of its peers.
The People’s Bank of China will reduce the reserve requirement ratio by 0.5 percentage point for most banks on Dec. 15, releasing 1.2 trillion yuan (US$188 billion) of liquidity, according to a statement published Monday.
The reduction was signaled by Premier Li Keqiang last week when he said that authorities would cut the RRR at an appropriate time to help smaller companies, and is the second reduction this year.
The decision comes after recent data showed the economy and industry stabilizing, although Beijing’s tightening curbs on the property market have led to a slump in construction and worsened a liquidity crisis at developer China Evergrande Group and other real estate firms.
Evergrande’s ADR is collapsing (now 5.975) along with Evergrande debt falling to 23.12 (versus 100 par).
China’s credit impulse has nosedived (see pink box) as the PBOC drops bank reserve ratios to lowest level since 2007 in an effort to float the boat. Will the PBOC drop in reserve ratios stem the tide? Or is it peasant magic?
Treasury Secretary Janet Yellen said yesterday that “It’s Fed’s Job to Avoid Any Wage-Price Spiral.” Well, The Fed is helping to avoid a wage increase in real terms, since the November jobs report revealed that REAL US Average Hourly Earnings growth YoY fell to -1.378%. In other words, inflation is greater than hourly earnings.
And in other jobs related news, nonfarm payrolls rose by only 210k versus expectations of 550k jobs to be added. Even NOMINAL hourly earnings growth (4.8% YoY) was less than expected (5.0%).
Labor force participation rose a bit to 61.8%, still well below the pre-COVID levels of 63.4% in January 2020.
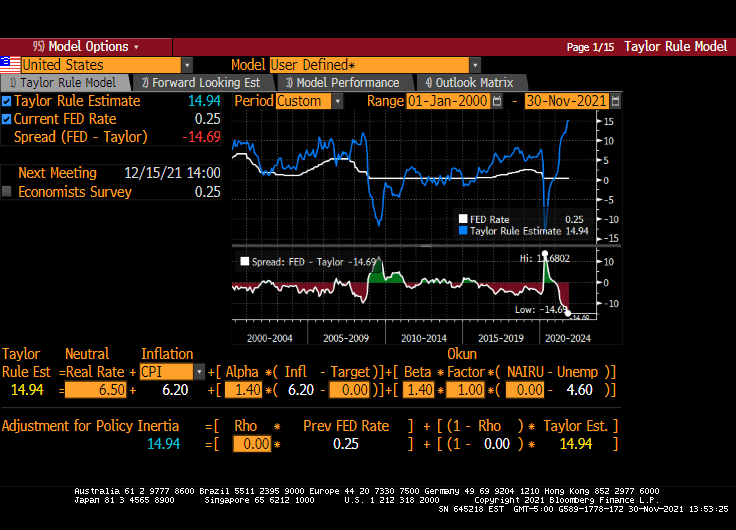
The U-3 unemployment fell to 7.8%. Still higher than the pre-COVID rate of 7.0% in February 2020, but getting close! As for what this means for The Fed, the new target rate implied by the Taylor Rule is 15.50%.
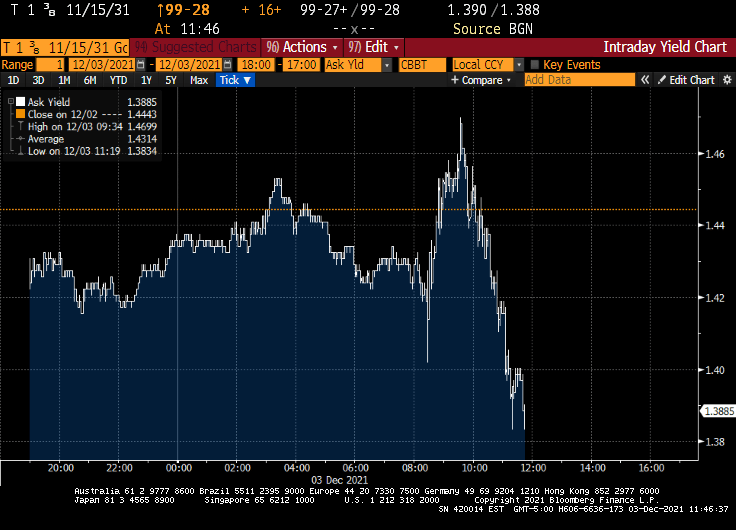
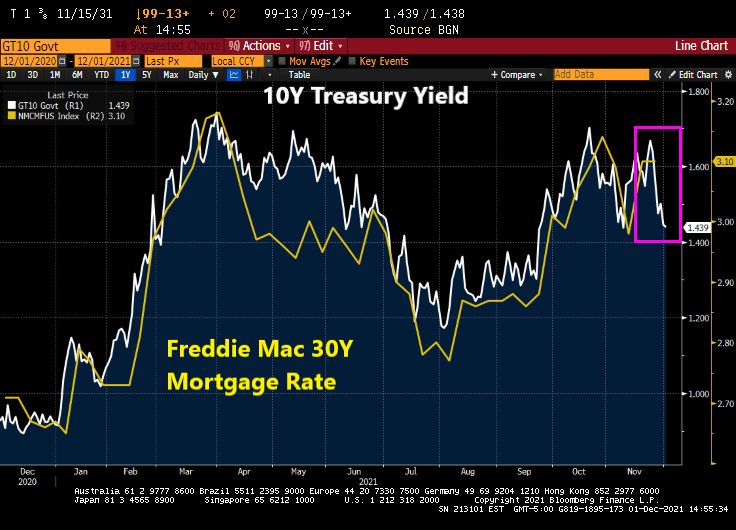
After this lousy jobs report, 10-year Treasury yields dropped … like Biden’s approval ratings.
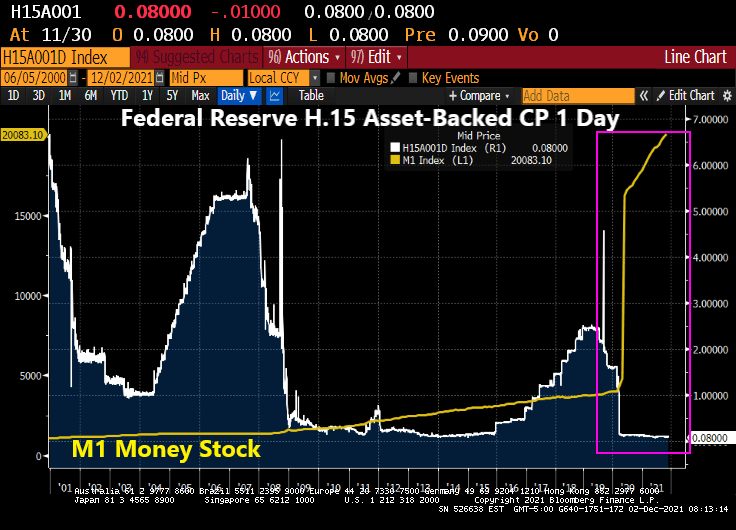
The Dream Team (Fed Chair Jay Powell and Treasury Secretary Janet Yellen) just can’t believe that inflation struck even after M1 Money Stock increased by 369% from March 2020 to today while interest rates remained near zero.
From The Hill: Federal Reserve Chairman Jerome Powell and Treasury Secretary Janet Yellen on Wednesday said they underestimated how quickly the U.S. economy would rebound from the COVID-19 recession and strain supply chains.
During a Wednesday hearing before the House Financial Services Committee, the top two U.S. economic policymakers acknowledged that high inflation has risen higher and lingered much longer than they expected.
“We understood demand would be strong,” Powell said. “We didn’t understand [the] significant problems of the supply side.”
Both Yellen and Powell said substantial fiscal and monetary stimulus played a role in stoking the higher demand that fueled inflation, but they called it a challenging side-effect of an otherwise fast recovery.
Seriously? The Fed and the Federal government dumped trillions of dollars into an economic system and didn’t think there would be negative consequences??
Look at the surge in M1 Money Stock at the same time asset-backed commercial paper rates are 0.08%. That is, about 1/3rd The Fed Funds Target rate (upper bound). None of this concerned The Dream Team?
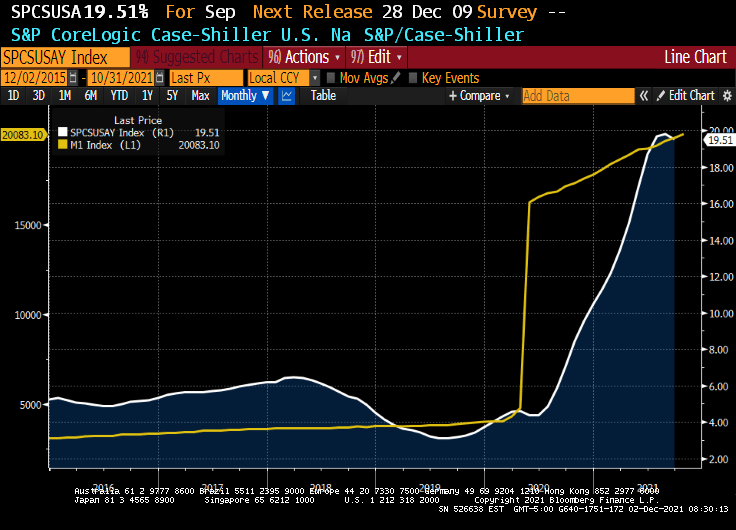
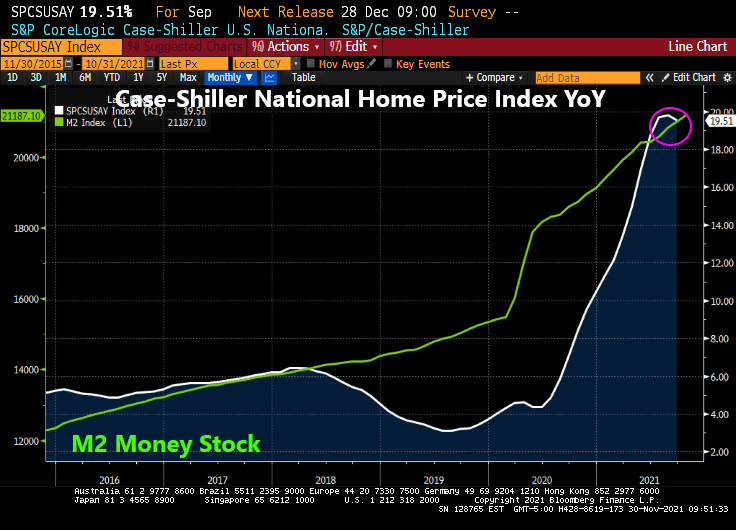
An example of what The Dream Team didn’t see happening was the explosion of home prices. Home price growth was about 4% YoY prior to COVID, and is now 19.51% YoY.
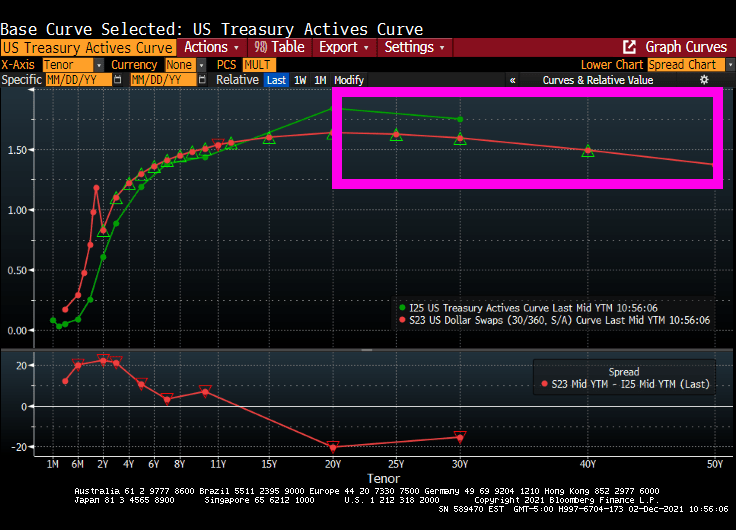
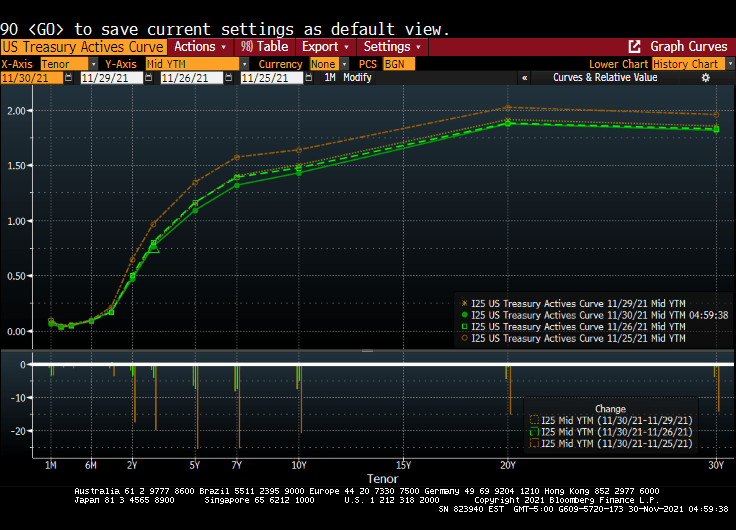
Now we have the US Treasury Actives curve inverting like the US Dollar Swaps curve after 20 years.
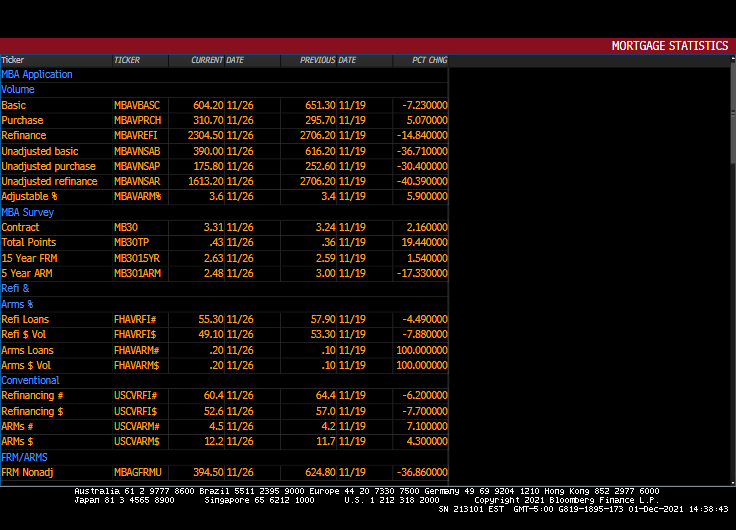
Its that time of year for mortgage purchases applications! Purchase applications usually decline during December and start to rise after the beginning of the year.
Mortgage purchase applications (white line) dropped -30.4% from the previous week, not usual for December. But what is surprising is the drop in REFINANCING applications: down -40.3% from the previous week.
30-year mortgage rates rose 2.16% from the previous week.
But between Omicron (or as the French say, “Oh! Macron!”) and The Federal Reserve, there is a good chance that mortgage rates will fall this week putting a quick end to refi application plunge.
Purchase applications? Nope, it is that time of the season when purchase applications drop like a rock.
Calamity Jay Powell is no longer mentioning “transitory” when it comes to inflation, but does Powell and the FOMC have the moxie to ACTUALLY raise rates more than a smidge??
(Bloomberg) — Team Transitory is throwing in the towel.
In a clear sign that the Federal Reserve is shifting to tighter monetary policy, Jerome Powell — who’s spent months arguing that the pandemic surge in inflation was largely due to transitory forces — told Congress on Tuesday that it’s “probably a good time to retire that word.”
The Fed chair, tapped last week for another four-year term, still thinks inflation will ebb next year.
But in testimony before the Senate Banking Committee, he acknowledged that it’s proving more powerful and persistent than expected, and said the Fed will consider ending its asset purchases earlier than planned.
A number of economists are forecasting cooling inflation next year, which gives Powell an excuse to NOT raise rates, other than just a bit.
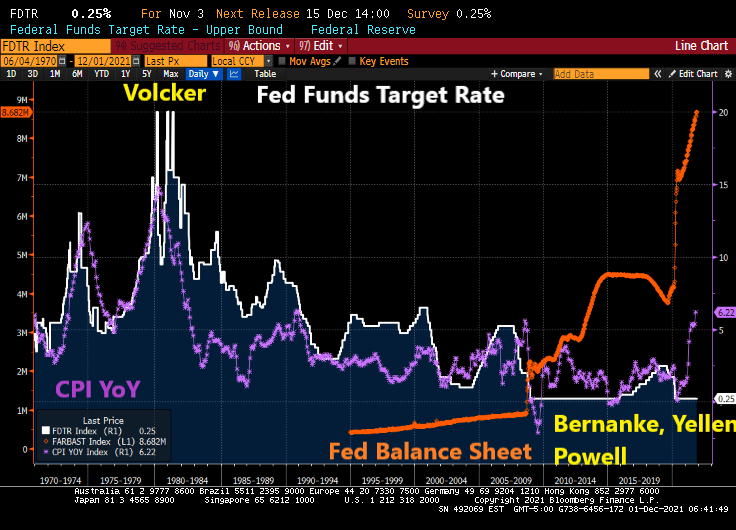
For a little history, inflation was rampant in the 1970s and early 1980s. Fed Chair Paul Volcker, all 6’7 of him, raised the Fed Funds target rate (white line) to 20% on several occasions. The result? Inflation cooled from over 14% in 1980 to 2.46% by 1983. But since 2008, Fed Chairs Bernanke, Yellen and Powell have been the ANTI-Volckers … keeping the Fed Funds Target rate near zero for the the most part and adopted their gut-wrenching quantitative easing programs that are still here today.
Of course, Powell could do what Volcker did (and the Taylor Rule suggests) and raise their target rate to 15% to cool inflation.
But does Powell and the other FOMC members have the moxie to really cool inflation? Frankly, no. Powell until yesterday played the TRANSITORY card and still believes that inflation will cool by 2022.
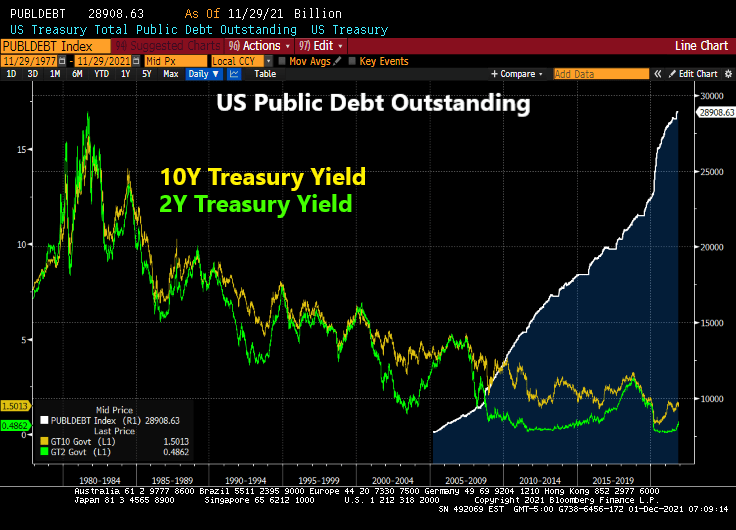
True, the Federal government has binged on borrowing (up 172% since January 2009). And with Biden and Congress trying to spend trillions more (much of which will be added to the public debt rolls, so increasing interest rates ala Volcker is very problematic.
And then there is always the good ‘ole excuse not to raise rates if needed. Other than admitting that The Fed is monetizing Federal government spending to which there is no end in sight.
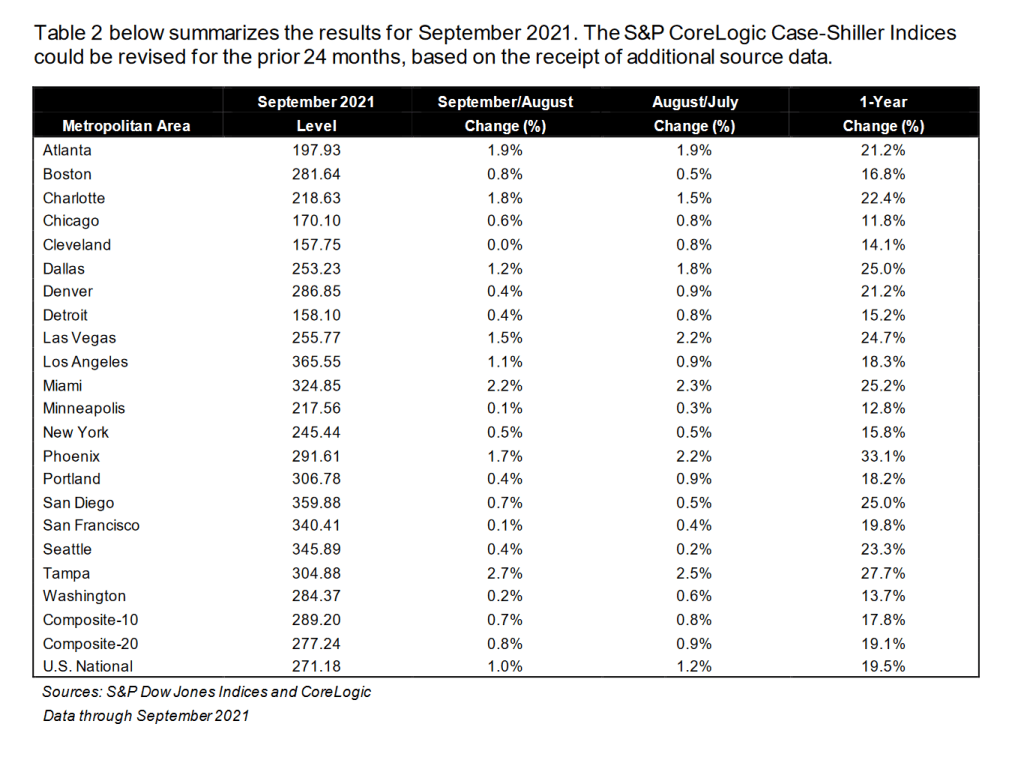
Once again, low available inventory of houses for sale coupled with outlandish Fed stimulus has resulted in a housing crisis where home price growth (+19.51%) exceeds hourly wage growth (+5.76%) by almost 4x.
Where are all the home prices above 10% YoY? Every one of the 20 metro areas covered by Case-Shiller. Phoenix AZ leads at +33.1%. Chicago IL is the “slowest” at 11.8%.
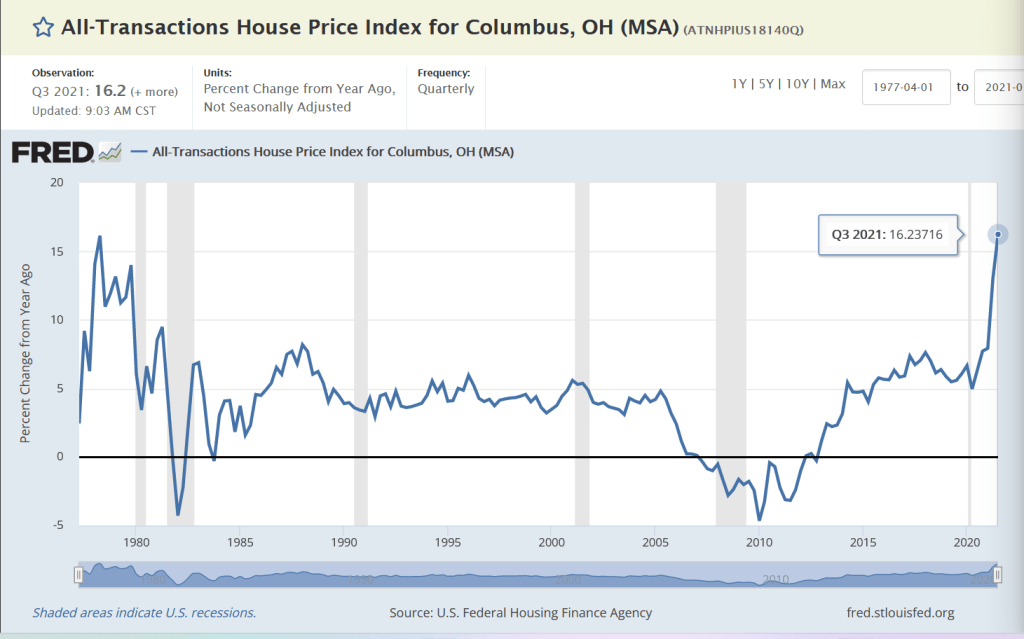
Although Columbus OH is the growth hub of the state, Case-Shiller only reports Cleveland. So here is Columbus’s all-transactions home price growth for Q3: +16.2% YoY placing Columbus at the top of the midwest metro areas of Detroit, Chicago, Minneapolis and Cleveland.
With the latest Omicron Variation (sounds like a Star Trek TV show episode), I will bet that The Fed will stay a little longer and keep rates low, leading to home price growth (with limited available inventory) to continue to grow at double digit speeds.
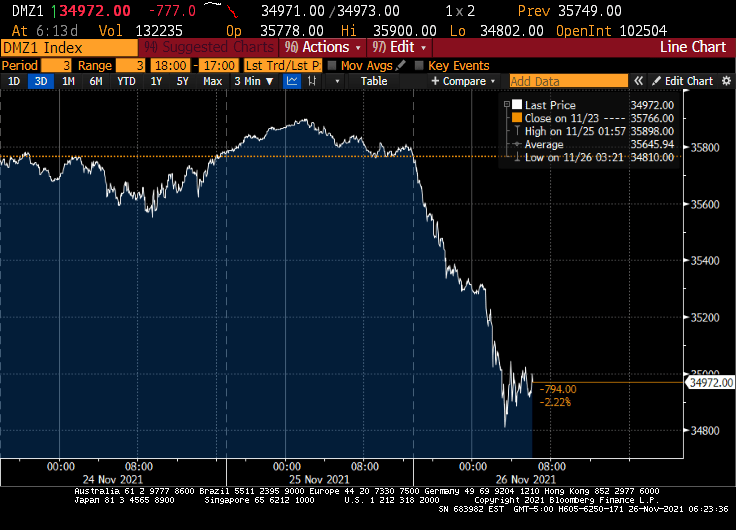
The latest scare hitting financial markets is the Omicron Variant (or Oh! Macron! Variant in France). While it caused an initial decline in global equity markets {Dow fell 900 points on early reports on Omicron), the Treasury market has been relatively unscathed.
For example, the US Treasury Actives curve dropped last Friday (the orange line represents the Wednesday before Thanksgiving), while the remaining three lines represent last Friday, Monday and Tuesdays (today). In other words, the US Treasury Actives curve has been quiet so far this week after Friday’s flattening.
The US Dollar Swaps curve shows the same dynamics. The dark blue line is last Wednesday, while the remaining lines are last Friday, this Monday and today. Not a lot happening after the initial Omicron fear factor was priced in.
Federal Reserve Chairman Jerome Powell believes that the omicron variant of Covid-19 and a recent uptick in coronavirus cases pose a threat to the U.S. economy and muddle an already-uncertain inflation outlook.
“The recent rise in COVID-19 cases and the emergence of the Omicron variant pose downside risks to employment and economic activity and increased uncertainty for inflation,” Powell said in remarks he plans to deliver to Senate lawmakers on Tuesday. “Greater concerns about the virus could reduce people’s willingness to work in person, which would slow progress in the labor market and intensify supply-chain disruptions.”
Do I detect FEAR in Powell’s voice? The odds of rate increases for next year just fell to one rate increase at the September 2022 meeting.
On the equity side, it seems to be all about whether The Fed will withdraw its support. Back in early 2018, then Fed Chair Janet Yellen and the FOMC started to shrink the Fed balance sheet (green line). This resulted in the “Smart Money Index” declining. The S&P 500 index received a jolt with the Fed stimulus around the COVID outbreak and have taken off like a jackrabbit. Despite the Smart Money Flow index being lower than in 2017.
So, is Omicron the “planet killer” or just another mild flu-like outbreak? The data is pointing towards the latter, but FEAR may cause it to be a bigger deal than is warranted.
I have written numerous times about nothing has been the same since the housing bubble burst and ensuing financial crisis of 2008. The crisis led to bank bailouts (TARP) and banking legislation (Dodd-Frank) giving The Federal Reserve even more power. And then the COVID lockdowns led to even MORE power for The Fed. And a horrid decline in money velocity (the ability of printing money to increase economic growth … or GDP).
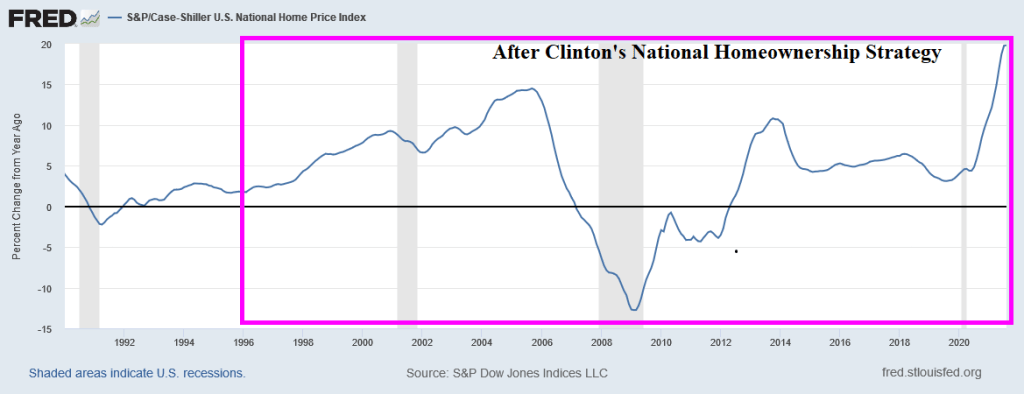
But let’s take one step backwards. One the causes of the housing bubble that burst was President Clinton’s infamous National Homeownership Strategy that encouraged “partners” with the Federal government to soften underwriting standards for mortgage lending, particularly for minority households. The intent was to increase the homeownership rate in the US and it worked! Too well. Along with increasing the homeownership rate came rising home prices, culminating with home price growth reaching 14.5% YoY in September 2005. Only to start slowing to a crash.
Of course, the housing bubble was associated with no/low documentation and subprime mortgage lending. But the relaxing of underwriting standards by the National Homeownership Strategy helped fuel the no/low doc and subprime lending crisis. But weakening underwriting standards to increase homeownership rates is a dangerous strategy.
Note the surge in M1 Money Velocity (GDP/M1) starting in 1994. M1 Velocity grew until Q4 2007, then crashed along with home prices. The second and more sudden crash in M1 Velocity occurred with the COVID outbreak in March 2020 and the ensuing economic lockdowns and the intervention of The Federal Reserve in terms of money printing. M1 Money surged 173% from October 2008 to February 2020 and then another 369% from March 2020 to today. THAT is a Fed Storm Surge!!
M2, the broader definition of money, has not grown as rapidly as M1, but it still grew at an alarming rate. Atlanta Fed President Raphael Bostic blamed inflation on COVID but not The Fed’s insane money printing or government lockdowns. C’mon man!
Finally, the banking crisis (and TARP bailouts) along with COVID have made consumer purchasing power of King Dollar even worse.
Be careful of government strategies to make housing more “affordable” because they seem to make housing more expensive and can help crash the financial system.
Gut-wrenching inflation is already priced in, but yet another COVID outbreak (and the possibility of more economic shutdowns, more vax mandates and more stern lectures from Anthony Fauci) are spooking markets.
Down Futures are down 777 as I write this note.
The 10-year Treasury yield is down 11.2 basis points.
And West Texas Intermediate crude prices are down 6.62%.


You must be logged in to post a comment.