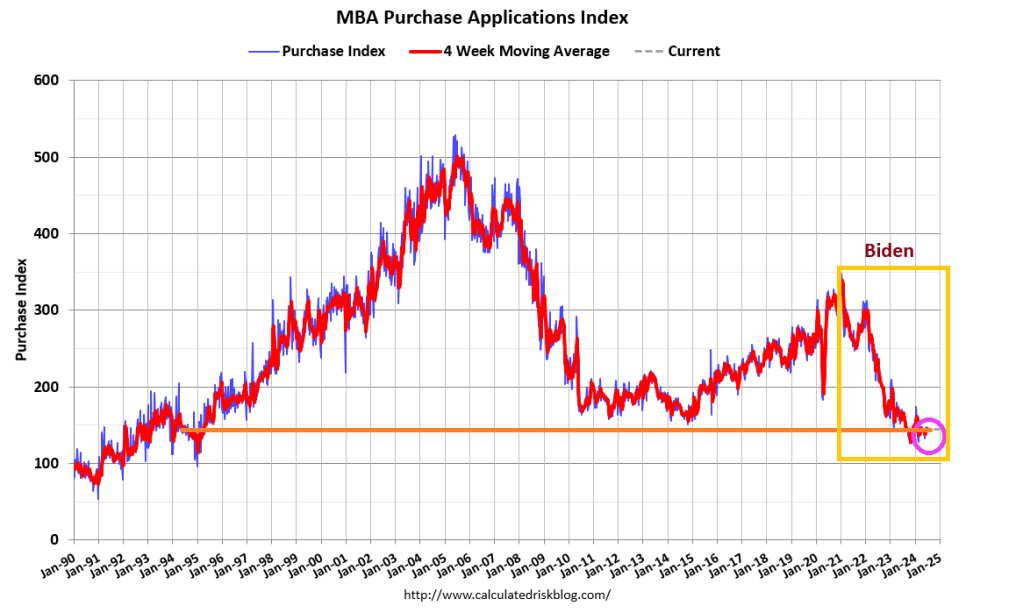
Mortgage applications decreased 0.2 percent from one week earlier, according to data from the Mortgage Bankers Association’s (MBA) Weekly Applications Survey for the week ending July 5, 2024. Last week’s results included an adjustment for the July 4th holiday.
The Market Composite Index, a measure of mortgage loan application volume, decreased 0.2 percent on a seasonally adjusted basis from one week earlier. On an unadjusted basis, the Index decreased 20 percent compared with the previous week. The seasonally adjusted Purchase Index increased 1 percent from one week earlier. The unadjusted Purchase Index decreased 19 percent compared with the previous week and was 13 percent lower than the same week one year ago.
The Refinance Index decreased 2 percent from the previous week and was 28 percent higher than the same week one year ago.
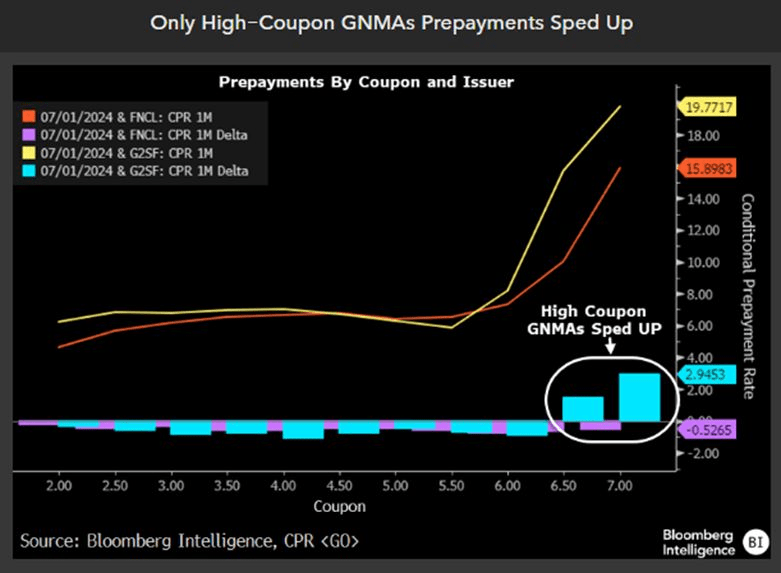
Mprtgage prepays fell less than daycoiunt.
But on;y high-coupn GNMAs prepayments sped up.
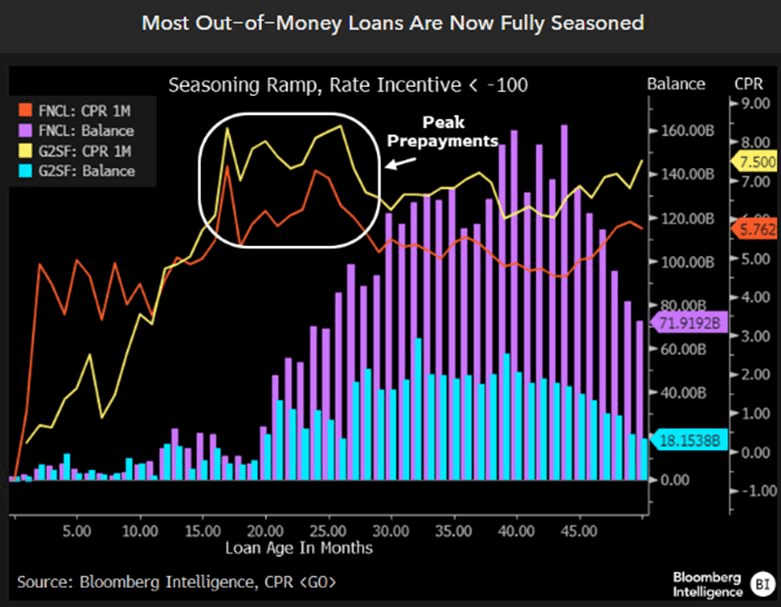
Finally, most out-of-the-money loans are now fully seasoned.
Yes. everyone can see the mental decline in President Biden and he should be in a nursing home. While he vows to run for President against Donald Trump, can you imagine what he will be like in 2 years? Let alone another 4 years??
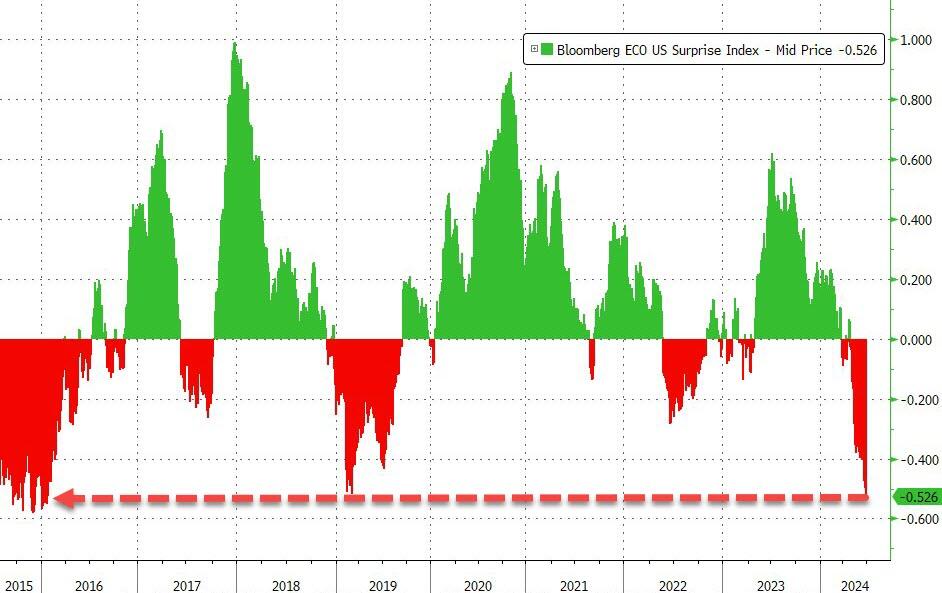
This estimate is down from 4.2% seen in mid-May and from 2.2% seen on June 28th. If this estimate turns out to be correct it will be the 2nd consecutive quarter of GDP growth below 2.0% after Q1 2024 GDP of 1.4%.
Housing hasn’t slowed across the board … yet. But with mortgage payments as % of income near the highest since the early 1980’s, it will eventually slow down.
There is only one way out. CEASE Bidenomics and the crazy spending and debt and deficits!
Stated differently, virtually everything the Fed does for the alleged benefit of the American economy is both unnecessary and a ruse. The Fed has actually become a captive of the Wall Street traders, gamblers and high rollers, and functions mainly at their behest.
The proof of this proposition starts with the startling historical fact that the post-war US economy did just fine without any interest rate targeting, heavy-duty bond-buying or general macroeconomic management help from the Fed at all. For all practical purposes today’s omnipresent Fed domination of the financial and economic system was non-existent at that point in time.
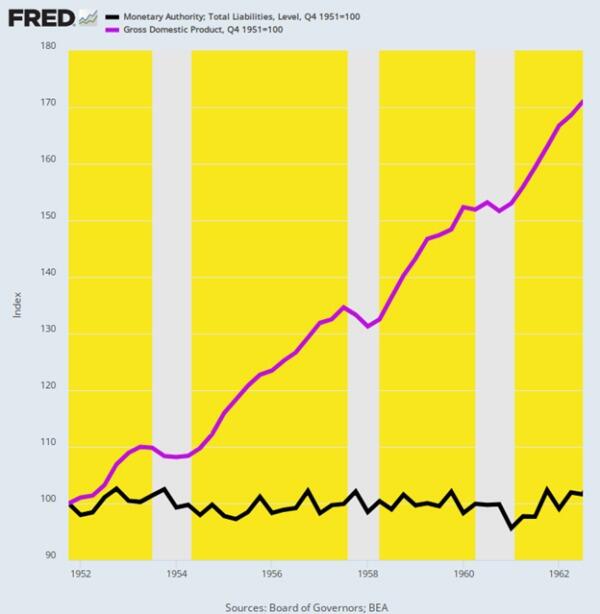
We are referring to the full decade between Q4 1951 and Q3 1962 when the balance sheet of the Fed remained flat as a board at just $51 billion (black line). Yet the US economy did not gasp for lack of monetary oxygen. GDP grew from $356 billion to $609 billion or by 71% (purple line) during the period. That’s nominal growth of 5.1% per annum, and the majority of it represented real output gains, not inflation.
Change in Federal Reserve Balance Sheet Versus GDP, Q4 1951 to Q3 1962.
As it happened, this halcyon span encompassed the immediate period after the so-called Treasury-Fed Accord of March 1951, which finally ended the WWII expedient that had pegged Treasury bills at 0.375% and the long-bond at 2.5o% in order to finance the massive flow of war debt.
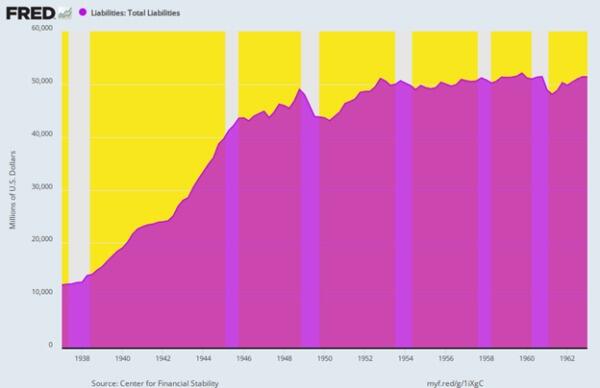
The effect of the WWII pegs, of course, was that the Fed had been obliged to absorb any and all US Treasury supply that did not clear the market at the target yields. Not surprisingly, the Fed’s 1937 balance sheet of $12 billion had risen by 4.3X to $51 billion by the time of the Accord, thereby reflecting what amounted to the original version of backdoor monetization of the public debt, which was justified at the time by the exigencies of war.
By contrast, in the post-peg period shown below interest rates were allowed by a newly liberated Fed to find their own market clearing levels. So there was no continuous guessing game on Wall Street about where the next monthly Fed meeting would peg short-term interest rates. Back then, it was understood that the forces of supply and demand down in the bond pits of Wall Street were fully capable of discovering the right interest rates, given the financial and economic facts then extant.
The combination of high growth, robust investment, strong wages and smartly rising real family income, on the one hand, and rock-bottom inflation on the other, surely constitutes the gold standard of performance for a modern capitalist economy.
And yet, and yet. It was all accomplished under a regime of persistent “light touch” central banking that assumed free market capitalism would find its own way to optimum economic growth, employment, housing, investment and main street prosperity. No monetary Sherpa at the Eccles Building was necessary.
Even more crucially, no money printing was necessary, either. The sterling economic results depicted below happened during a 11-year period when the Fed did not purchase one net dime of U.S. Treasury debt!
Per Annum Change, Q4 1951 to Q3 1962
Real Final Sales: +3.8%.
Real Domestic Investment: +4.1%.
Nonfarm productivity growth: +2.5%.
Real hourly wages: +3%.
Real Median Family Income: +2.3%.
CPI Increase: +1.3%
Federal Reserve Liabilities, 1937 to 1962
There is absolutely nothing about this period that makes the superior macroeconomic performance summarized above aberrational, flukish or unreplicable. In fact, President Eisenhower cut defense spending sharply and eliminated the fiscal deficit entirely during his second term. So, the cumulative increase in the public debt during this 11-year period was just $30 billion or a tiny 0.6% of GDP owing to Korean War borrowing early in the period.
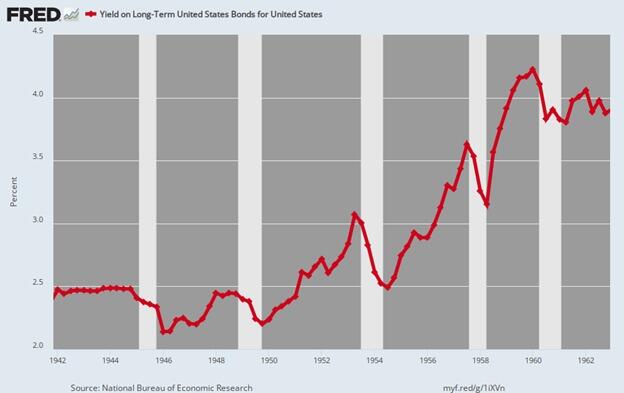
But even this modest debt increase wasn’t monetized by Fed bond-buying. Instead, it was effectively financed out of private savings in the bond pits. Long-term bond yields, therefore, actually rose from the 2.5% pegged level shown below for 1942 to 1951 to upwards of 4% by the end of the period, as dictated by supply and demand. Still, the CPI averaged just 1.2% during 1959-1962, meaning that real yields bordered on +3.o% during the early 1960s.
That is to say, at the time, the Fed had seen no need to push real rates to zero and even into negative territory as has been the case for much of the last two decades. The fact is, the main street economy prospered mightily even when inflation-adjusted rates were providing a solid return to savers and investors.
Long-Term US Treasury Bond Yield, 1942 to 1962
What ended the benign economics of 1951 to 1962, of course, was the scourge of War Finance. LBJ (Lyndon B. Johnson) escalated the Vietnam War dramatically after 1963, causing the debt to soar and the 10-year UST to climb to nearly 6% by early 1968. But Johnson was not about to allow market clearing interest rates to fund his misbegotten venture in bringing the blessings of the Great Society to southeast Asia.
So he gave “the treatment” to the Fed Chairman at his Texas ranch and ordered to cut the Federal funds rate to accommodate LBJ’s surging Federal deficit. The latter had grown from $4.8 billion and -0.8% of GDP in 1963 to $25.2 billion and -2.8% of GDP by 1968.
Unfortunately, after steadily and appropriately raising the Fed funds rate from 2.9% in December 1962 to 5.75% by November 1966 as Johnson’s inflationary deficits grew, the funds rate was brought down rapidly to 3.8% by July 1967. In turn, that unleashed a red-hot wave of speculation and inflation, with the CPI rising from a 1% Y/Y (year-on-year) gain in August 1964 to a +6.4% peak in February 1970.
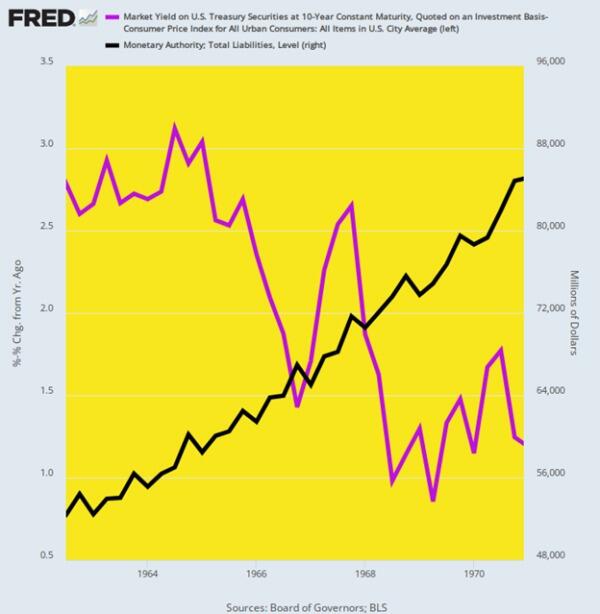
There is no mystery as to why the inflationary genie was now out of the bottle. Between Q3 1962 and Q4 1970, the Fed’s heretofore flat balance sheet (black line) soared skyward, rising from $52 billion to $85 billion over the eight-year period. That amounted to a 6% per year gain, meaning that the precedent for aggressive balance sheet expansion had now been firmly established.
Inflation-Adjusted Yield on 10-Year UST Versus Fed Balance Sheet Growth, 1962 to 1970
The first victim, of course, was inflation-adjusted bond yields (purple line above). As shown above, the healthy +3% real yield of 1962 fell to barely +1% by the end of 1970.
Yet the crucial essence of this “guns and butter” breakdown cannot be gainsaid. To wit, the Fed was not driven to this first round of post-war money-printing and debt monetization because the private economy had gone into a mysterious swoon or failure mode and therefore needed a helping hand from the nation’s central bank.
To the contrary, this was a Washington driven departure from sound central banking pure and simple. And as we will amplify below, it was off to the races of Rogue Central Banking from there.
Once the inflation genie was out of the bottle with the CPI clocking in at 6% by the fall of 1970, the Fed struggled for more than a decade to put it back. Consequently, any focus on stimulating growth, jobs, housing and investment was infrequent and definitely secondary to inflation-fighting.
We amplify the 1970s flood of central bank money and the resulting inflationary mess below, but it is important to note at the onset that despite four recessions (1970, 1975, 1980 and 1981) and very little pro-growth help from what was now an inflation-preoccupied Fed, the US economy did expand at a decent clip during the interval between Q4 1969 and Q2 1987.
The economic growth rate (real final sales basis) averaged a solid +3.1% per annum, but that occurred due to the inherent growth propensities of private capitalism and despite the roadblocks thrown up by periodic bouts of monetary stringency. In fact, three Fed chairman served during that 17.5-year interval—Burns, Miller and Volcker—and with varying degrees of success their focus was overwhelmingly on suppressing inflation, not goosing growth.
As it happened, the growth rates of jobs, productivity and real median family income during this period were not especially outstanding, but these metrics didn’t plunge into an economic black hole, either.
Self-evidently, these outcomes on main street were the work of market capitalism, not the central bank. The latter was leaning hard against inflation during most of the period—so this absence of central bank “help” is just further proof that easy money stimulus is not necessary for solid growth and main street prosperity.
Per Annum Change, Q4 1969 to Q2 1987
Real Final Sales of Domestic Product: +3.1%.
Labor hours employed: +1.5%.
Nonfarm productivity: +1.8%.
Real Median Family Income: +1.2%.
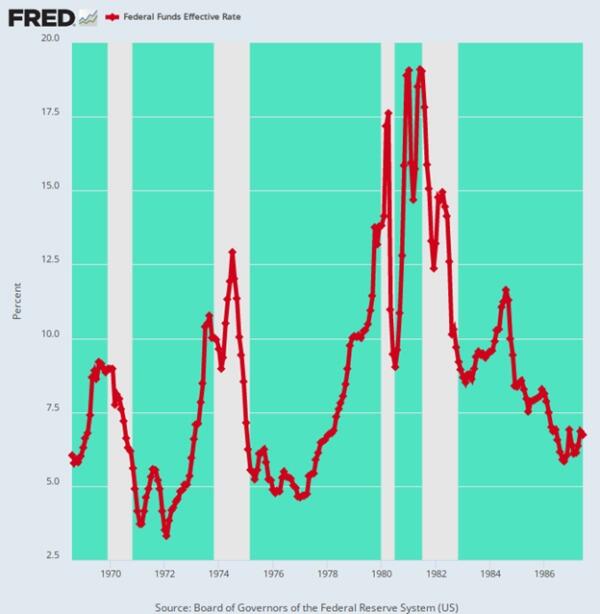
For avoidance of doubt, here is the path of the Federal funds rate as the above macroeconomic performance was unfolding. To wit, the Fed’s recurrent anti-inflation initiatives caused the funds rate to gyrate wildly like some kind of monetary jumping bean. In the run-up to each of the four recessions designated by the shaded areas of the graph, the increase in the Fed funds rate was as follows:
1970: +340 basis points.
1974: +960 basis points.
1980: +1,290 basis points.
1981: +440 basis points.
Needless to say, these successive rate-raising campaigns amounted to hammer blows to the main street economy. There is no way that these violent interest rate swings and the consequent start and stop economic cycles—four recessions in only 17 years— were a tonic for growth during this era of high and volatile inflation.
In effect, the reasonably solid macroeconomic performance quantified above represents a kind of free market minimum. It reflects the relentless drive of workers, consumers, entrepreneurs, businessmen, investors, savers and speculators to better their own economic circumstances—even in the face of inflationary roadblocks and anti-inflation financial manipulation by the central bank.
Federal Funds Rate, August 1968 to June 1987
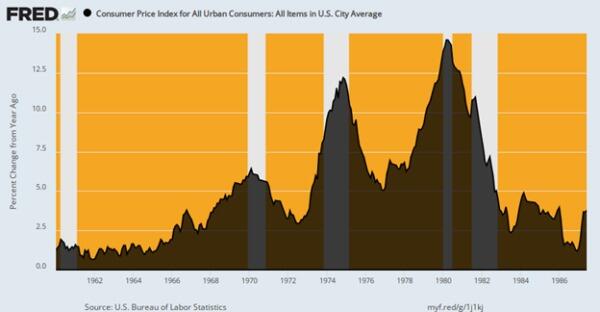
Of course, the inflationary roadblocks were enormous, and far beyond any prior peacetime experience. Compared to the 1.3% inflation average during 1951 to 1962, the CPI rose at a 5.6% rate over 1969:4 to 1987:2.
And that included the benefit of the sharp drop in inflation engineered by Paul Volcker during the final four years of the period. Thus, during the decade of the 1970s through the Y/Y inflation peak at 14.6% in April 1980, the CPI rose by an average of 7.7% per annum.
In turn, this introduced the wage-earning classes for the first time to the treadmill of robustly rising nominal wage rates, which become almost entirely consumed by sharply rising consumer prices. Thus, during the decade ending in the inflationary peak of Q2 1980, average hourly earnings in nominal terms rose by 7.6% per annum. But, alas, what stuck to the walls of workers’ bank accounts was a gain of only 1.1% per annum during the same period. All the rest was eaten up by inflation.
Y/Y Change in the CPI, 1960 to 1987
If the wage/price treadmill effect introduced after 1969 was the whole story, the impact might be considered minimally tolerable. The resilience of market capitalism was shown to be sufficiently strong so as to overcome much of the inflationary headwinds, along with the Fed’s punishing cycles of anti-inflation tightening.
Unfortunately, however, what also materialized out of the 1970s inflation era were two exceedingly harmful corollaries.
The first was the notion that the job of the central bank was to manage the rate of change in the general price level, rather than the far more modest original remit. The latter presumed the presence of noninflationary gold-backed money—so inflation-management would have been an oxymoron.Consequently, the Fed’s actual statutory mandate was simply to provide liquidity and reserves to the banking system based on market rates of interest. The Fed heads didn’t need to know from the CPI, PCE deflator or any other modern inflation measuring stick that had not yet been invented.
As it happened, however, management of the short run pace by which the general price level is rising was a fateful portal into statist central banking and the plenary management of the macro-economy in which the inflation indices are inextricably embedded. Eventually the bastard son of this strategic opening to vastly expanded state power materialized as the holy grail of 2% inflation.
Yet, here’s the thing. Until the gold-backed dollar was deep-sixed by Nixon in August 1971 and the possibility of rising, persistent and eventually double-digit peacetime inflation materialized in the 1970s, the idea of central bank management of the inflation rate didn’t even exist. That’s because peacetime price stability was the default condition of the gold standard world. Indeed, from the Napoleonic Wars forward, “inflation” and wartime were pretty much synonymous because fiat money was almost invariably a temporary wartime expedient.
The other legacy of the inflationary 1970s was the breakout of high and ever rising unit labor costs in the US economy. This unnecessary but pervasive economic deformation eventually resulted in the massive offshoring of the US industrial economy.
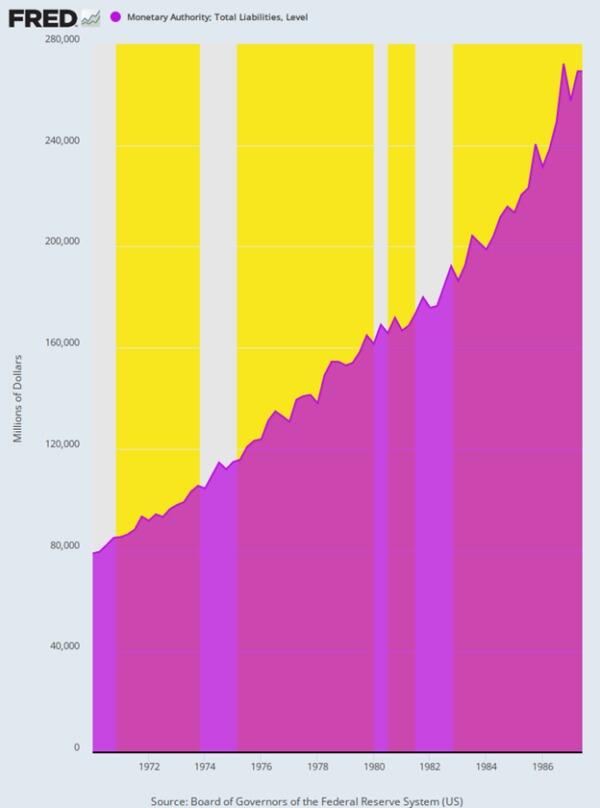
The implication, of course, is that it would have been far better to stick with William McChesney Martin’s golden era of high growth, low inflation, a flat Federal Reserve balance sheet and interest rates driven overwhelmingly by supply and demand forces in the private financial markets. But as it happened, the Fed’s balance sheet during the decade of high inflation was the very opposite of flat.
Under the three successive Chairmen, the Fed’s balance sheet grew at the following compound annual rates:
Arthur Burns (Feb. 1970 to March 1978): +6.9%.
William Miller (March 1978 to August 1979): +9.5%.
Paul Volcker (August 1979 to August 1987): +6.8%.
Growth Lift-off of Federal Reserve Balance Sheet, Q1 1970 to Q2 1987
In a word, Volcker sharply slowed the runaway growth of the Fed’s balance sheet which had occurred under the regime of William Miller – the hapless former CEO of a conglomerate which made golf carts, snowmobiles and Cessna aircraft. But when all was said and done, the Volcker Fed still pumped new money into the economy at a rate barely below that of Arthur Burns. And Burns, of course, was the villain central banker who had ignominiously succumbed to Nixon’s entreaties to “give me money, Arthur” in support of his re-election campaign in 1972.
The amount of money the US government spends on foreign aid, wars, the so-called intelligence community, and other aspects of foreign policy is enormous and ever-growing. It’s an established trend in motion that is accelerating, and now approaching a breaking point. It could cause the most significant disaster since the 1930s. Most people won’t be prepared for what’s coming. That’s precisely why bestselling author Doug Casey and his team just released an urgent video with all the details.
Lest we forget, M2 Money printing exploded with Covid and kept increasing under Biden’s Reign of (Economic) Error.
This isn’t the Sahm’s Club that is good fpr consumers. This is the club which crushes consumers. Better to be called Joe’s Club after our demented President Joe Biden.
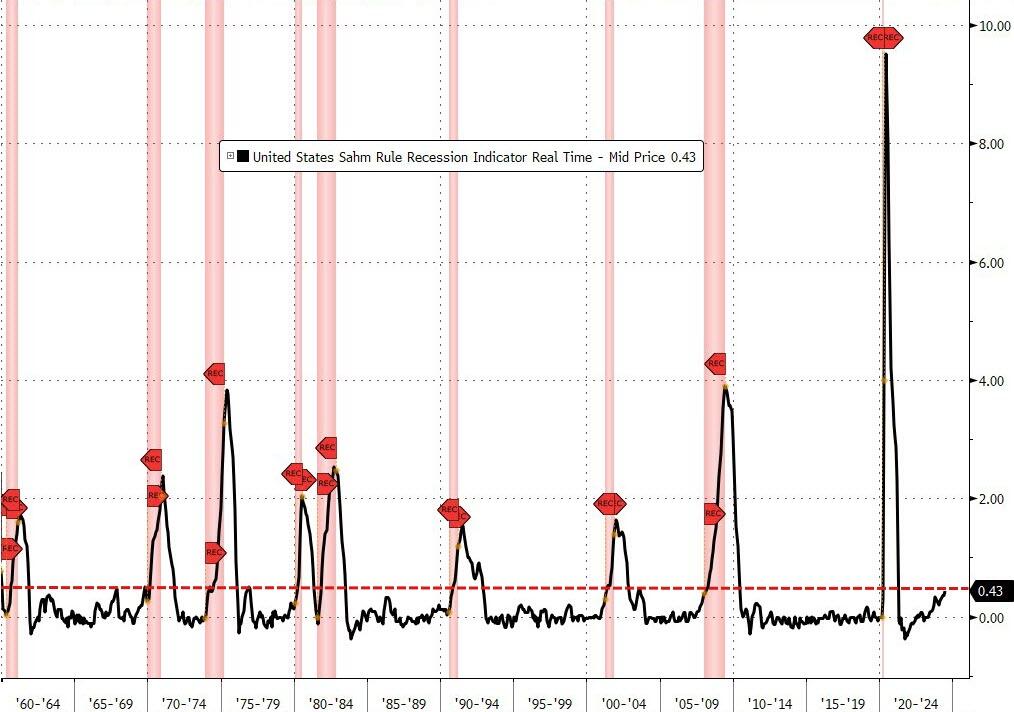
This uptick triggers the Sahm Rule, a real-time recession indicator, suggesting that the US economy is in, or is nearing, a recession. The Sahm Rule, developed by former Fed economist Claudia Sahm, is designed to identify the start of a recession using changes in the total unemployment rate.
According to the rule, a recession is underway if the three-month moving average of the national unemployment rate rises by 0.50 percentage points or more, relative to its low during the previous 12 months. With the June 2024 U-3 rate of 4.1 percent, the average of the last three months being 4.0 and the lowest 12-month rate of 3.5 percent in July 2023, this criterion has been met.
Sahm Rule indications (1960 – 2024)
Source: Bloomberg
Surveys had forecast the U-3 rate to hold steady at 4.0 percent in June, unchanged from May 2024. The seemingly small 0.1 percent uptick, however, carries substantial implications for the broader economy. One possible confounding effect of the signal is growth in the labor force: If the labor force grows rapidly and the economy does not generate enough jobs to match the increase, the unemployment rate might rise and the Sahm Rule may be triggered, even if overall employment is increasing.
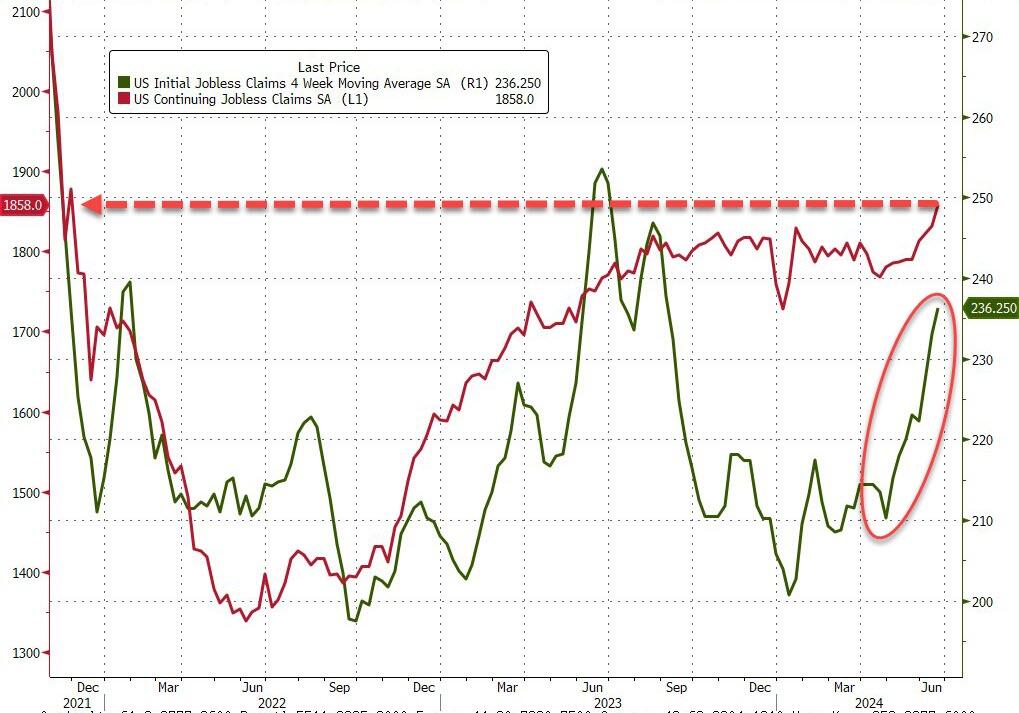
The rise of initial claims over the past few weeks, and nine consecutive increases in continuing claims, support the June 2024 Sahm indication.
Source: Bloomberg
Equity futures were flat just after the release, while Treasuries rallied across all maturities.
In recent months, Fed Chairman Jerome Powell has indicated that “unexpected weakness” may prompt a start to an accommodative policy stance without the additional data sought regarding the pace of disinflation. Historically, an increase in unemployment rates and the onset of a recession have led to policy adjustments aimed at stimulating economic growth and mitigating job losses, and the reversal of the rate hikes which began in 2022 to mitigate the highest inflation in four decades has been widely anticipated.
While more data will be required to confirm the Sahm Rule indication, the impact of accelerating prices, interest rates at their highest levels since 2007, and commercially suppressive pandemic policies have probably caught up with US producers and consumers.
Biden’s version of Sahm’s Club. Where the economy tanks and all he and his wife Jill care about is staying in Power. Perhaps we should call the sagging US economy “Joe’s Club.”
Housing in the US is simply unaffordable. Particularly since home prices and mortgage rates have soared undier Biden.
.Owning a house is less affordable for average earners in the US than at anytime in 17 years.
The costs of a typical home — including mortgage payments, property insurance and taxes — consumed 35.1% of the average wage in the second quarter, the highest share since 2007 and up from 32.1% a year earlier, according to a new report from Attom.
Growth in expenses, along with mortgage rates hovering around 7%, have outpaced income gains as a persistent shortage of listings pushed the median home price to a record-high $360,000, Attom said. In more than a third of US markets, ownership costs ate up 43% of average local wages, far above the 28% considered to be a guideline for affordability.
The latest data “presents a clear challenge for homebuyers,” Rob Barber, chief executive officer of Attom, said in a statement. “It’s common for these trends to intensify during the spring buying season when buyer demand increases. However, the trends this year are particularly challenging for house hunters.”
Pricey markets in the West and Northeast had the biggest declines in affordability, including Orange and Alameda counties in California, and Brooklyn and Nassau County in New York.
Among the 589 counties analyzed, 582, or 98.8%, were less affordable in the second quarter than their historic affordability averages, Attom said.
On the mortgage side, mortgage applications decreased 2.6 percent from one week earlier, according to data from the Mortgage Bankers Association’s (MBA) Weekly Applications Survey for the week ending June 28, 2024.
The Market Composite Index, a measure of mortgage loan application volume, decreased 2.6 percent on a seasonally adjusted basis from one week earlier. On an unadjusted basis, the Index increased 8 percent compared with the previous week. The Refinance Index decreased 2 percent from the previous week andwas 29 percent higher than the same week one year ago. The seasonally adjusted Purchase Index decreased 3 percent from one week earlier. The unadjusted Purchase Index increased 7 percent compared with the previous week and was 12 percent lower than the same week one year ago.
No, Joe Biden isn’t Joltin’ Joe Di Maggio (the Yankee Clipper). Joe Biden is a Socialist who loves government and hates free markets. I feel like Biden and his junta are emuilating the old Soviet Union and Communism. Those of us who still love free markets are back on the chain gang.
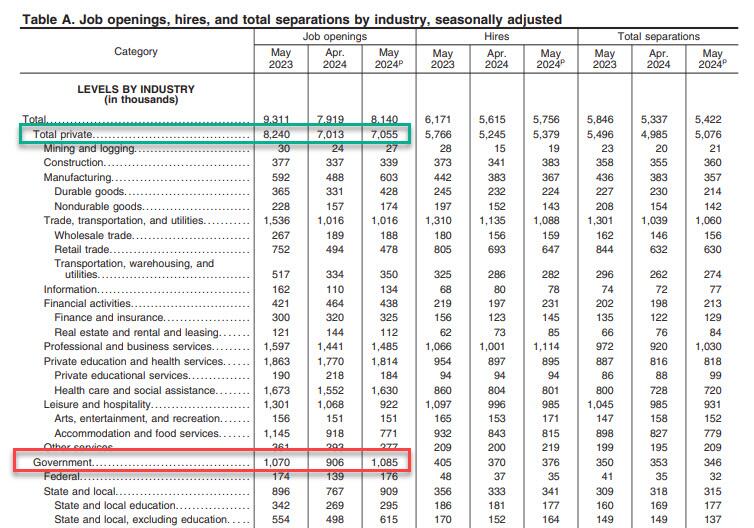
After two months of sharp declines in the number of job openings, moments ago Biden’s highly politicized Department of Labor reported that in May, the number of job openings unexpectedly spiked by a whopping 221K, to 8.140 million – far above the 7.950 million estimate – from a downward revised April print of 7.919 million, down 140K from the original print of 8.059 million.
Job revisions aside, there was only a 2.8% increase in private sector job openings in May. On the other hand, nonproductive job openings (aka, government) were up a staggering 20% in May.
C’mon man, hiring government workers doesn’t grow the economy in an organic way. Just a Soviet way.
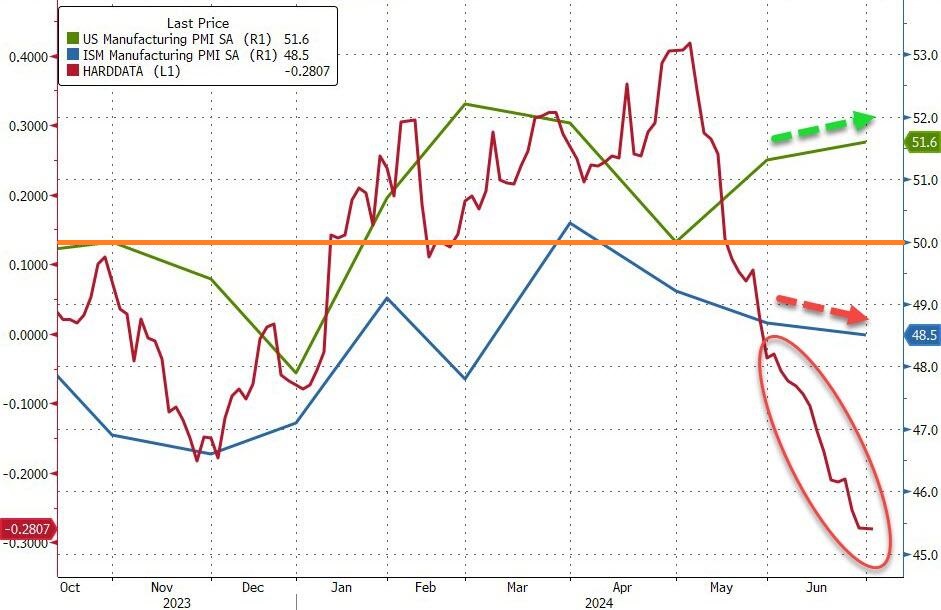
S&P Global US Manufacturing PMI rose from 51.3 in May to 51.6 for the final June print (down very modestly from the 51.7 flash print).
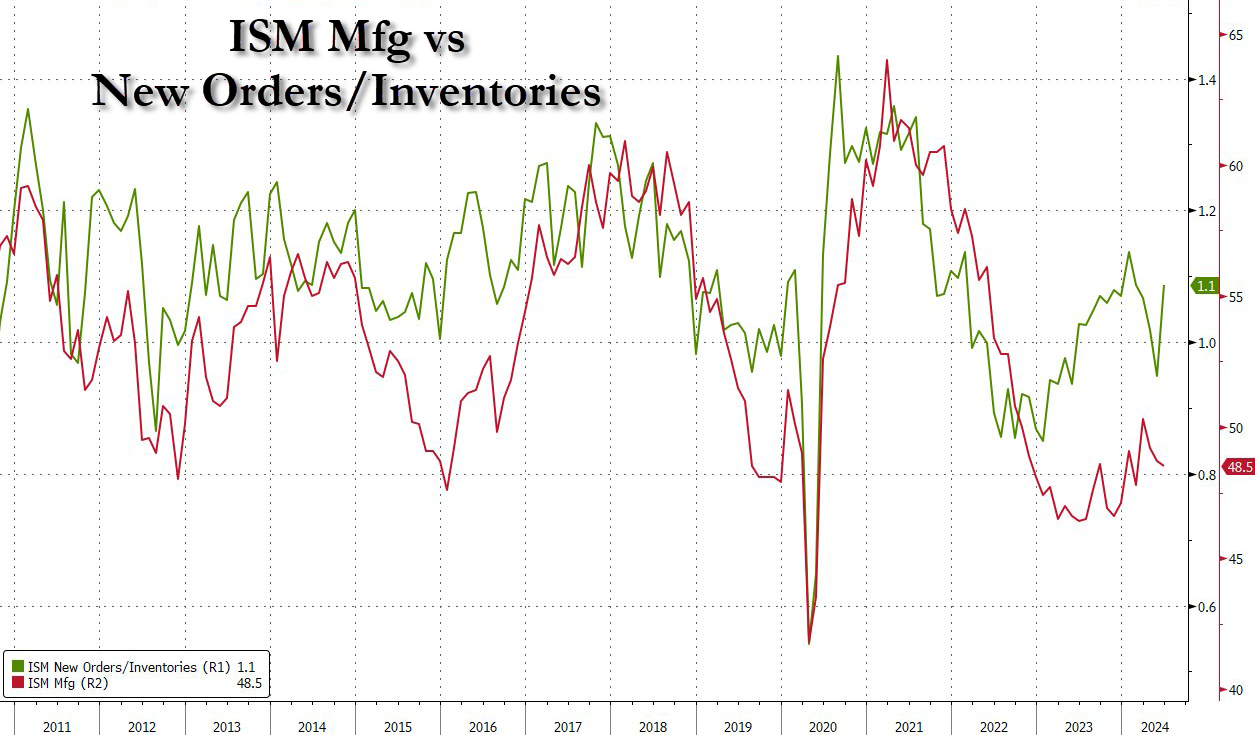
ISM US Manufacturing PMI dropped from 48.7 to 48.5 in June (well below the 49.1 expected)
Source: Bloomberg
Need more confusion…
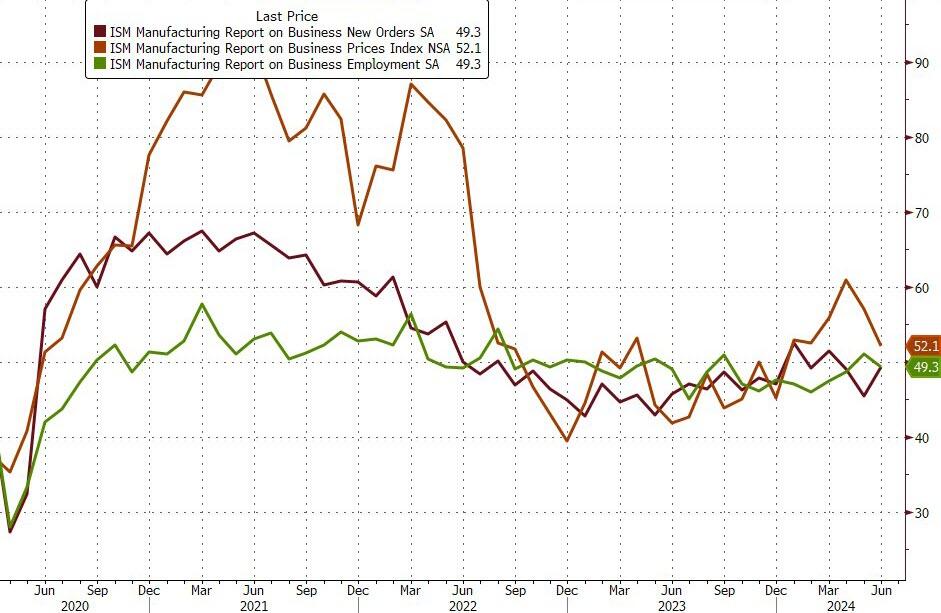
S&P Global noted that higher supplier charges were signaled in June. Alongside rising labor costs, this resulted in a further marked increase in input prices. But, ISM saw Prices Paid plunge from 57.0 to 52.1, well below the 55.8 expected…
Source: Bloomberg
New orders rebounded in June but employment dropped back into contraction. On the bright side, Orders/Inventories (typically a leading indicator), ticked up in June…
“The S&P Global PMI survey shows US manufacturers struggling to achieve strong production growth in June, hamstrung by weak demand from domestic and export markets alike. Although the PMI has now been in positive territory in five of the first six months of 2024, up from just one positive month in 2023, growth momentum remains frustratingly weak.
“Factories have been hit over the past two years by demand switching post-pandemic from goods to services, while at the same time household and business spending power has been diminished by higher prices and concerns over higher-for-longer interest rates. These headwinds persisted into June, accompanied by heightened uncertainty about the economic outlook as the presidential election draws closer.“
Finally, despite the uptick, Williamson admits the truth under the surface of the survey:
“Business confidence has consequently fallen to the lowest for 19 months, suggesting the manufacturing sector is bracing itself for further tough times in the coming months.”
However, we are sure business owners everywhere were reassured by the commander-in-chief’s commanding performance in the debate last week. /sarc
Gimme two steps to sell my house. Are people getting out of dodge?? Calfornia Gpvernor “Greasy Gavin” Newsom sold his Sacramento home and moved to Marin County for better schools. Sacrramento active housing inventory is up 65.6% YoY.
Active housing inventory in May is up 27.5% YoY nationally, with Denver leading at 75.2% YoY. I highlight Columbus Ohio at +32.9% since that is where I live.
A new report from Construction Coverage has revealed where the largest increases in real estate inventory in the U.S. are taking place.
The report notes that the current housing shortage—which is now estimated to be between four million and seven million homes—can trace its beginnings to long before the COVID-19 pandemic. In the 10 years following the Great Recession, the United States constructed fewer new homes than in any other decade since the 1960s.
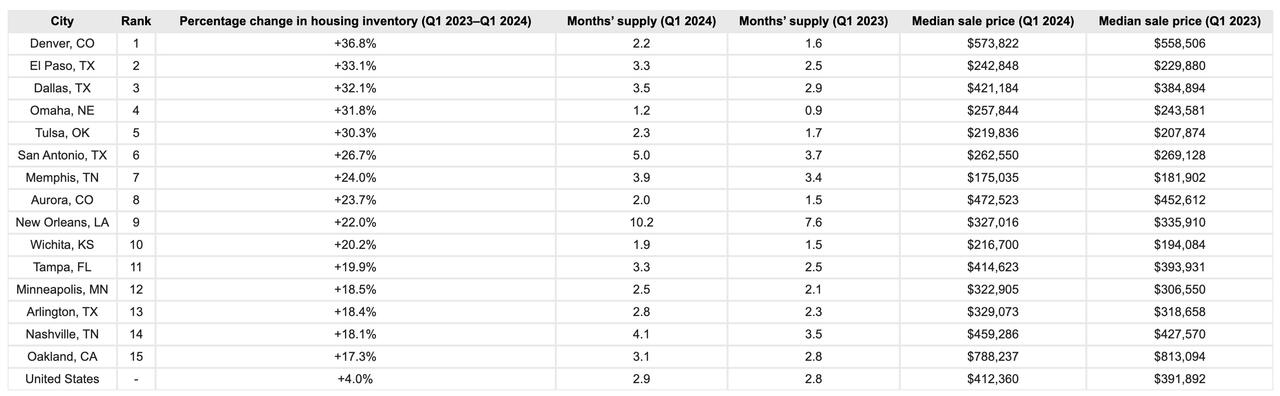
They write that the lack of housing affects certain areas more severely than others. Researchers ranked locations based on the percentage change in the average monthly housing inventory—the total number of active listings plus pending sales at the end of the month—between Q1 2023 and Q1 2024.
Data from a national level showed that U.S. housing inventory decreased from more than two million in 2012 to a low of approximately 630,000 at the start of 2022.
Over the same period, months’ supply—a measure of how long it would take existing inventory to sell if no new homes came on the market—plummeted from a national high of 7.5 months to a historic low of 1.1 months, the report adds.
It also noted that inventory has rebounded slightly since early 2022: throughout the first quarter of 2024, the national inventory hovered around 970,000 homes for sale, marking a 4.0% year-over-year increase.
Despite this uptick, existing inventory would sustain the current sales pace for just 2.9 months—a marginal increase from the 2.8 months’ supply recorded last year.
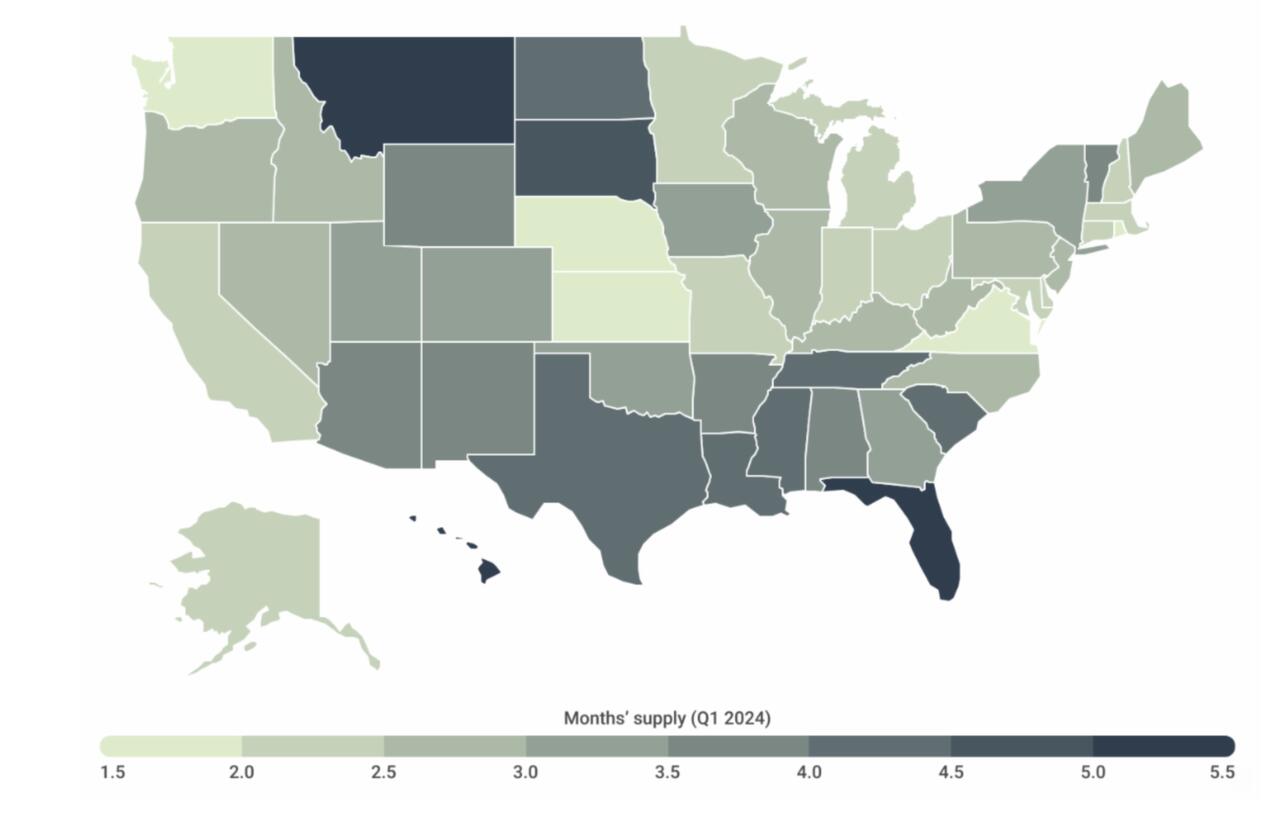
The report broke down trends by cities and states, finding that as of the first quarter of 2024, states with the lowest levels of supply are concentrated in and around the Midwest (such as Kansas with 1.5 months of supply) and the Northeast (including Rhode Island with 1.8 months of supply).
However, Washington also stands out for having some of the lowest levels of available housing nationally, with just 1.9 months of supply.
In contrast, several states in the South, led by Florida (5.2 months of supply), along with Hawaii (5.2 months) and Montana (5.1 months), present notably more favorable conditions for buyers.
Among the nation’s largest cities, Denver, El Paso, and Dallas recorded the largest year-over-year increases in housing inventory. At the opposite end of the spectrum, Las Vegas, Raleigh, and Chicago recorded the biggest declines.
The data is hardly a 2008-style collapse, but that doesn’t mean it isn’t noteworthy.
While the ‘turning of the tide’ still remains muted, the housing market is so large it rarely corrects swiftly. It’s important to notice, however, that rising inventory ticking higher – combined with mortgage rates now over 7% – could easily be telegraphing a correction in prices heading into 2025.
During the first three months of 2023, U.S. office vacancy topped 20 percent for the first time in decades. In San Francisco, Dallas, and Houston, vacancy rates are as high as 25 percent. These figures understate the severity of the crisis because they only cover spaces that are no longer leased. Most office leases were signed before the pandemic and have yet to come up for renewal. Actual office use points to a further decrease in demand. Attendance in the 10 largest business districts is still below 50 percent of its pre-COVID level, as white-collar employees spend an estimated 28 percent of their workdays at home.
A new report from Moody’s offers yet another grim outlook that the commercial real estate downturn is nowhere near the bottom. Elevated interest rates and persistent remote and hybrid working trends could result in around 24% of all office towers standing vacant within the next two years. The office tower apocalypse will result in more depressed values that will only pressure landlords.
“Combining these insights, with our more than 40 years of historic office performance data, as well as future employment projections, our model indicates that the impact on office demand from work from home will be around 14% on average across a 63- month period, resulting in vacancy rates that peak in early 2026 at approximately 24% nationally,” Moody’s analysts Todd Metcalfe, Anthony Spinelli, and Thomas LaSalvia wrote in the report.
In a separate report, Tom LaSalvia, Moody’s head of CRE economics, wrote that the office vacancy rate’s move from 19.8% in the first quarter of this year to the expected 24% by 2026 could reduce revenue for office landlords by between $8 billion and $10 billion. Factor in lower rents and higher costs, this may translate into “property value destruction” in the range of a quarter-trillion dollars.
In addition to remote working trends, Moody’s analysts pointed out that the amount of office space per worker has been in a “general downward trend for decades.”
At the peak of the Dot-Com boom, office workers used an average of 190 sq ft. The figure has since slid to 155 sq ft in 2023.
“The argument for maintaining or even increasing remote work practices remains compelling for many businesses,” the analysts said, adding, “If productivity remains stable and costs can be reduced by forgoing physical office spaces, the rationale for mandating in-office attendance diminishes.”
Related research from the McKinsey Global Institute forecasts that office property values will plummet by $800 billion to $1.3 trillion by the decade’s end.
Moody’s expects vacancy rates to top out as office towers are demolished or converted to residential ones in the coming years.
“Right-sizing will continue over the next decade as the market shakes out less efficient space for flexible floorplans that support our relatively new working habits,” they said.
Earlier this year, Goldman analyst Jan Hatzius pointed out that a further 50% price decline would make office tower conversions financially sensible.
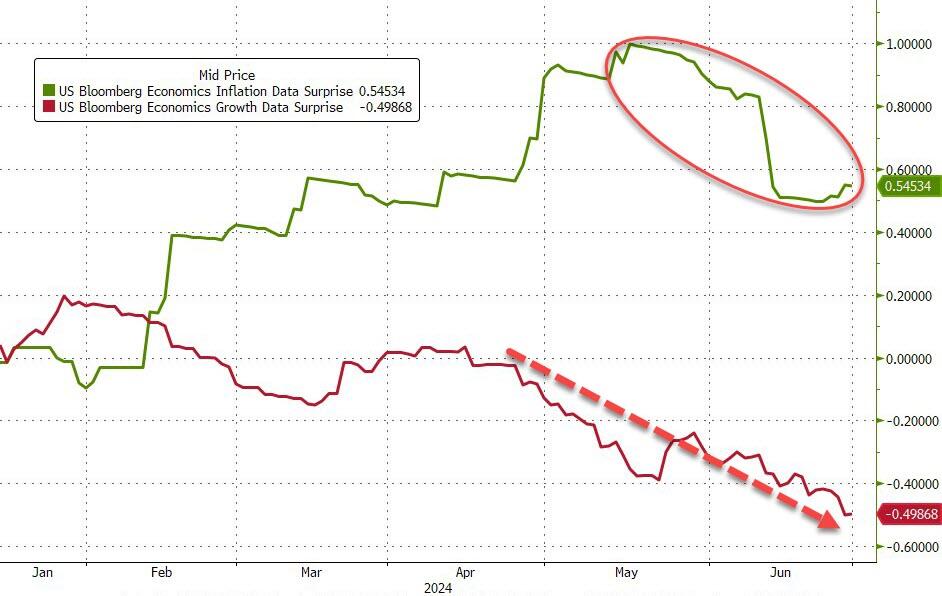
…which, many believe, will also drag down inflation (and it has been)…
Source: Bloomberg
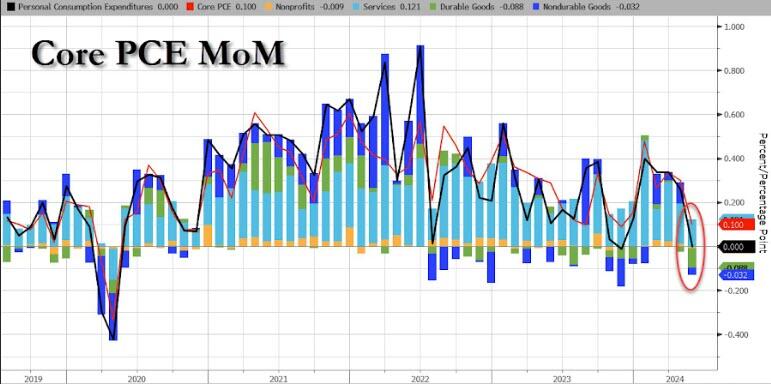
Today, we get to see The Fed’s favorite inflation indicator – Core PCE – which rose 0.1% MoM in May (after a revised +0.3% MoM for April) and in line with expectations. The headline PCE Price Index was unchanged MoM as expected as Durable Goods deflation trumped surging Services costs…
Source: Bloomberg
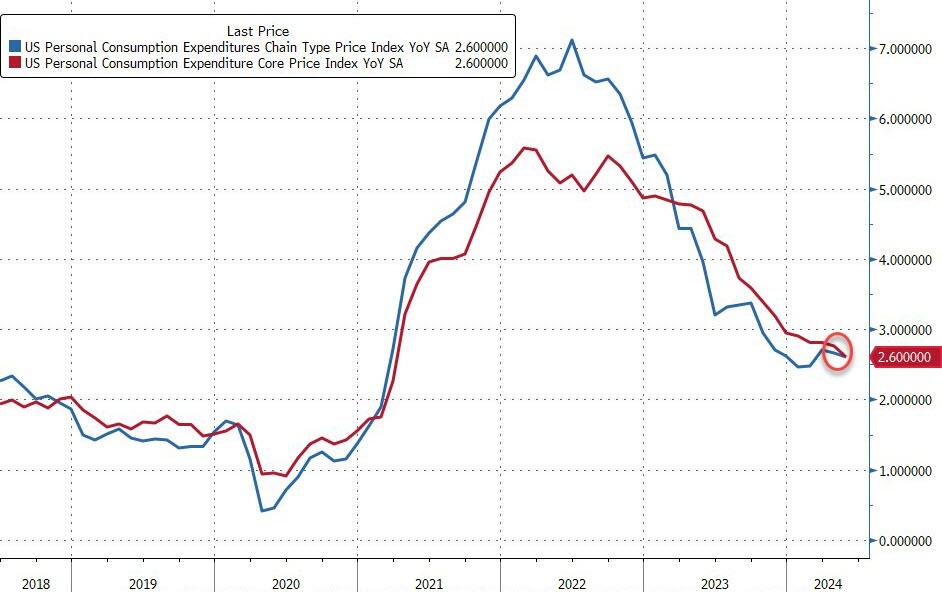
On a YoY basis, both headline and core PCE declined…
Source: Bloomberg
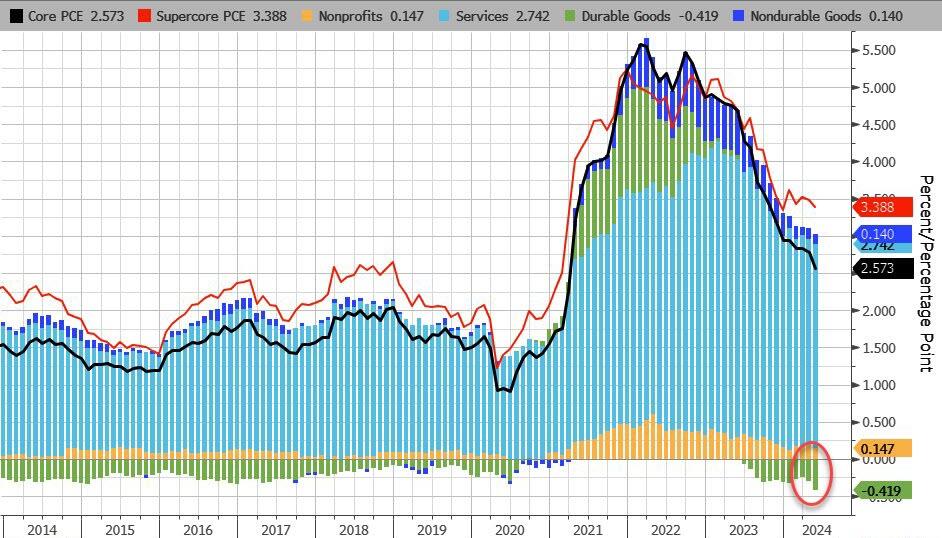
On a YoY basis, Durable Goods deflation is at its strongest in at least a decade…
Source: Bloomberg
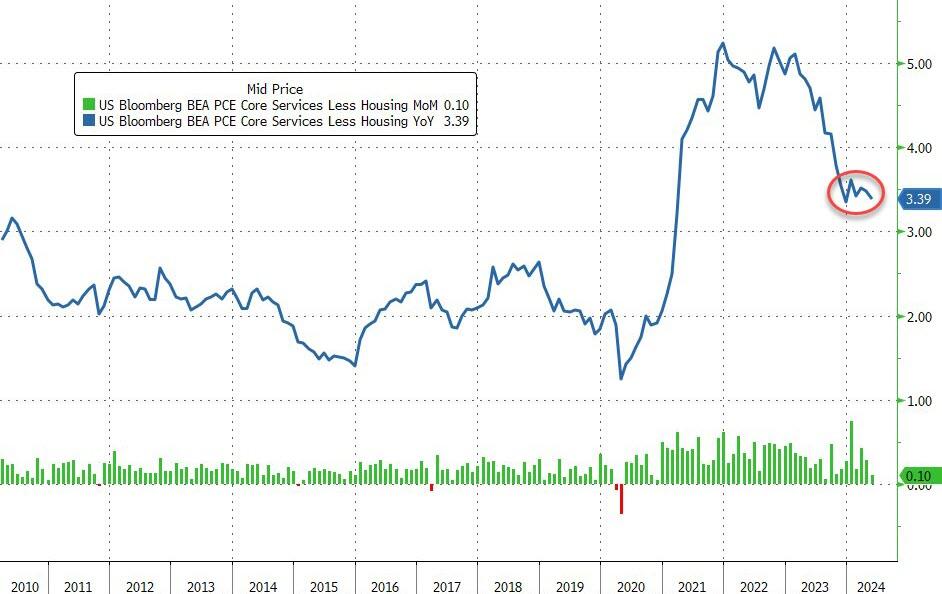
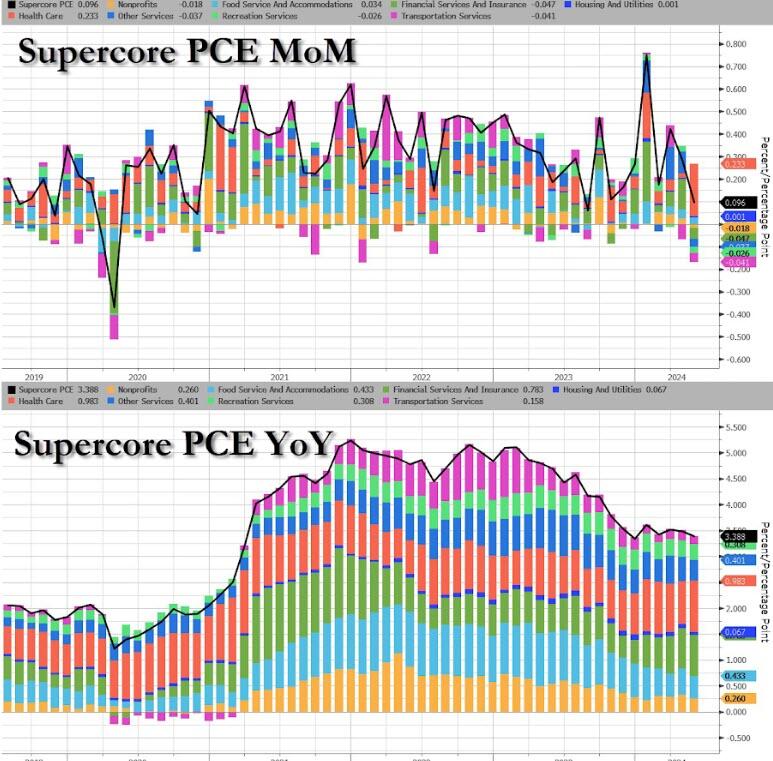
More notably, the so-called SuperCore PCE rose 0.1% MoM, which saw YoY slow to 3.39%… which is awkwardly stagnant at elevated levels…
Source: Bloomberg
That is the 49th straight monthly rise in SuperCore prices with Healthcare costs soaring…
Source: Bloomberg
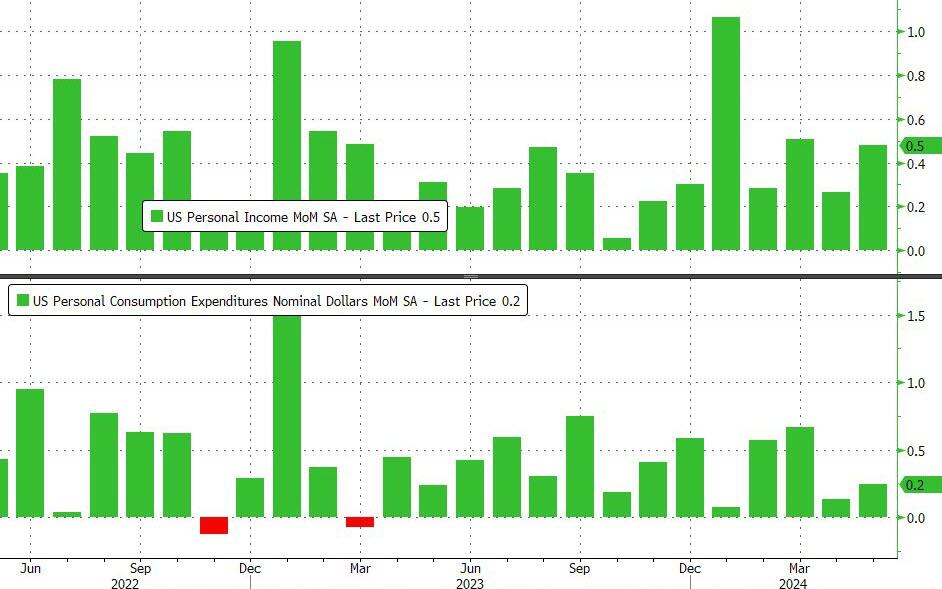
On a MoM basis, Income grew more than expected (+0.5% vs +0.2% exp) while spending rose less than expected (+0.2% MoM vs +0.3% exp)
Source: Bloomberg
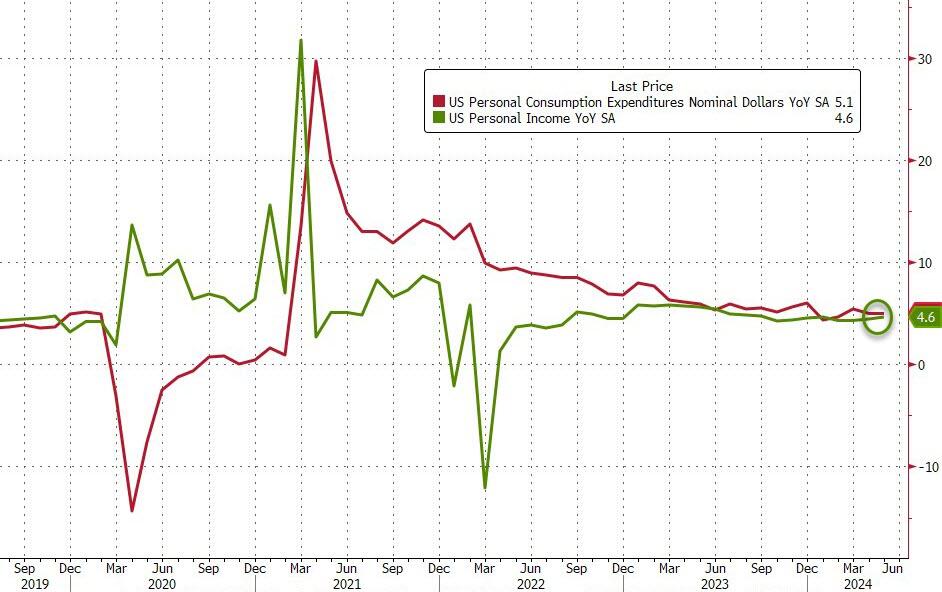
Which accelerated both income and spending on a YoY basis (with the latter outpacing the former, of course)…
Source: Bloomberg
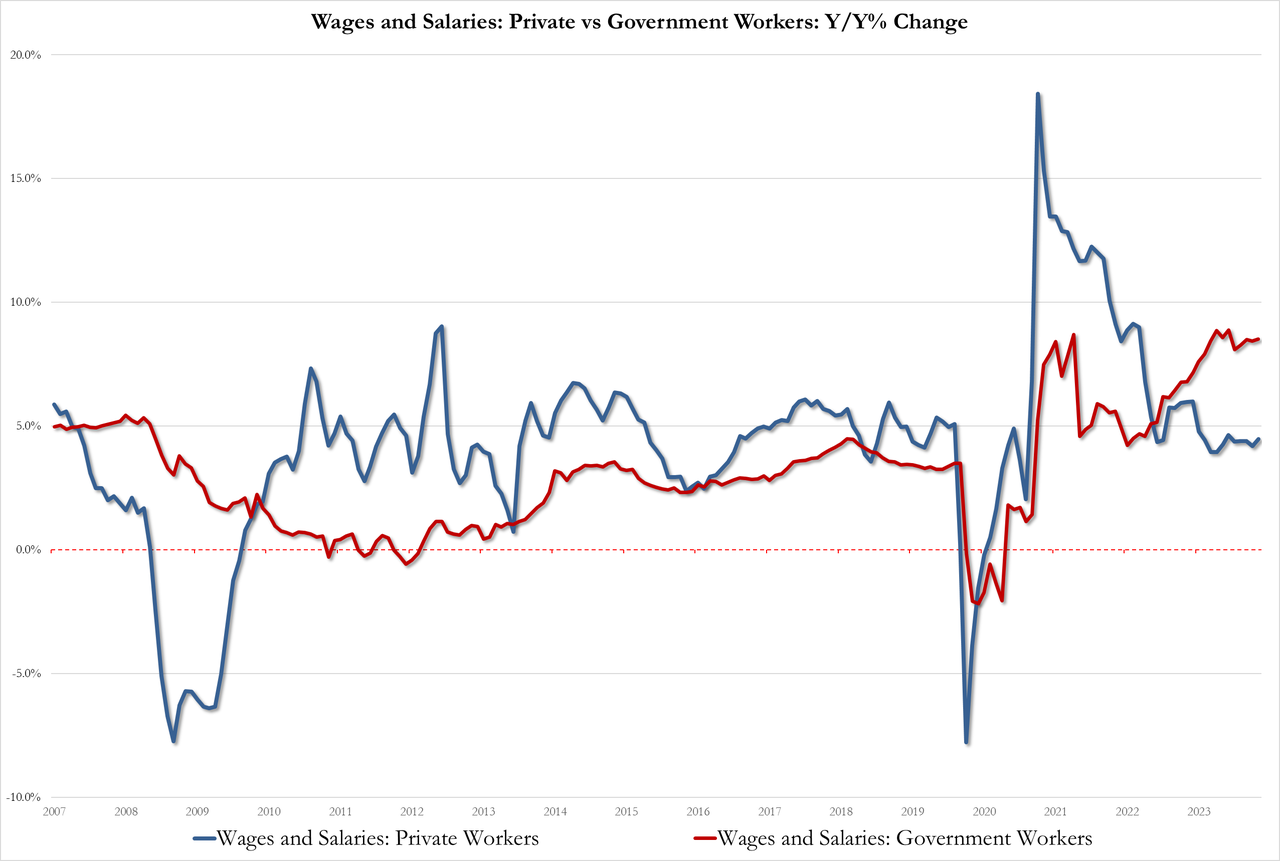
With wage pressures rising once again…
Government 8.5%, up from 8.4% but below the record high of 8.9%
Private 4.5% up from 4.2%
Source: Bloomberg
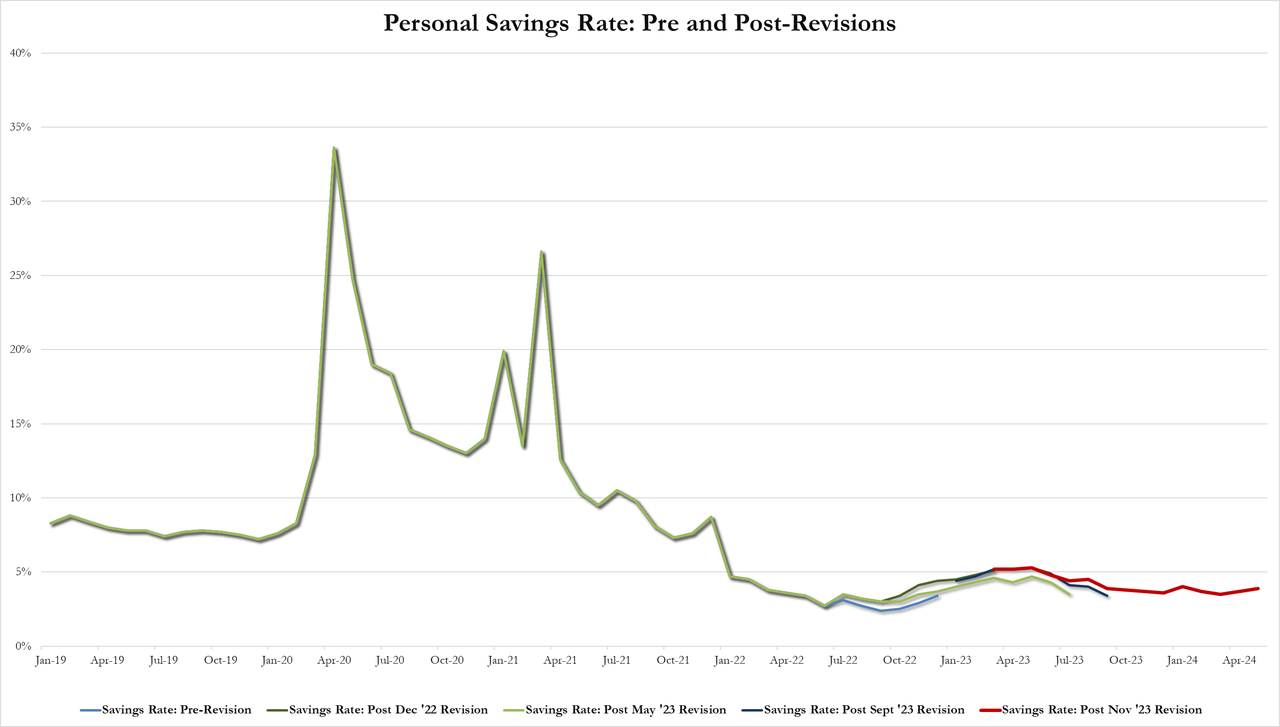
And after a series of revisions, the savings rate ticked up to 3.9% of DPI (from 3.7%) – the highest since January…
Source: Bloomberg
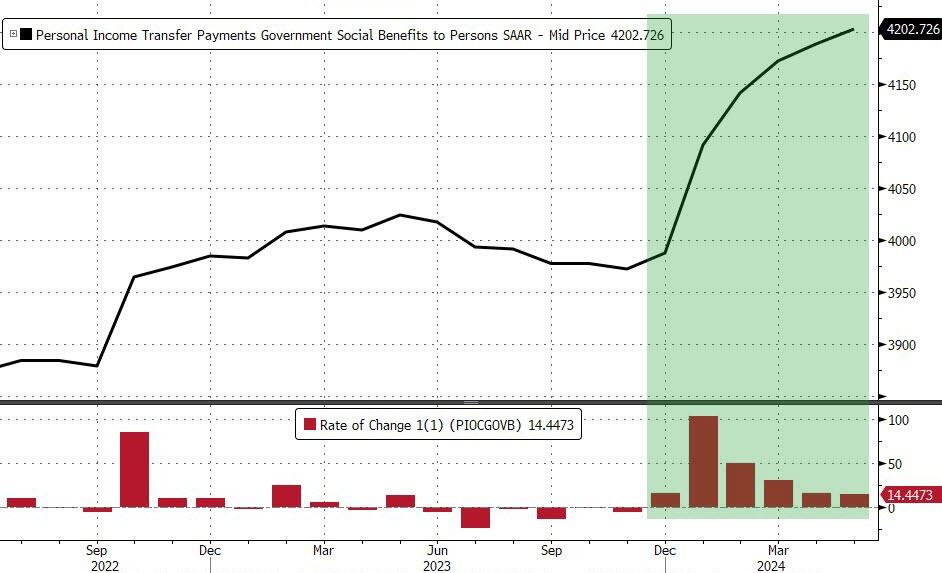
All of which takes place against a background of the sixth straight month of rising government handouts (well it is an election year after all)…
Source: Bloomberg
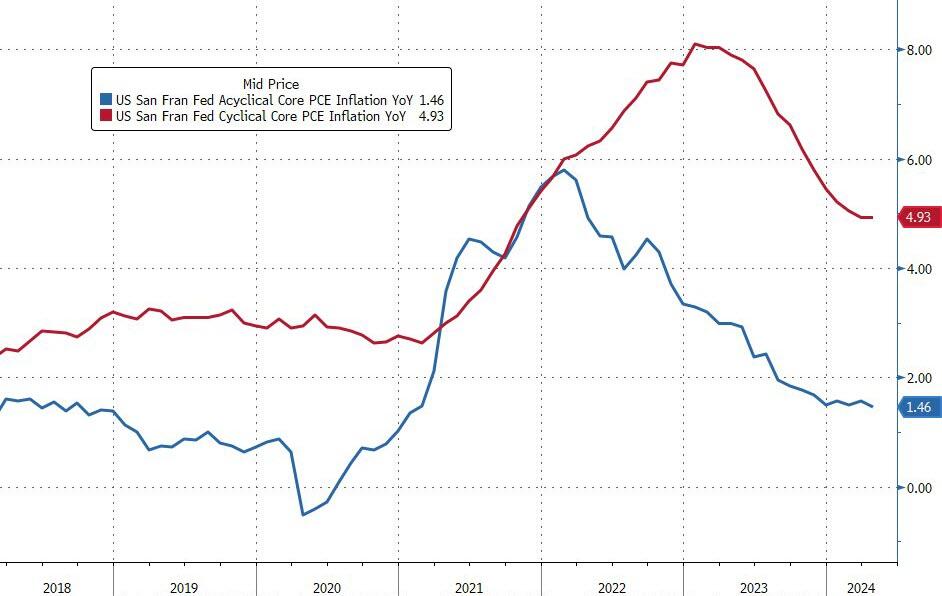
Finally, while acyclical inflationary pressures continue to drift lower, cyclical inflationary pressures remain extremely elevated…
Source: Bloomberg
A very mixed bag but nothing screams ‘automatic’ rate-cuts… and SuperCore refuses to budge.


You must be logged in to post a comment.