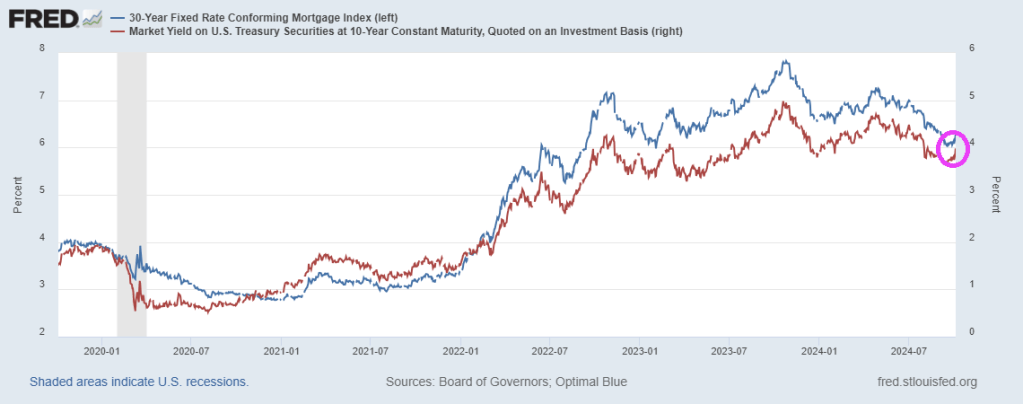
They can’t accuse Fed Chair Jerome Powell of trying too hard to help Donald Trump. Mortgage rates moved lower last week, following declining Treasury yields as economic data releases signaled a weakening U.S. economy. As a result, the 30-year fixed rate decreased for the third straight week to 6.77 percent. As a result …
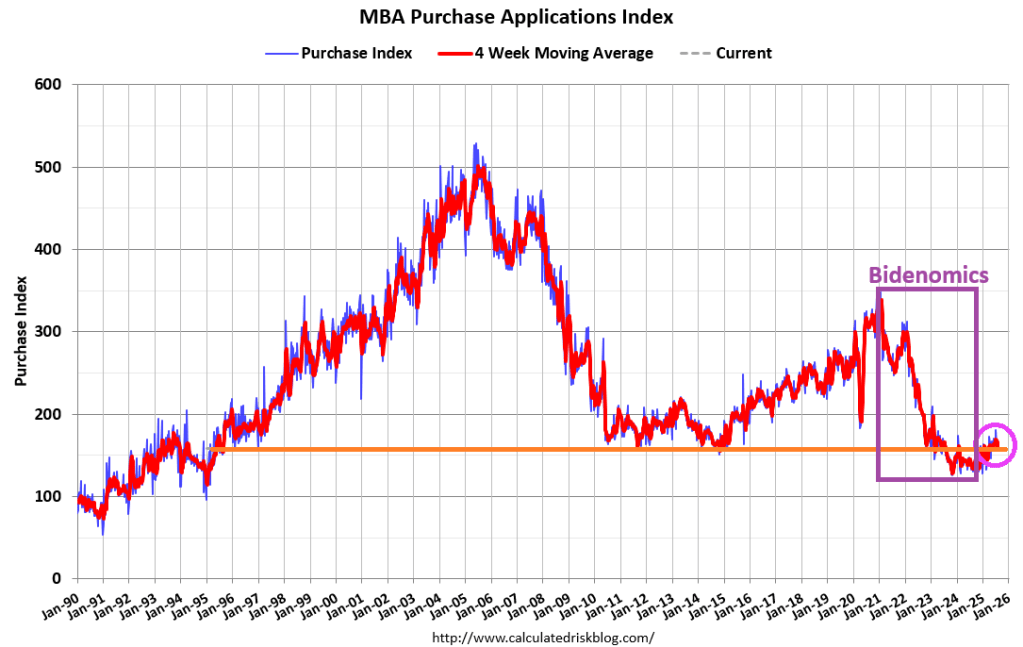
The Market Composite Index, a measure of mortgage loan application volume, increased 3.1 percent on a seasonally adjusted basis from one week earlier. On an unadjusted basis, the Index increased 3 percent compared with the previous week. The seasonally adjusted Purchase Index increased 2 percent from one week earlier. The unadjusted Purchase Index increased 1 percent compared with the previous week and was 18 percent higher than the same week one year ago.
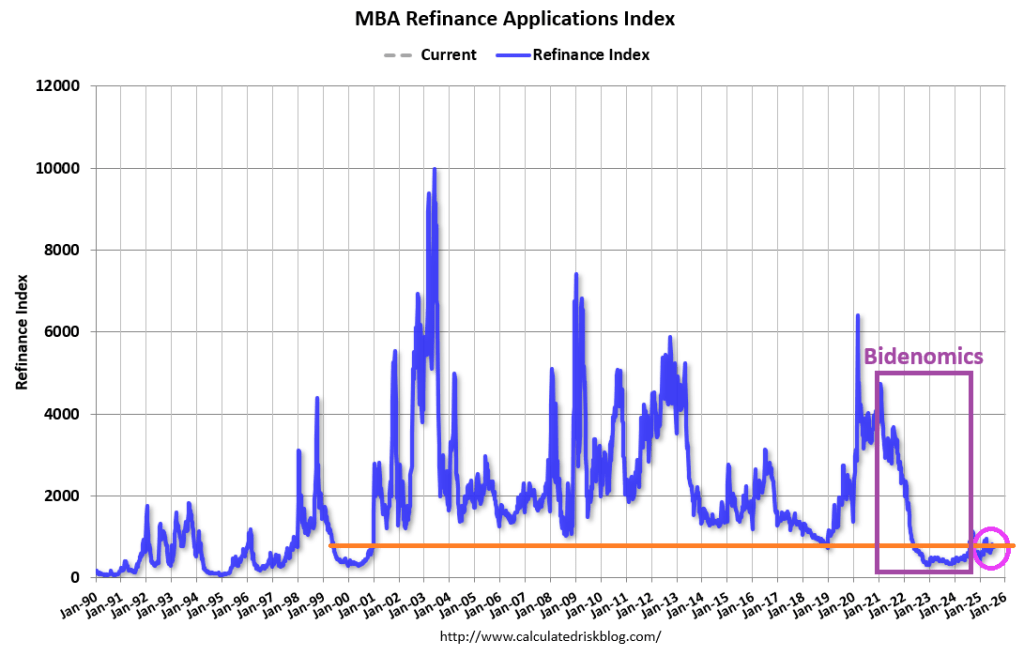
The Refinance Index increased 5 percent from the previous week and was 18 percent higher than the same week one year ago.
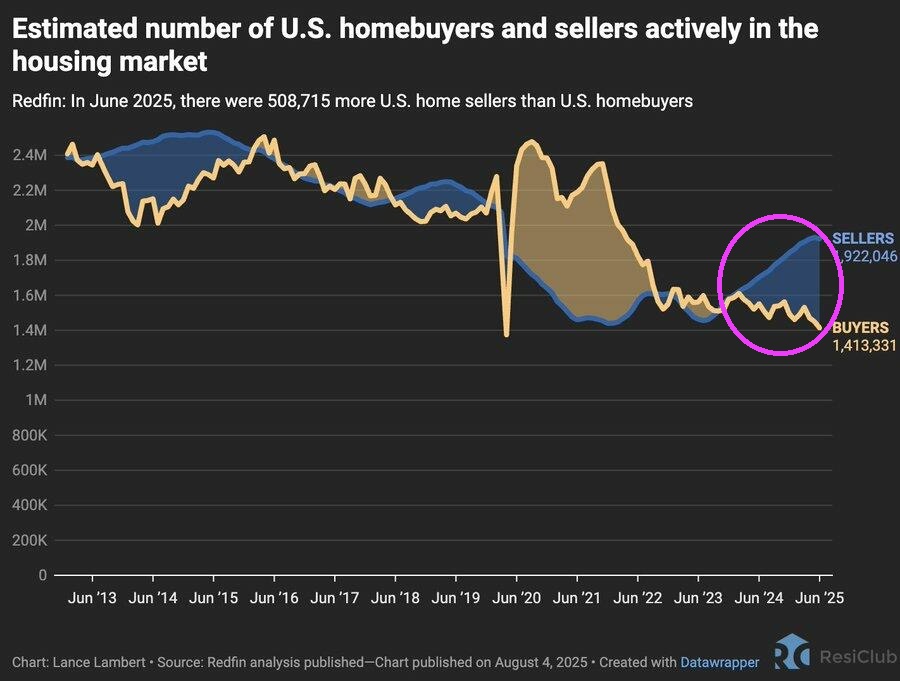
And the number of sellers in the housing market is greatly outweighing the number of buyers.
Mortgage and housing economists should breathe a sigh of relief that Bidenomics is over, but I doubt it they will.
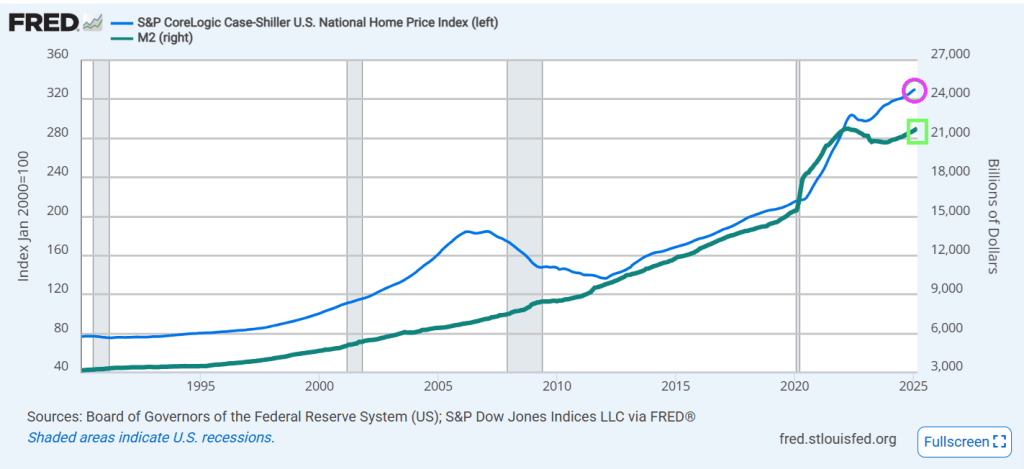
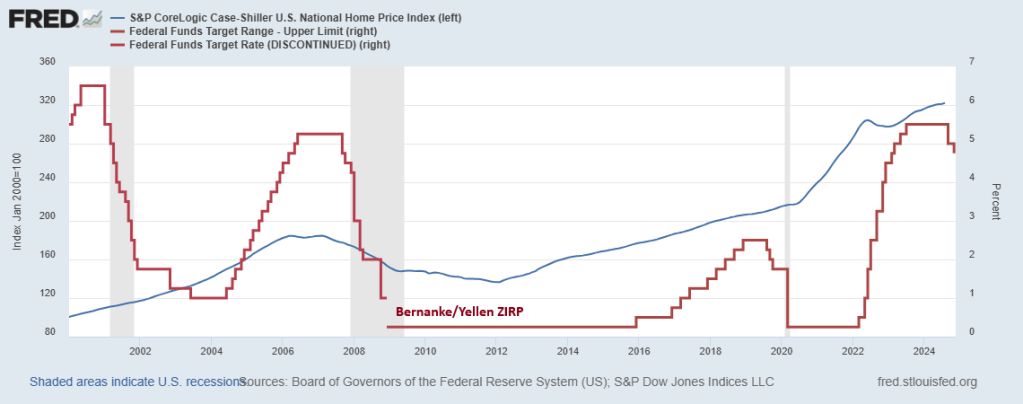
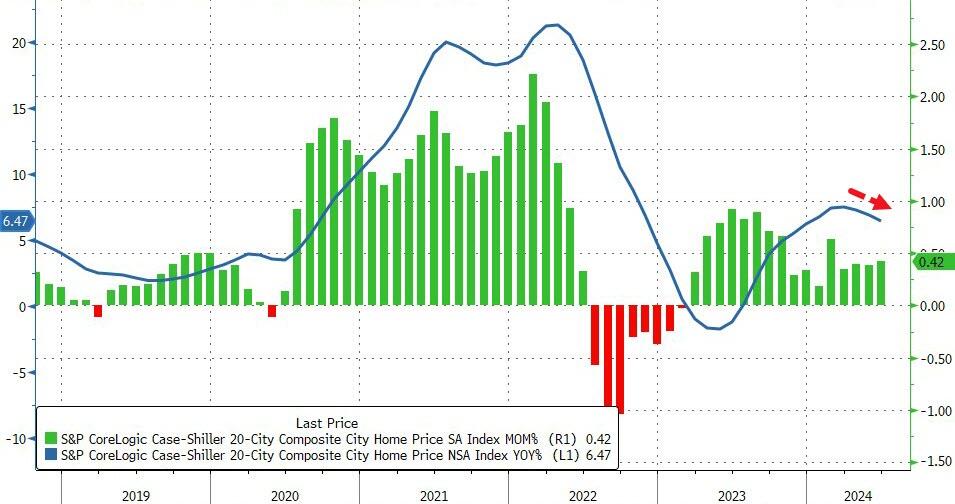
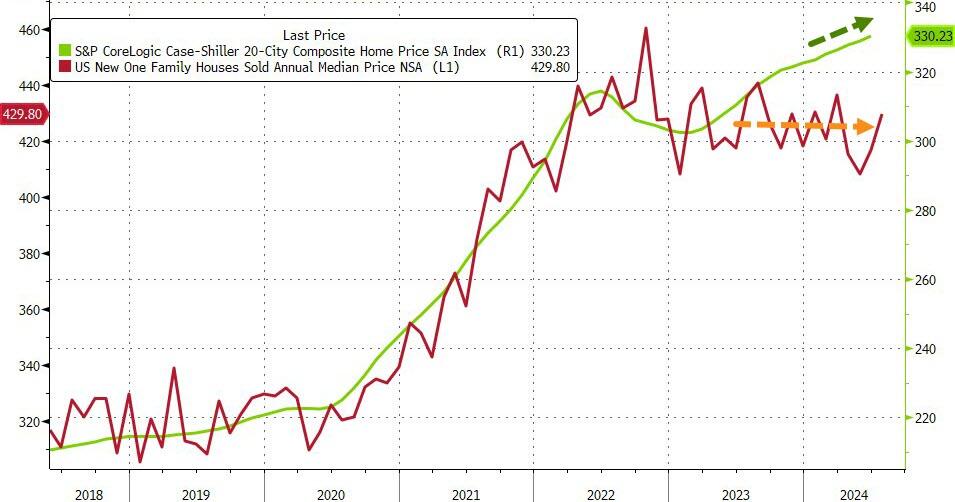
US home prices hit a new record high in February, according to the latest data from S&P CoreLogic Case-Shiller, rising 0.4% MoM (as expected). However, the pace of price rises did slow modestly (after accelerating for the past three months) to +4.50% YoY. And home prices track Fed money printing.
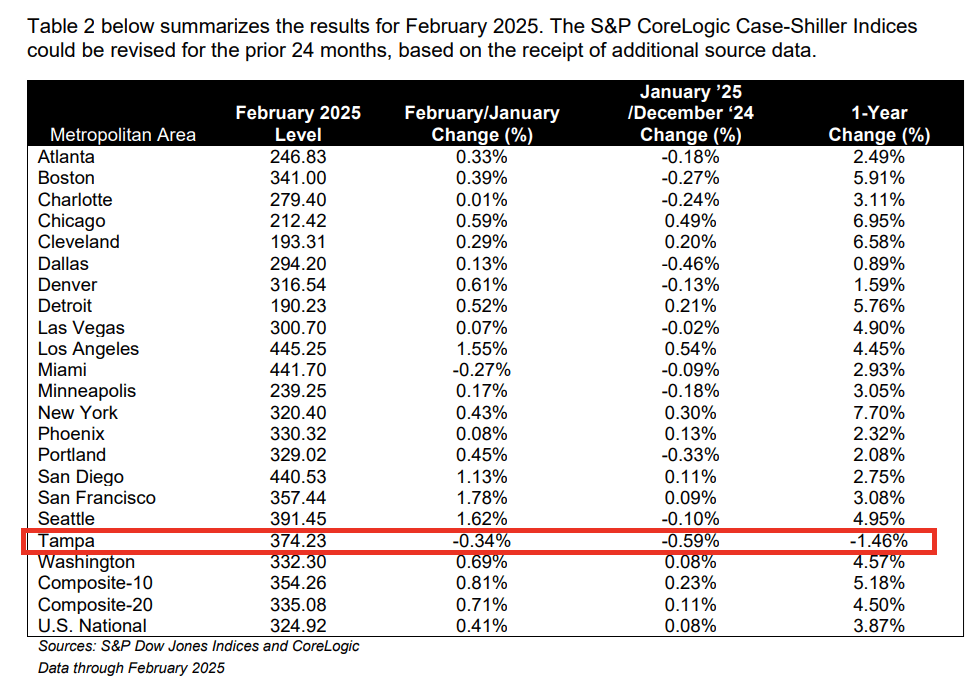
The S&P CoreLogic Case-Shiller U.S. National Home Price NSA Index, covering all nine U.S. census divisions, reported a 3.9% annual return for February, down from a 4.1% annual gain in the previous month. The 10-City Composite saw an annual increase of 5.2%, down from a 5.4% annual increase in the previous month. The 20-City Composite posted a year-over-year increase of 4.5%, down from a 4.7% increase in the previous month. New York again reported the highest annual gain among the 20 cities with a 7.7% increase in February, followed by Chicago and Cleveland with annual increases of 7.0% and 6.6%, respectively. Tampa posted the lowest return, falling 1.5%.
The pre-seasonally adjusted U.S. National, 10-City Composite, and 20-City Composite Indices presented slight upward trends in February, posting 0.4%, 0.8%, and 0.7% respectively.
After seasonal adjustment, the 10-City and 20-City Composite Indices posted month-over-month increases of 0.5% and 0.4%. The U.S. National Composite Index posted a month-over-month increase of 0.3%.
“Even with mortgage rates remaining in the mid-6% range and affordability challenges lingering, home prices have shown notable resilience,” said Nicholas Godec, CFA, CAIA, CIPM, Head of Fixed Income Tradables & Commodities at S&P Dow Jones Indices. “Buyer demand has certainly cooled compared to the frenzied pace of prior years, but limited housing supply continues to underpin prices in most markets. Rather than broad declines, we are seeing a slower, more sustainable pace of price growth.”
The US economy is gradually recovering from Bidenomics (government/donor dictated spending). Mortgage applications increased 11.2 percent from one week earlier, according to data from the Mortgage Bankers Association’s (MBA) Weekly Mortgage Applications Survey for the week ending March 7, 2025.
The Market Composite Index, a measure of mortgage loan application volume, increased 11.2 percent on a seasonally adjusted basis from one week earlier. On an unadjusted basis, the Index increased 12 percent compared with the previous week. The seasonally adjusted Purchase Index increased 7 percent from one week earlier. The unadjusted Purchase Index increased 8 percent compared with the previous week and was 4 percent higher than the same week one year ago.
The Refinance Index increased 16 percent from the previous week and was 90 percent higher than the same week one year ago.
Mortgage rates declined for the sixth consecutive week, with the 30-year fixed rate dropping to 6.67 percent, the lowest level since October 2024. As a result, applications increased over the week and were up 31 percent from a year ago.
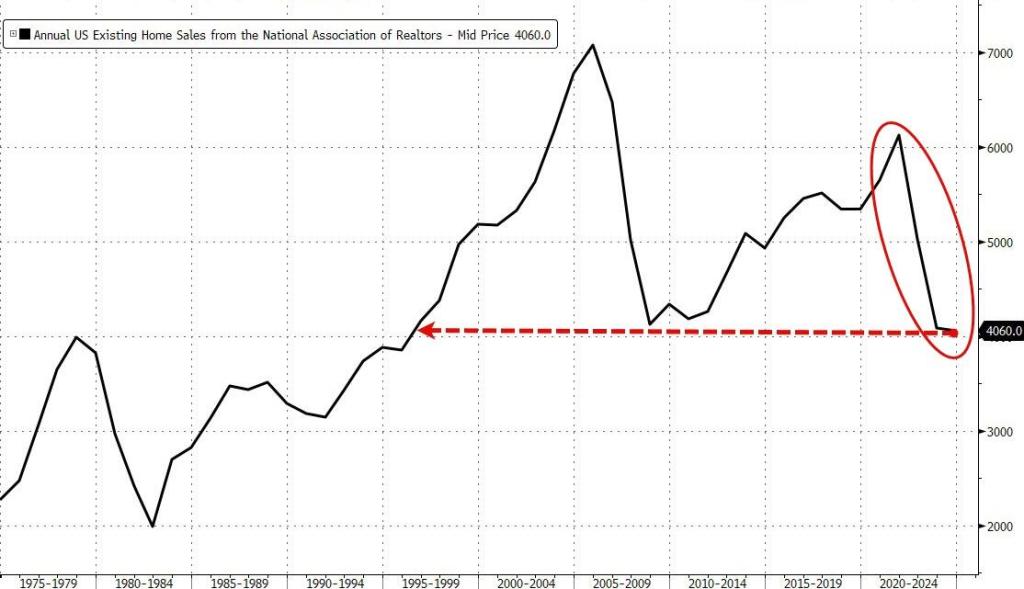
US Existing Home Sales rose for the third straight month in December (longest streak since late 2021), rising 2.2% MoM and up 9.3% YoY – the best annual shift since June 2021. However, despite the last rebound, for all of 2024, sales reached the lowest since 1995, when the US had about 70 million fewer people.
And with the lowest existing home sales since 1995, we have mortgage purchase applications at the lowest level since 1995.
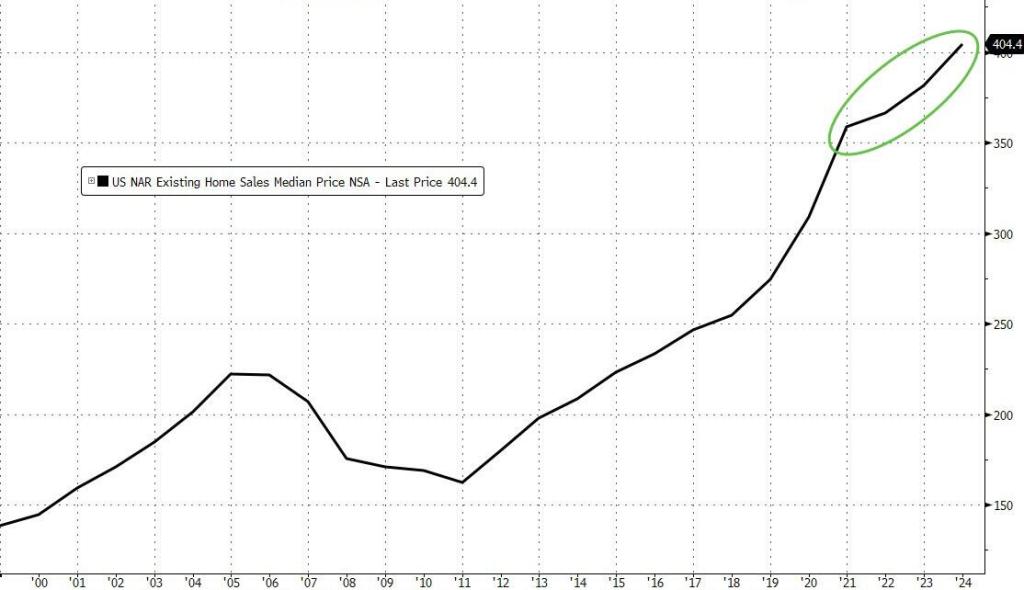
Why? The median price of EHS has exploded under Biden.
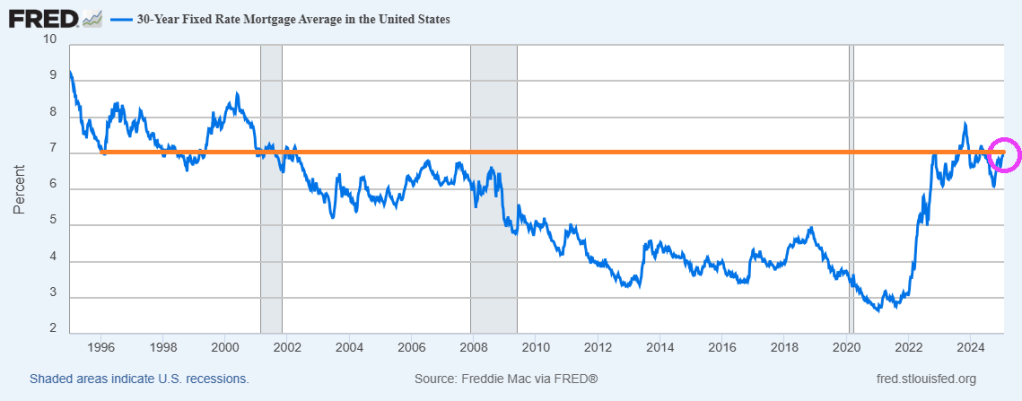
Mortgage rates are hovering around 7%, same as around 1995.
A recent paper by Michael Stegman, Ted Tozer and Richard Green reminds me of The Who’s song “Won’t Get Fooled Again.” Except that apparently Stegman, Tozer and Green did get fooled again.
I remember testifying in the House of Representatives in Washington DC on the financial crisis and housing markets. I pointed out that low down payment mortgages lending to households with low credit scores was very dangerous. I had the data and presented it to the House committee on financial services.
The problem with Stegman et al’s paper is that it ignores The Federal Reserve and Federal spending. After the financial crisis of 2008 when housing prices declined (especially in bubble states like Arizona, Nevada and Florida), Berananke and Yellen adopted a zero interest rate policy that resulted in housing prices rising again. Then we have Powell’s lowering of rates to near-zero following the Covid outbreak and the insane level of Federal spending that ensued helping to drive housing prices to dangerous bubble levels. Making first time homeowner purchases almost impossible.
So, like the 2000s, the pursuit of homeownership will lead to insance policy proposals. If nothing else, the Stegman et al proposal will lead to MORE inflation in housing prices and set the stage for a housing bubble burst of epic proportions.
Apparently, Stegman et al DID get fooled again. Or they just don’t care.
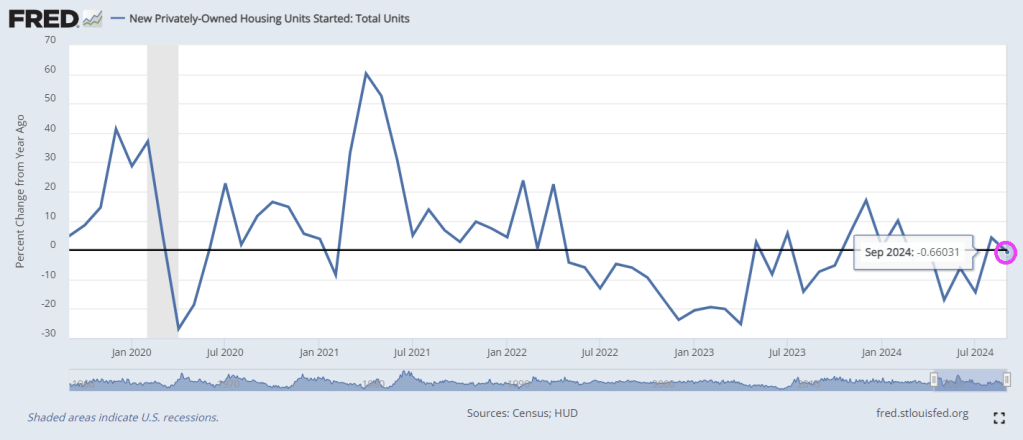
After surprising top the upside in August, Housing Starts and Building Permits disappointed in September, declining more than expected (-0.5% MoM and -2.9% MoM respectively)…
Source: Bloomberg
Under the hood, multi-family permits plunged 10.8% MoM (and multi-family starts dropped for the second straight month). Single-family starts rose 2.7% MoM and permiots inchjed higher by 0.3% MoM…
Source: Bloomberg
Rate-cut expectations appear to have taken the excitement out of the building market…
Source: Bloomberg
Housing Completions also dropped (but the BLS thinks construction jobs continue to rise non-stop)…
Source: Bloomberg
So, The Fed cuts short-term rates… mortgage-rates rise… and builders slow their building plans… that’s not how it’s supposed to work!
Mortgage rates are rising again with Friday’s surprising jobs report. But as it just a false election report. If Rasmussen is correct, mortgage rates should FALL again.
Big bubbles! US home pricest hit an all-time high as The Fed keeps its foot on the monetary gas pedal following the Covid economic shutdown in 2020.
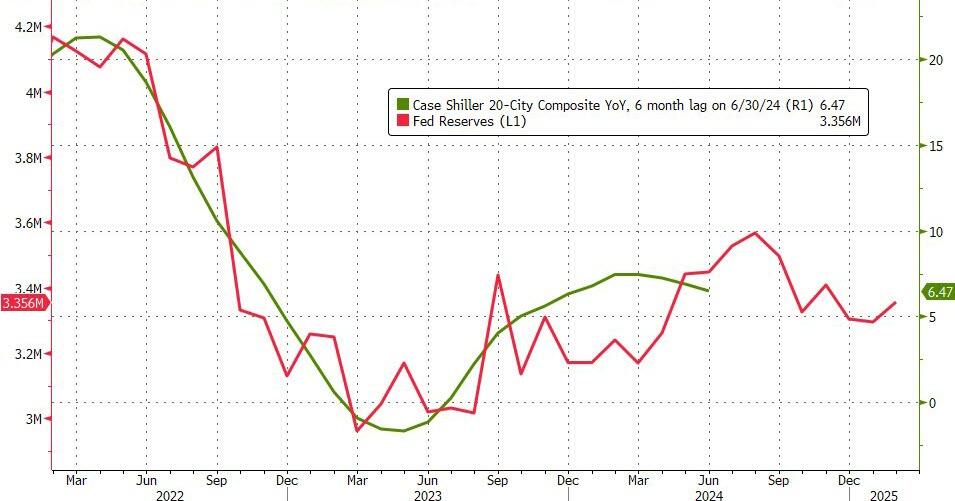
Home prices in America’s 20 largest cities rose for the 16th straight month in June (according to the latest data from S&P CoreLogic – Case Shiller – data today), up 0.42% MoM (hotter than expected and accelerating from May). On a YoY basis, prices rose 6.47%, but notably that is the third straight monthly slowdown in the pace of price appreciation…
Source: Bloomberg
Overall, US home prices reached a new record high in June (as median new home prices continued to tread water)…
Source: Bloomberg
Home prices continue to track Fed Reserves closely, but a turning point may come soon…
Source: Bloomberg
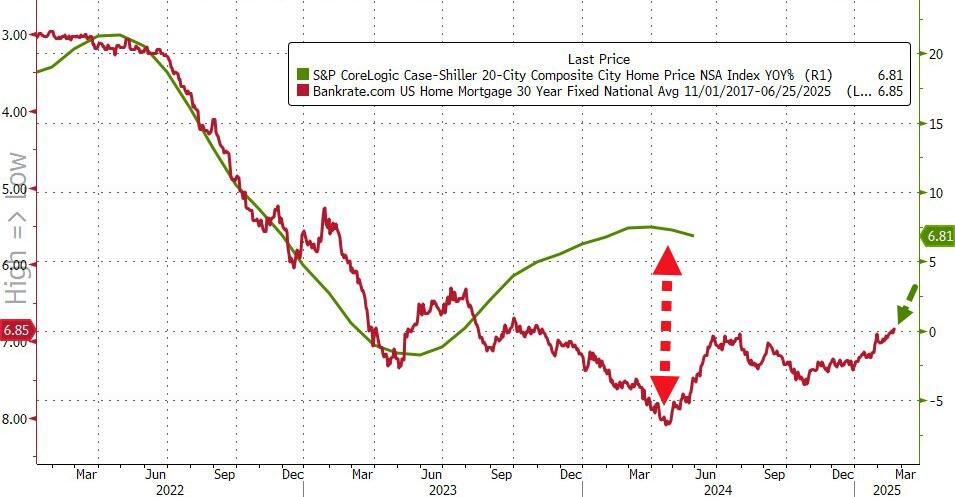
Given the smoothing and heavy lag in the Case-Shiller data, it’s hard to find a causal relationship between prices and mortgage rates…
Source: Bloomberg
But, with prices reaccelerating and mortgage rates already back below 7.00% – in anticipation of The Fed – WTF does Powell think is going to happen when he actually starts cutting with prices at these record highs.
The Freddie Mac HP index shows the variation in home price growth. New Jersey coastal towns of Atlantic City and Ocean City grew at 10% YoY while Lake Charles LA declined by -2% YoY.
The US is already at $35+ trillion with unfunded liabilties totalling $218+ trillion. Of course, the Biden Administration is attempting to cut Medicare for seniors and raise the price while handing out unlimited benefits to illegal immigrants.
.Given the financial burden of war, the country suspended interest payments on international debt over the last two years, which was set to expire on August 1, 2024.
Without this new debt restructuring, this default would have ranked among the 10 largest in recent history. The last time Ukraine defaulted on its debt was in 2015, after Russia’s invasion of Crimea.
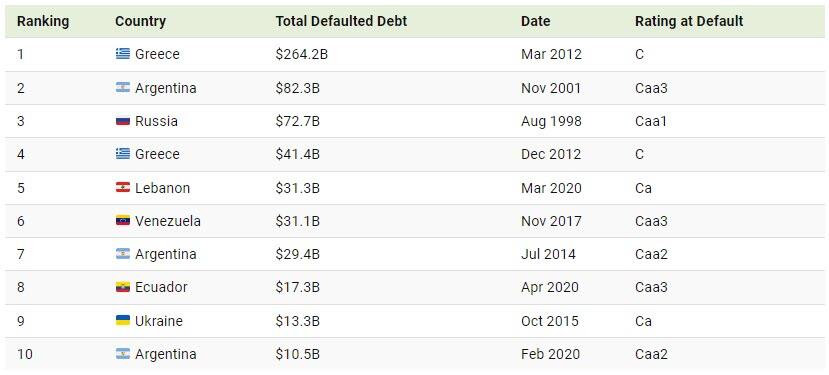
Below, we show the biggest sovereign debt defaults between 1983 and 2022:
Greece’s $264.2 billion default in 2012 stands as the largest overall, unfolding when the country was mired in recession for the fifth consecutive year.
The country defaulted again just nine months later, making it the fourth-largest ever. Leading up to the crash, Greece ran significant deficits despite being one of the fastest-growing countries in Europe. Furthermore, in 2009, the newly elected prime minister revealed that the country was $410 billion in debt—substantially more than previous estimates.
With the second-highest default recorded, Argentina failed to repay interest on $82.3 billion in foreign debt in 2001. Like Greece, it is a repeat offender, defaulting numerous times since independence in 1816. Today, Argentina is the largest debtor to the International Monetary Fund, despite being Latin America’s third-largest economy.
Following next in line is Russia’s 1998 default on $72.7 billion in loans, coinciding with a currency crisis that erased more than two-thirds of the ruble’s value in a matter of weeks. That year, several other countries including Venezuela, Pakistan, and Ukraine defaulted on their debts after the Asian Financial Crisis of 1997 spurred instability in global financial markets.
Just as 1998 saw a wave of defaults, 2020 was a year marked by major debt upheavals. Due to the pandemic and collapsing oil prices, it was a record year for sovereign defaults, reaching seven in total. Among these, Lebanon, Ecuador, and Argentina saw the largest defaults amid deepening fiscal pressures.
Harris is just another free-spending politician who will eventually lead the US into default. But at least Harris/Walz exude joy.
At least Harris/Walz haven’t adopted (stolen) the phrase “Work makes one free”.
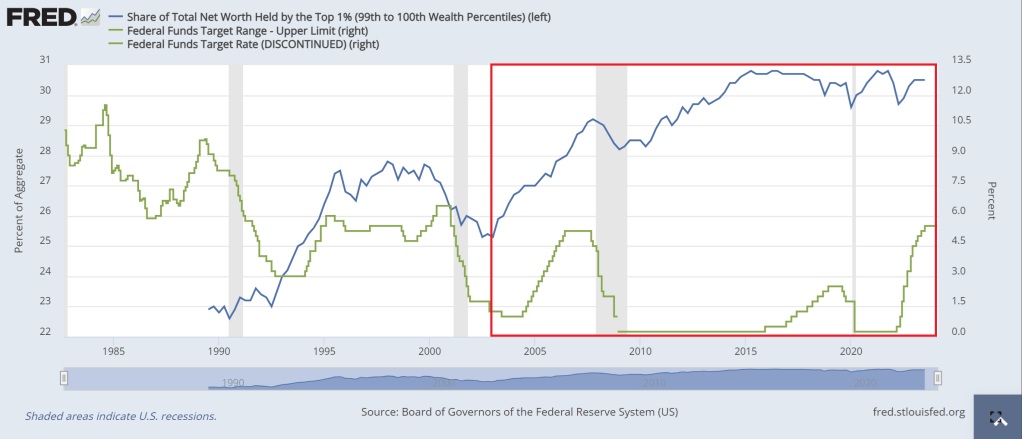
An example of the Sisyphus economy? The top 1% of earners (blue line) have seen an incredible increase in net worth, particularly after Fed Chair Alan Greenspan’s big rate cuts (green line) from 2000 to 2004. Each subsequent rate cuts under Bernanke (2007-2008) and Yellen (who just kept rates too low for too long). The end result? In the red box, the top 1% made out like bandits.
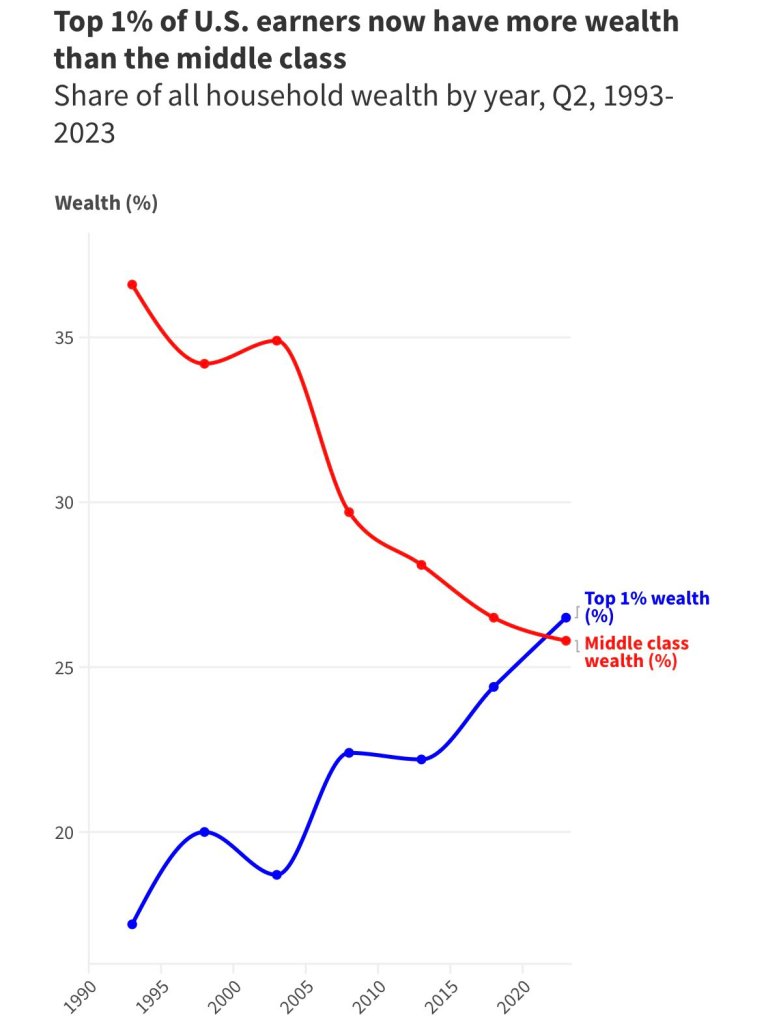
The end result? The top 1% of earners now have more wealth the the middle class.
Of course, asinine Federal government policies (like open borders and making donors wealthy with green energy spending) and the lack of a serious approach to corruption have complicated matters.
So the working class, middle class and low wage workers, are the ones pushing the boulder up a hill while government insiders like Biden make millions through influence peddling. So, unlike the Sisyphus legend, the middle class and low wage workers are being punished by simply existing.
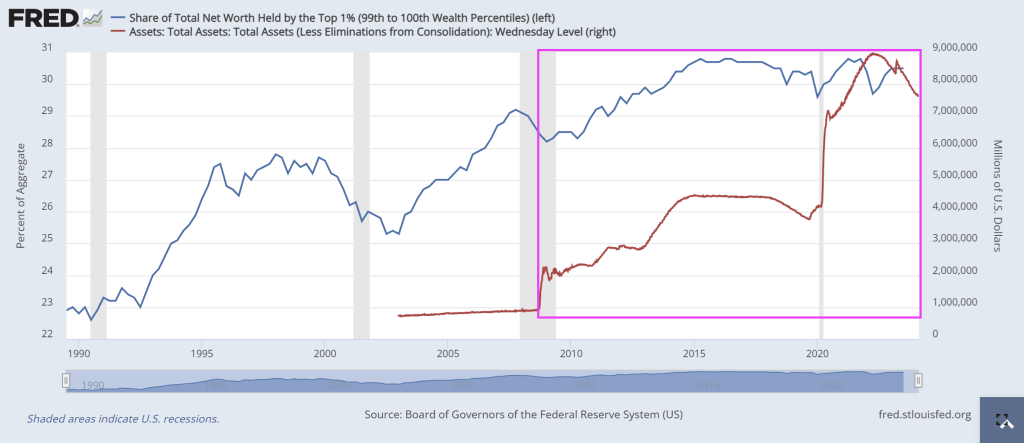
The Fed’s balance sheet has had a similar effect, particularly since the financial crisis of 2007-2008 when The Fed truly became unhinged under Janet Yellen. So of course, Yellen was made Secretary of Treasury, the largest honey pot in the world, so she could continue growing the elites power while minimizing the wealth of all others.
Should we end The Fed? Of course! But we can’t even have a rational discussion on why we are funding a war in Ukraine (to protect their border?) while we leave our borders open to invasion?
Here is one of the 1% who made a fortune by simply having a big mouth and being in politics.


You must be logged in to post a comment.