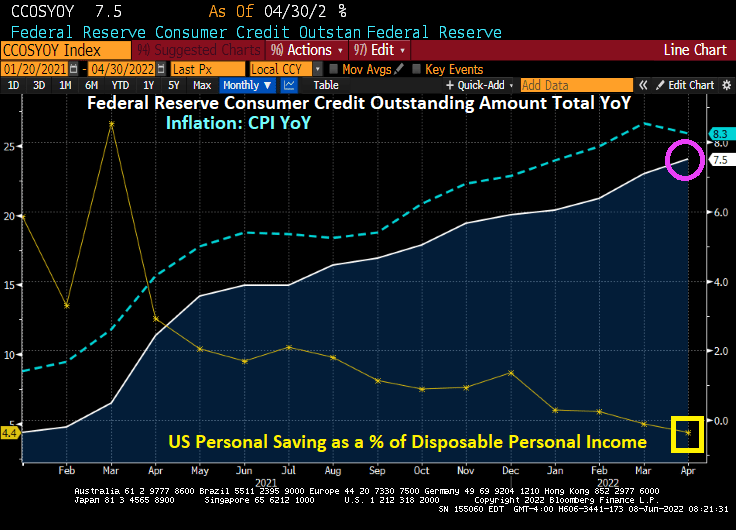
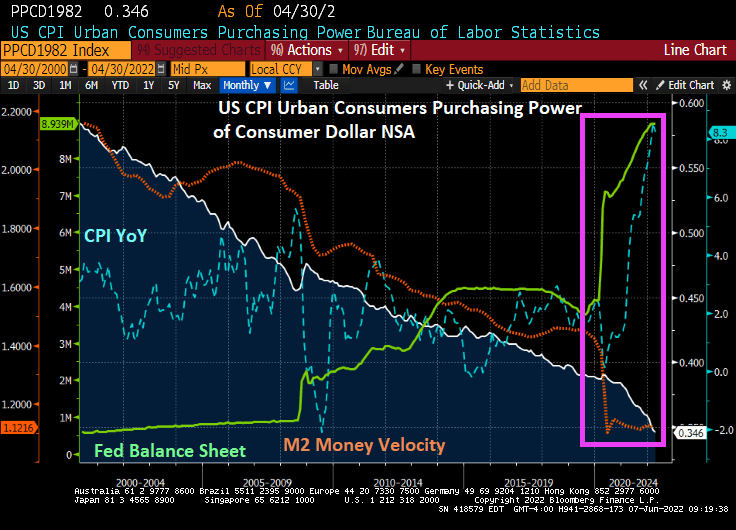
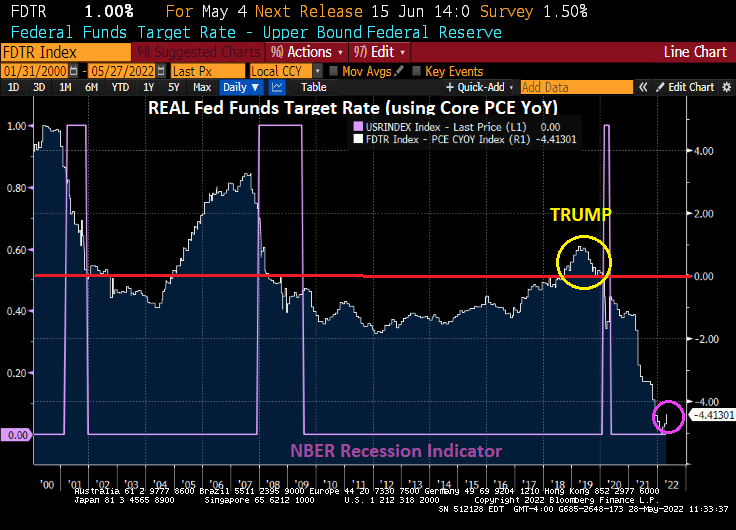
The Federal Reserve is making up for Bernanke and Yellen’s “too slow to remove” Fed stimulus policies (QE1 – QE3) and Powell’s Covid-related QE4. Now The Fed is trying to remove the stimulus in a (misguided) attempt to cool inflation. Remember, the dramatic rise in prices was caused by more than Fed stimulypto, it was also caused by Biden’s executive orders driving up oil, gasoline and natural gas prices and the massive Federal spending bills signed by Biden.
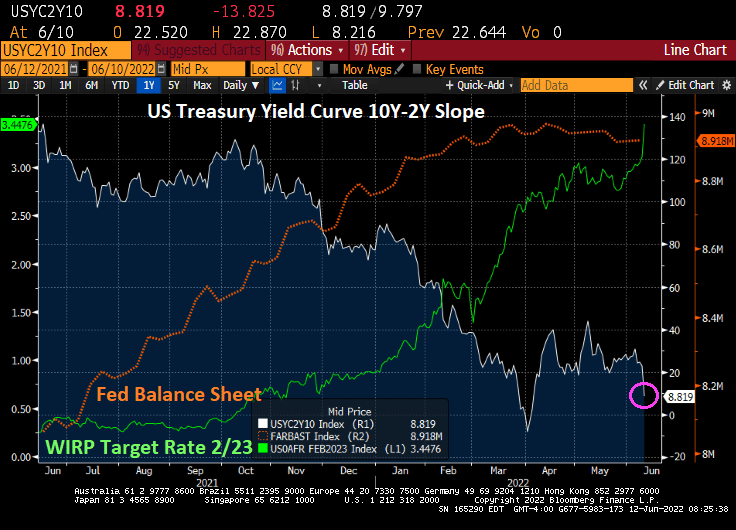
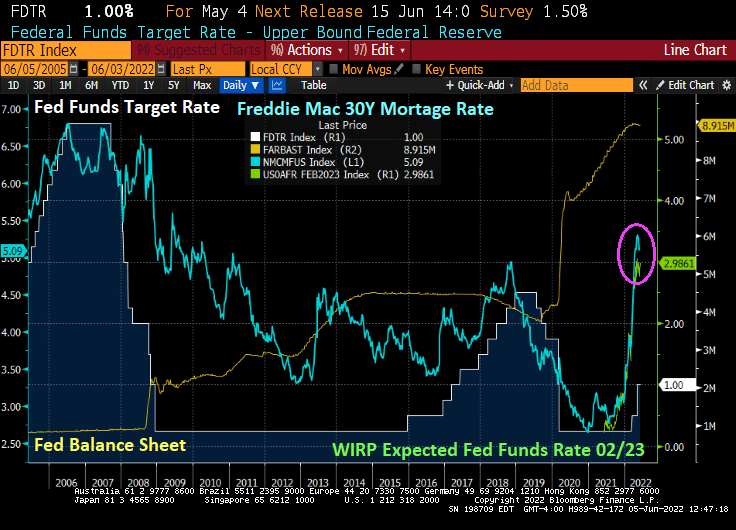
The result of The Fed’s jawboning about undoing Fed stimulypto is take away the punch bowl. But the results are troubling. Both the total return indices for US Treasuries and Agency Mortgage-backed Securities (MBS) have declined dramatically since inflation has been rising (highest in 40 years) and The Fed is expected to crank their target rate by February 2023 to 3.448% (The Fed Funds Target Rate currently stands at 1%). That is almost a 250 basis point rise in the target rate in 8 months.

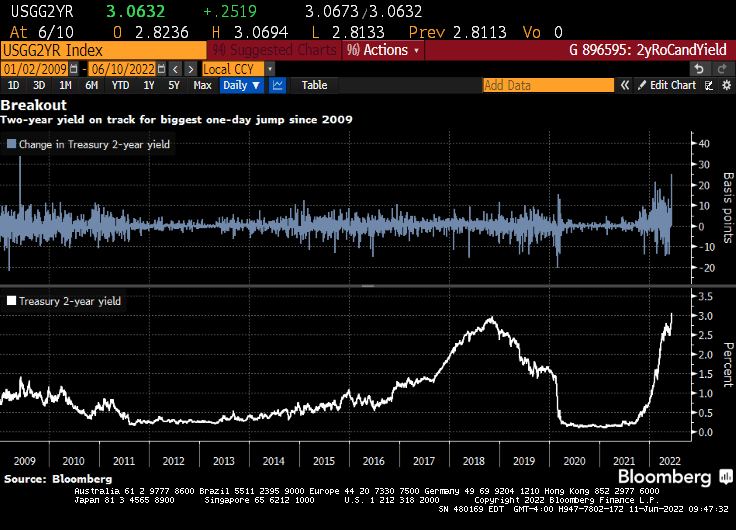
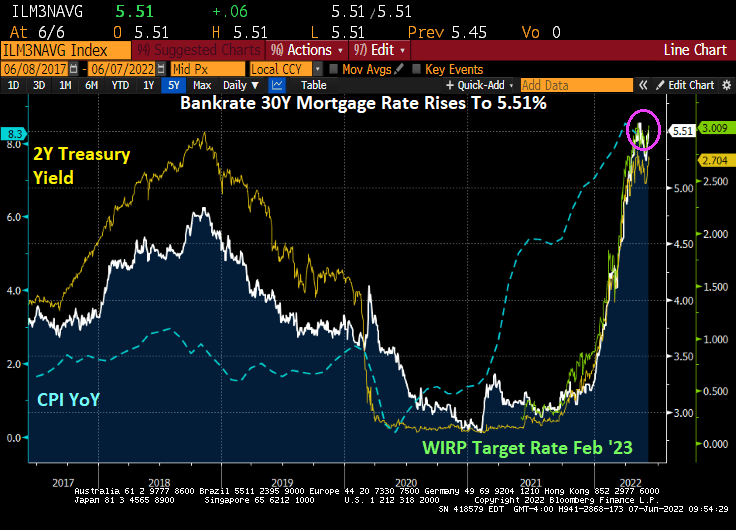
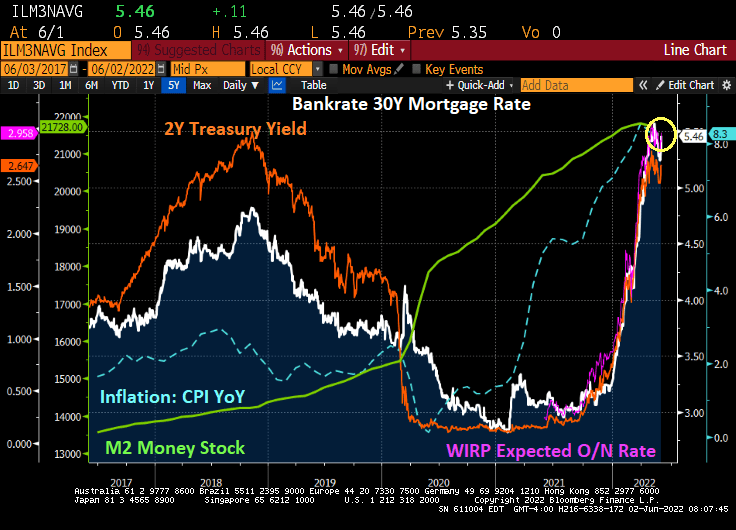
While the 10-year rate is rising rapidly, the 2-year Treasury yield is REALLY rising fast.

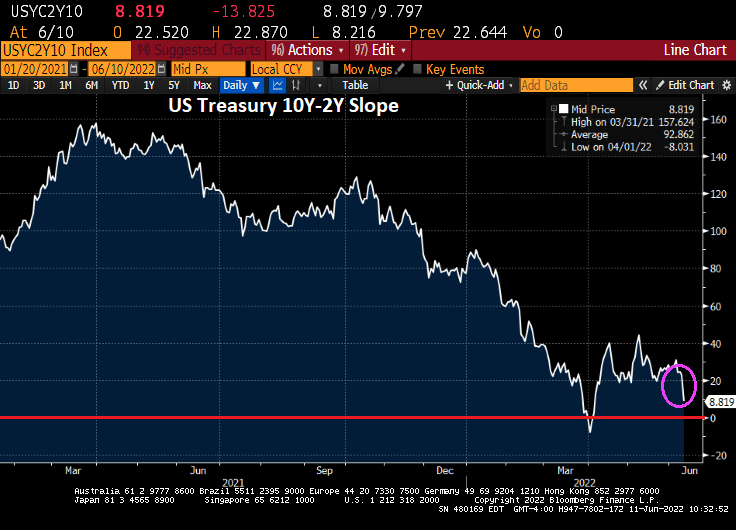
And the yield curve (10Y-2Y) is down to +8.819 basis points as The Fed signals tightening.
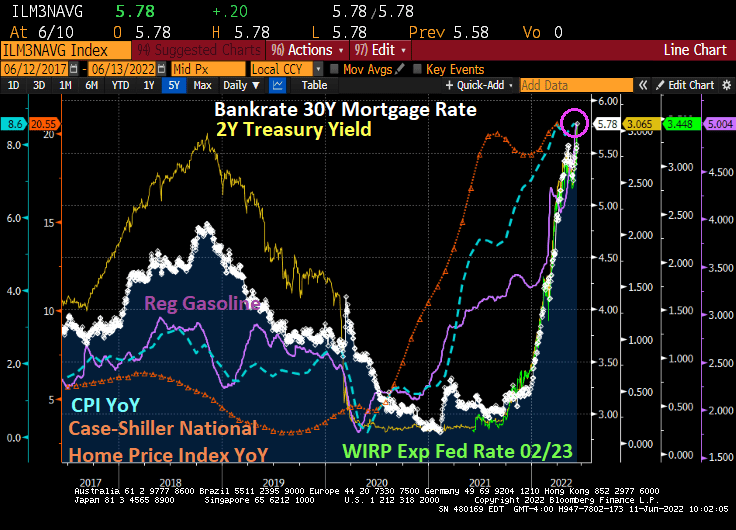
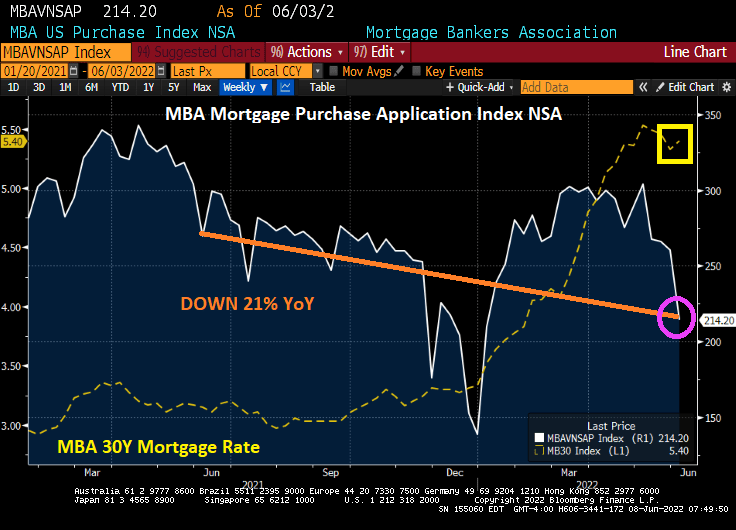
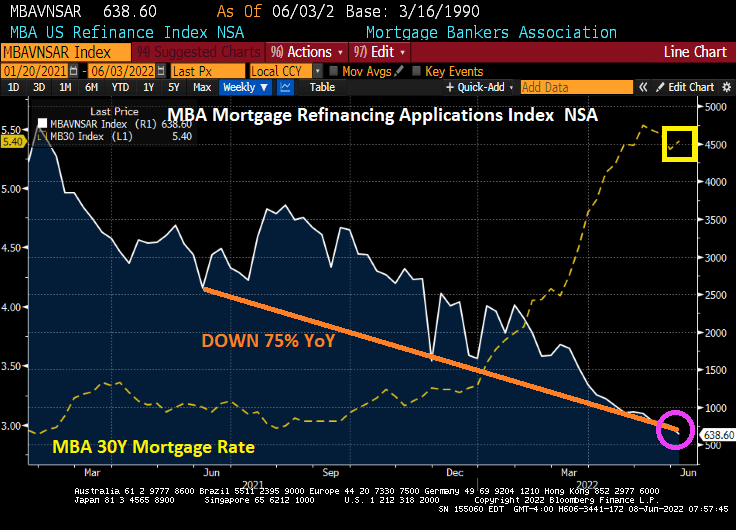
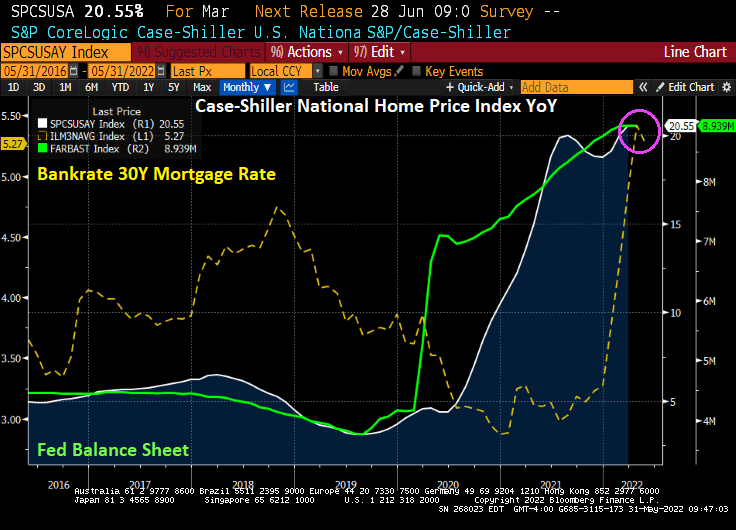
And with rising 10 and 2Y Treasury yields, we are seeing the fastest rise in mortgage rates since 1981.


You must be logged in to post a comment.