Russia and Brazil are tightening along with Mexico, Colombia, Peru, Argentina and Chile. Add Pakistan, The Czech Republic and Poland to the list of tighteners.
The looseners? The US, of course, with Canada, Australia, China, India, Western Europe, Turkey and Nigeria. New Zealand is the quickest loosener.
This looks very cold war-like. But a monetary cold war.
Let’s see if The Fed becomes a tightener rather than a loosener.
As The Federal Reserve tries to drain-off the extraordinary growth in its balance sheet since COVID without raising its target rate (good luck with that!), it is time to appraise where we are sitting. First, liquidity.
(Bloomberg) Buying and selling large quantities of U.S. government debt without substantially moving the market is about the hardest it’s been since the pandemic sent markets reeling in March 2020. Volatility has jumped, failed trades have increased — and Wall Street analysts warn that the Federal Reserve’s exit from bond-buying is set to make matters worse.
When markets seized up last year, liquidity in most Treasuries vanished, forcing the Fed to embark on massive asset purchases and other measures to avert a full meltdown. Now, the U.S. central bank is scaling back that buying, which has targeted the least-liquid Treasuries, and is poised to quicken the wind-down. At the same time, new government borrowing is ebbing, with the combination setting the stage for more fireworks.
OK, liquidity isn’t as bad as COVID and March 2020, but it is near the highest level since March 2020. The question is … will the numerous asset bubbles around the globe burstLet’s look at the ongoing saga of Chinese conglomerate Evergrande (mainly known as a large real estate developer). Their 8.25% bond has plunged to $23.481 on speculation of a catastrophic default on their bond payments. Then we have Invesco’s Golden Dragon China ETF (measuring a diversified market cap of US-listed companies headquartered or incorporated in China & derive a majority of their revenues from the People’s Republic of China). This ETF has crashed and burned back to pre-COVID (and Stimulytpo) levels.
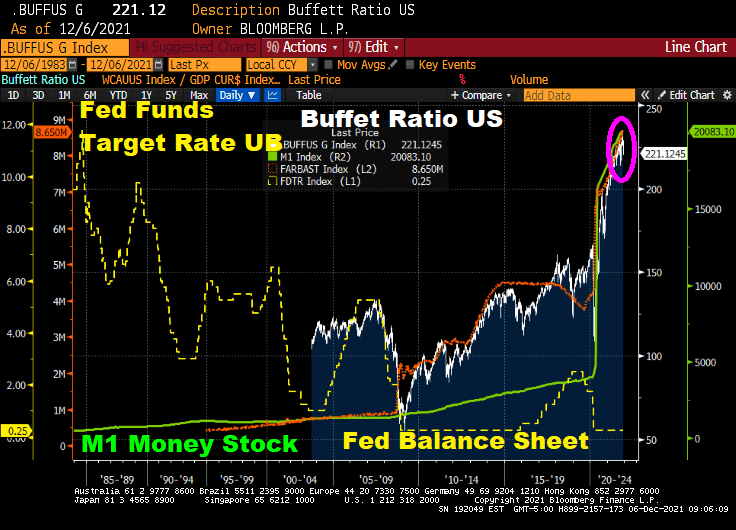
Speaking of cracks, how will the Buffett Ratio US react to a reduction in The Fed’s balance sheet (orange line) and M1 and M2 Money stock? Given that the Fed Funds target rate is WAY below where it should be (according to the Taylor Rule).
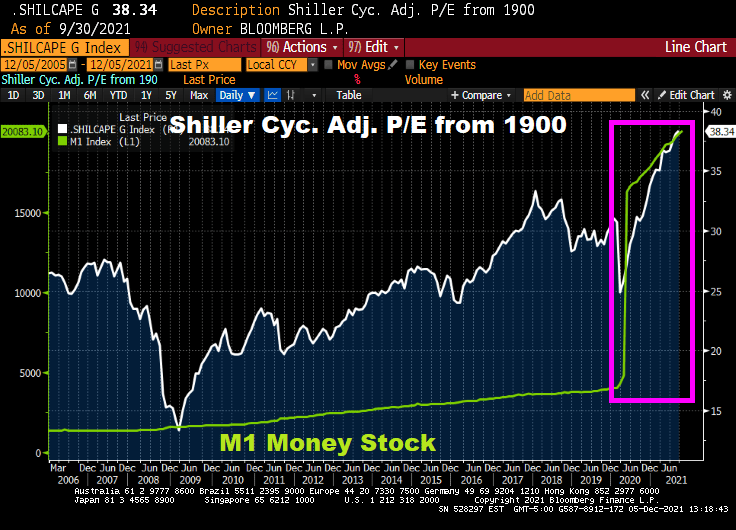
As I mentioned yesterday, the Shiller CAPE ratio is at its highest level since the Dot.com debacle of 2000. How will the Shiller CAPE ratio react to The Fed’s tapering?
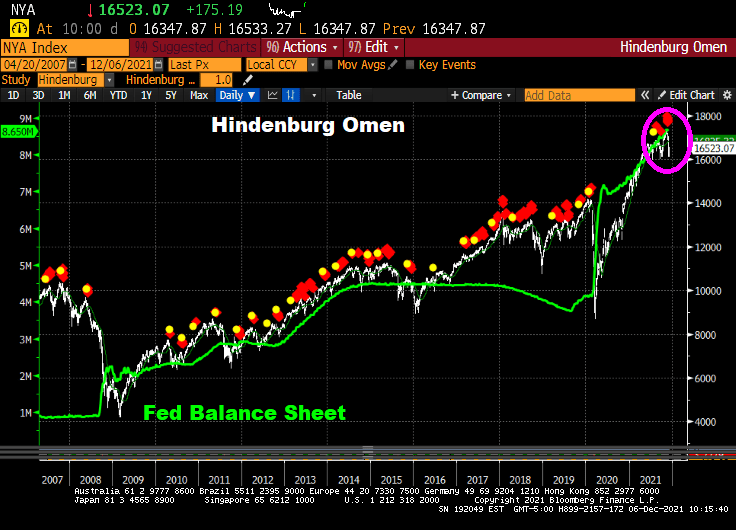
Even the Hinderburg Omen is flashing red … again.
Now, the Dow is up 600 points today, primarily on the news that the Omicron Variant is about as harmful as the common cold.
A major shift is underway at the Federal Reserve to begin to remove the central bank’s massive pandemic easing policies, and could see it hike rates sooner than is priced in by markets.
Comments by Fed officials suggest the central bank is likely to decide to double the pace of its taper to $30 billion a month at its December meeting next week. Initial discussions could also begin as soon as the December meeting about when to raise interest rates and by how much next year with Fed officials set to submit a fresh round of economic forecasts and projections for the fed funds rate.
There is no consensus yet on when to begin hikes, but it’s clear that the faster taper is designed to give the Fed flexibility to raise rates as soon as the spring. The markets do not appear to expect the first rate hike until the summer of 2022.
Uh-huh. Let’s see what happens when and if The Fed starts to taper. Is economic growth so strong that it can continue without Federal Stiumulypto? THAT is the right question.
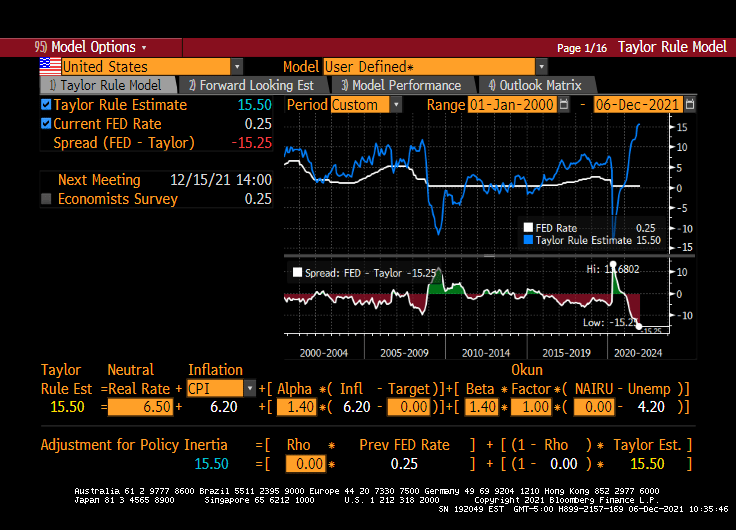
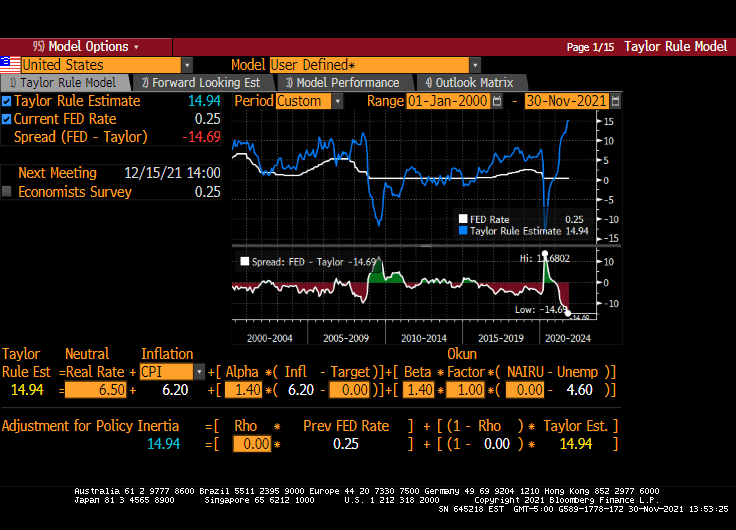
Look at the above charts and tell me if The Fed will actually raise their target rate more than twice. Despite the Taylor Rule suggest a target rate of 15.50% to cool inflation.
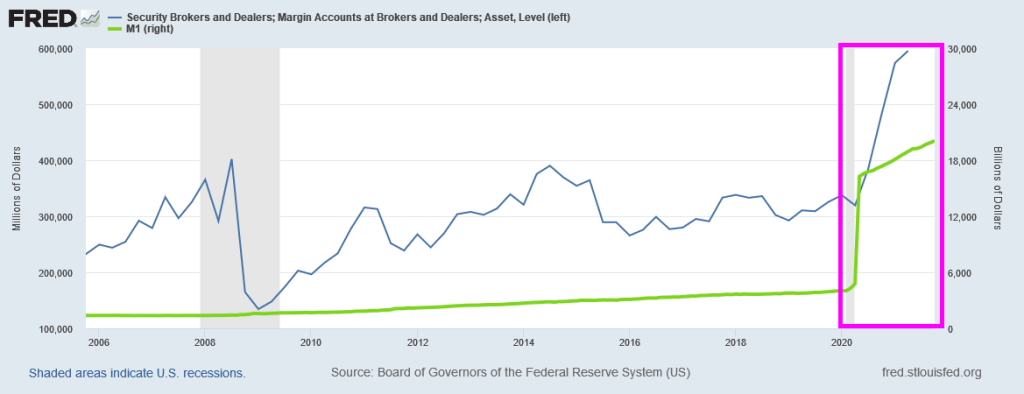
As we are all painfully aware, The Federal Reserve went on a 2nd money printing spree to allegedly stave-off the economic impacts of the COVID outbreak in March 2020. The first money printing spree took place in late 2008 as The Fed tried to stave-off the economic impacts of the housing bubble burst of 2008 and the ensuing financial crisis.
But for now, we have this horrifying chart showing the exploding margin accounts at security brokers and dealers (not, not the Walter White-type dealers, but Wall Street dealers). Notice the 400% surge in M1 Money stock after COVID struck.
Of course, the soaring stock market is feeding the margin loop, encouraged by The Fed. Check out the Shiller Cyclically Adjusted Price Earnings (CAPE) ratio after The Fed’s M1 printing storm.
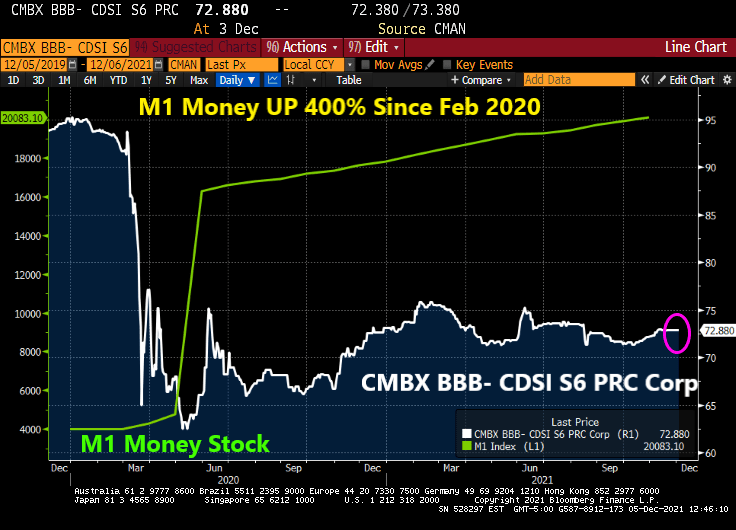
What can’t money printing fix? How about CMBS prices (or CMBX BBB- S6 prices … down 30.5% since just before COVID struck.
Let’s see if The Fed sucks the 400% growth back to zero.
Treasury Secretary Janet Yellen said yesterday that “It’s Fed’s Job to Avoid Any Wage-Price Spiral.” Well, The Fed is helping to avoid a wage increase in real terms, since the November jobs report revealed that REAL US Average Hourly Earnings growth YoY fell to -1.378%. In other words, inflation is greater than hourly earnings.
And in other jobs related news, nonfarm payrolls rose by only 210k versus expectations of 550k jobs to be added. Even NOMINAL hourly earnings growth (4.8% YoY) was less than expected (5.0%).
Labor force participation rose a bit to 61.8%, still well below the pre-COVID levels of 63.4% in January 2020.
The U-3 unemployment fell to 7.8%. Still higher than the pre-COVID rate of 7.0% in February 2020, but getting close! As for what this means for The Fed, the new target rate implied by the Taylor Rule is 15.50%.
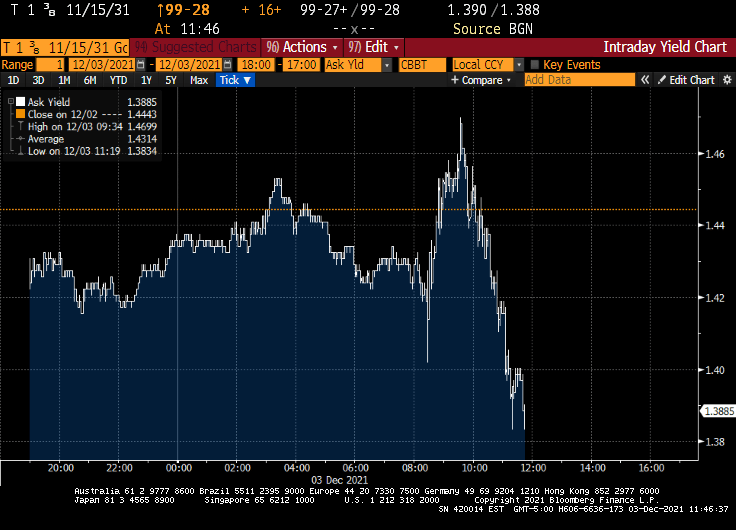
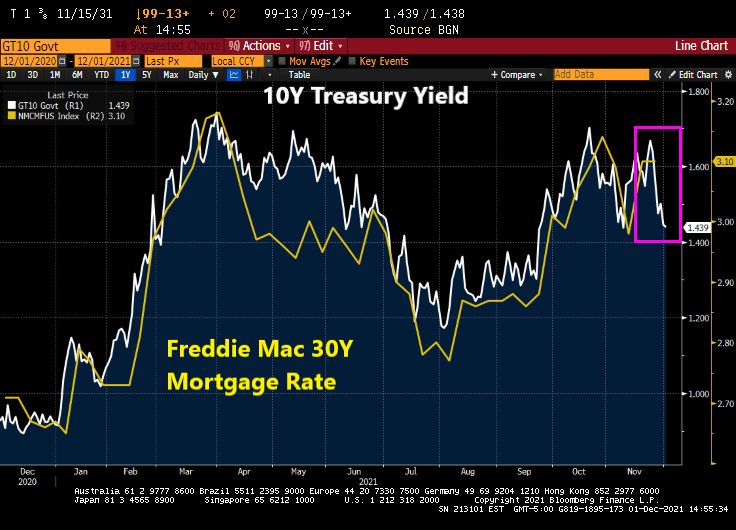
After this lousy jobs report, 10-year Treasury yields dropped … like Biden’s approval ratings.
The Dream Team (Fed Chair Jay Powell and Treasury Secretary Janet Yellen) just can’t believe that inflation struck even after M1 Money Stock increased by 369% from March 2020 to today while interest rates remained near zero.
From The Hill: Federal Reserve Chairman Jerome Powell and Treasury Secretary Janet Yellen on Wednesday said they underestimated how quickly the U.S. economy would rebound from the COVID-19 recession and strain supply chains.
During a Wednesday hearing before the House Financial Services Committee, the top two U.S. economic policymakers acknowledged that high inflation has risen higher and lingered much longer than they expected.
“We understood demand would be strong,” Powell said. “We didn’t understand [the] significant problems of the supply side.”
Both Yellen and Powell said substantial fiscal and monetary stimulus played a role in stoking the higher demand that fueled inflation, but they called it a challenging side-effect of an otherwise fast recovery.
Seriously? The Fed and the Federal government dumped trillions of dollars into an economic system and didn’t think there would be negative consequences??
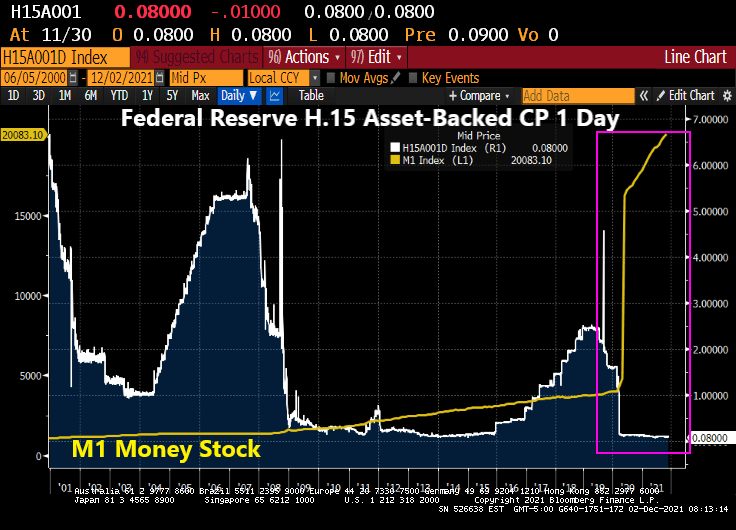
Look at the surge in M1 Money Stock at the same time asset-backed commercial paper rates are 0.08%. That is, about 1/3rd The Fed Funds Target rate (upper bound). None of this concerned The Dream Team?
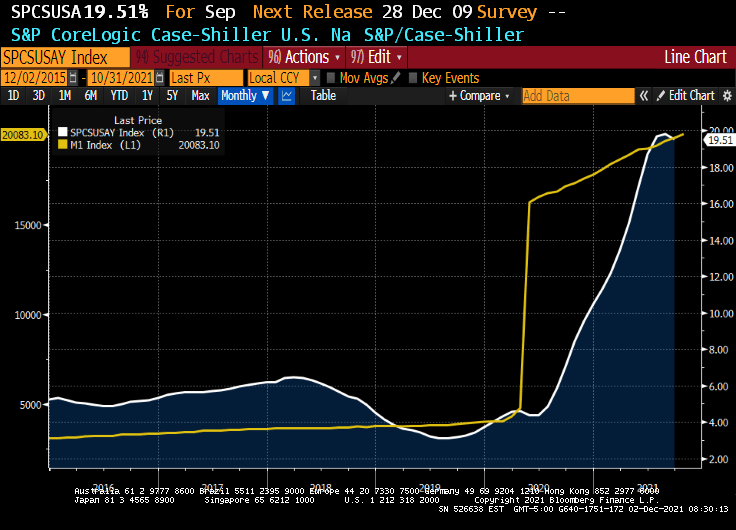
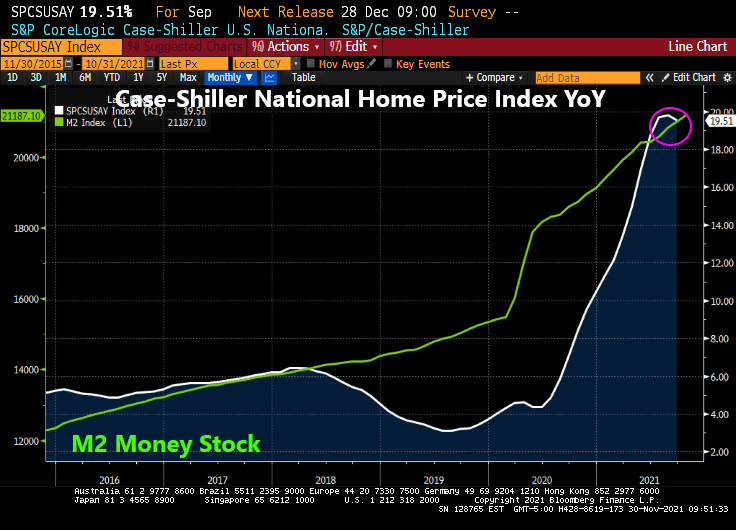
An example of what The Dream Team didn’t see happening was the explosion of home prices. Home price growth was about 4% YoY prior to COVID, and is now 19.51% YoY.
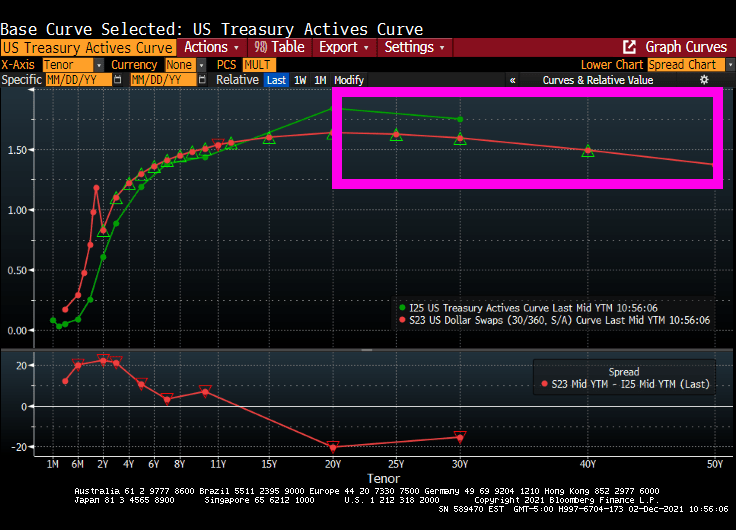
Now we have the US Treasury Actives curve inverting like the US Dollar Swaps curve after 20 years.
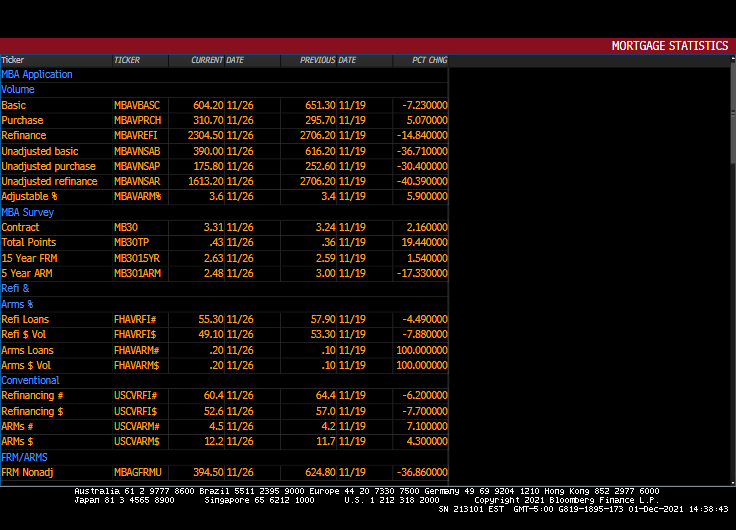
Its that time of year for mortgage purchases applications! Purchase applications usually decline during December and start to rise after the beginning of the year.
Mortgage purchase applications (white line) dropped -30.4% from the previous week, not usual for December. But what is surprising is the drop in REFINANCING applications: down -40.3% from the previous week.
30-year mortgage rates rose 2.16% from the previous week.
But between Omicron (or as the French say, “Oh! Macron!”) and The Federal Reserve, there is a good chance that mortgage rates will fall this week putting a quick end to refi application plunge.
Purchase applications? Nope, it is that time of the season when purchase applications drop like a rock.
Calamity Jay Powell is no longer mentioning “transitory” when it comes to inflation, but does Powell and the FOMC have the moxie to ACTUALLY raise rates more than a smidge??
(Bloomberg) — Team Transitory is throwing in the towel.
In a clear sign that the Federal Reserve is shifting to tighter monetary policy, Jerome Powell — who’s spent months arguing that the pandemic surge in inflation was largely due to transitory forces — told Congress on Tuesday that it’s “probably a good time to retire that word.”
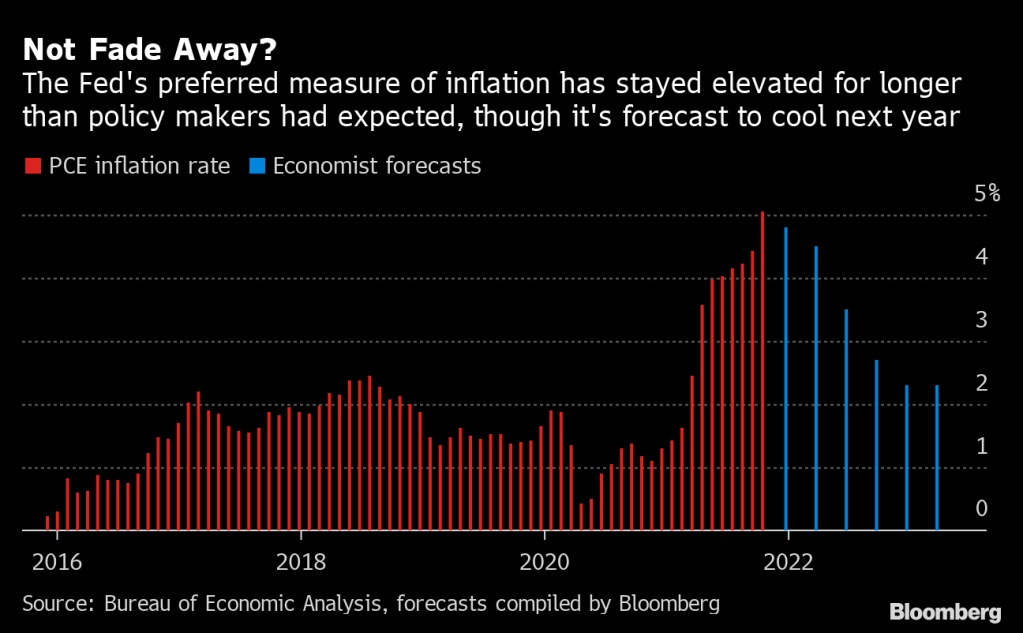
The Fed chair, tapped last week for another four-year term, still thinks inflation will ebb next year.
But in testimony before the Senate Banking Committee, he acknowledged that it’s proving more powerful and persistent than expected, and said the Fed will consider ending its asset purchases earlier than planned.
A number of economists are forecasting cooling inflation next year, which gives Powell an excuse to NOT raise rates, other than just a bit.
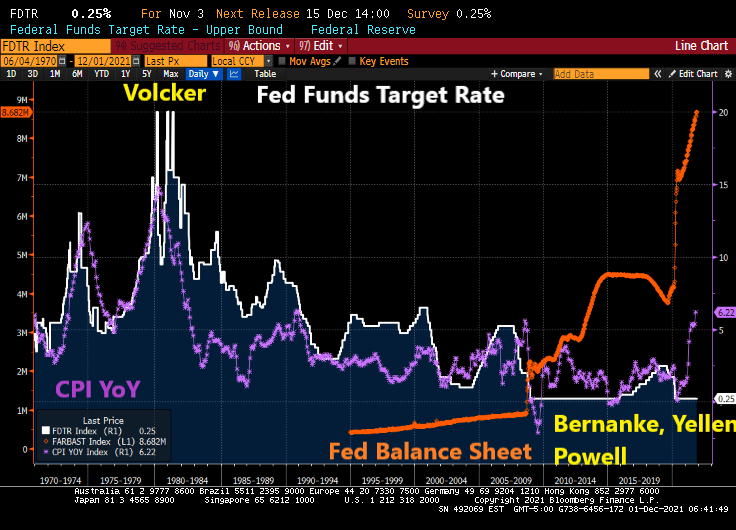
For a little history, inflation was rampant in the 1970s and early 1980s. Fed Chair Paul Volcker, all 6’7 of him, raised the Fed Funds target rate (white line) to 20% on several occasions. The result? Inflation cooled from over 14% in 1980 to 2.46% by 1983. But since 2008, Fed Chairs Bernanke, Yellen and Powell have been the ANTI-Volckers … keeping the Fed Funds Target rate near zero for the the most part and adopted their gut-wrenching quantitative easing programs that are still here today.
Of course, Powell could do what Volcker did (and the Taylor Rule suggests) and raise their target rate to 15% to cool inflation.
But does Powell and the other FOMC members have the moxie to really cool inflation? Frankly, no. Powell until yesterday played the TRANSITORY card and still believes that inflation will cool by 2022.
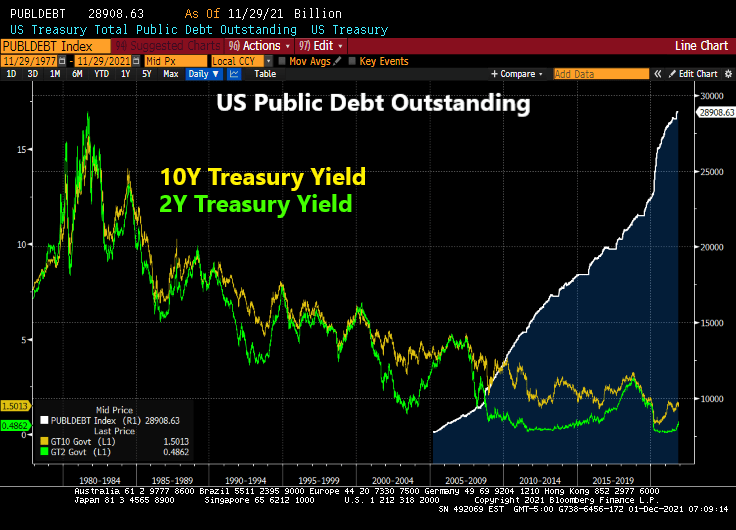
True, the Federal government has binged on borrowing (up 172% since January 2009). And with Biden and Congress trying to spend trillions more (much of which will be added to the public debt rolls, so increasing interest rates ala Volcker is very problematic.
And then there is always the good ‘ole excuse not to raise rates if needed. Other than admitting that The Fed is monetizing Federal government spending to which there is no end in sight.
Calamity Jay Powell testified in front of the US Senate Banking Committee. He rattled markets by going hawkish about inflation, then gave The Fed an out by playing the COVID CARD (the latest Omicron Variant). Aka, the DEATH CARD.
Federal Reserve Chair Jerome Powell said the strong U.S. economy and elevated inflation could warrant ending the central bank’s asset purchases sooner than planned next year, though the new omicron strain of Covid-19 poses a fresh risk to the outlook.
“It is appropriate, I think, for us to discuss at out next meeting, which is in a couple of weeks, whether it will be appropriate to wrap up our purchases a few months earlier,” Powell said Tuesday. “In those two weeks we are going to get more data and learn more about the new variant.”
Powell made the comment in response to questions during a Senate Banking Committee hearing in Washington. The Fed is currently scheduled to complete its asset-purchase program in mid-2022 under a plan announced at the start of November; policy makers next meet Dec. 14-15, where they could make a decision to accelerate the tapering.
On his remarks, the stock market puked.
Well, if Powell followed the Taylor Rule, he would really scare Congress with raising The Fed Funds Target Rate to 14.94% based on an inflation rate of 6.20%.
And then we have HOUSE price inflation of near 20%. But The Fed doesn’t consider than inflation.
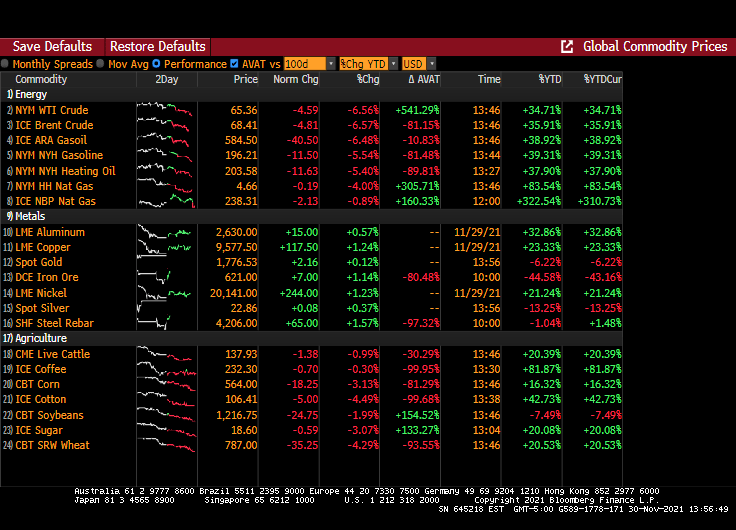
Then we have oil prices retreating -4.59%. Not, not due to Biden releasing the National Petroleum Reserve (NPR). Rather it is FEAR of The Fed raising rates and a corresponding slowdown in economic growth.
Once again, low available inventory of houses for sale coupled with outlandish Fed stimulus has resulted in a housing crisis where home price growth (+19.51%) exceeds hourly wage growth (+5.76%) by almost 4x.
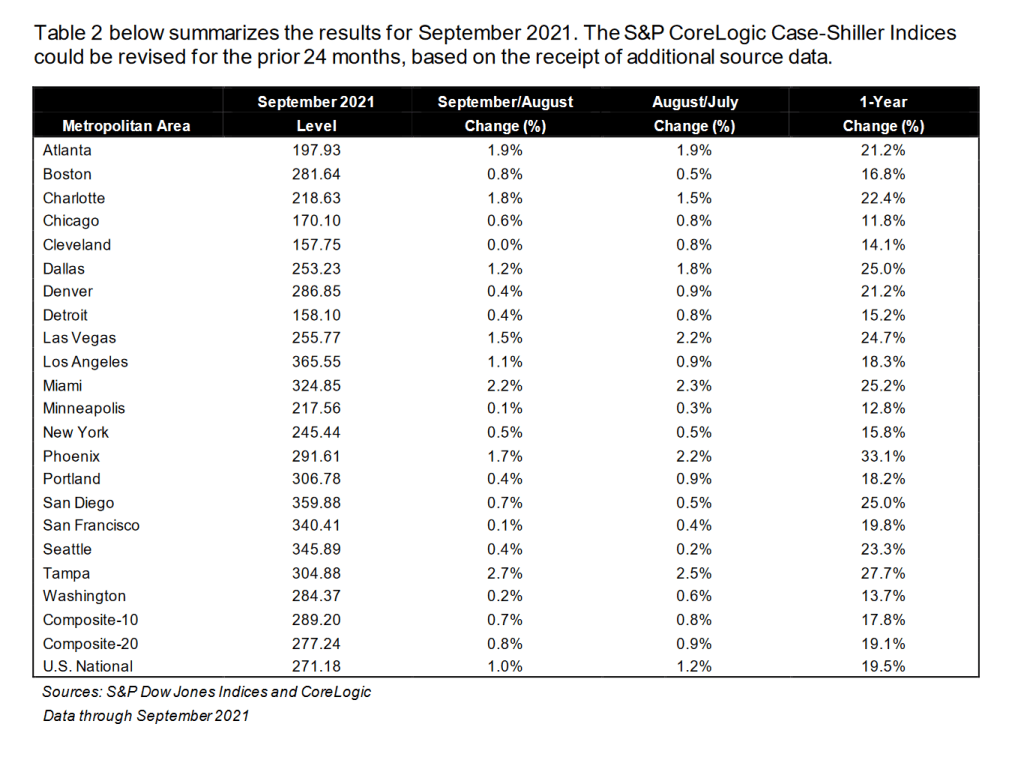
Where are all the home prices above 10% YoY? Every one of the 20 metro areas covered by Case-Shiller. Phoenix AZ leads at +33.1%. Chicago IL is the “slowest” at 11.8%.
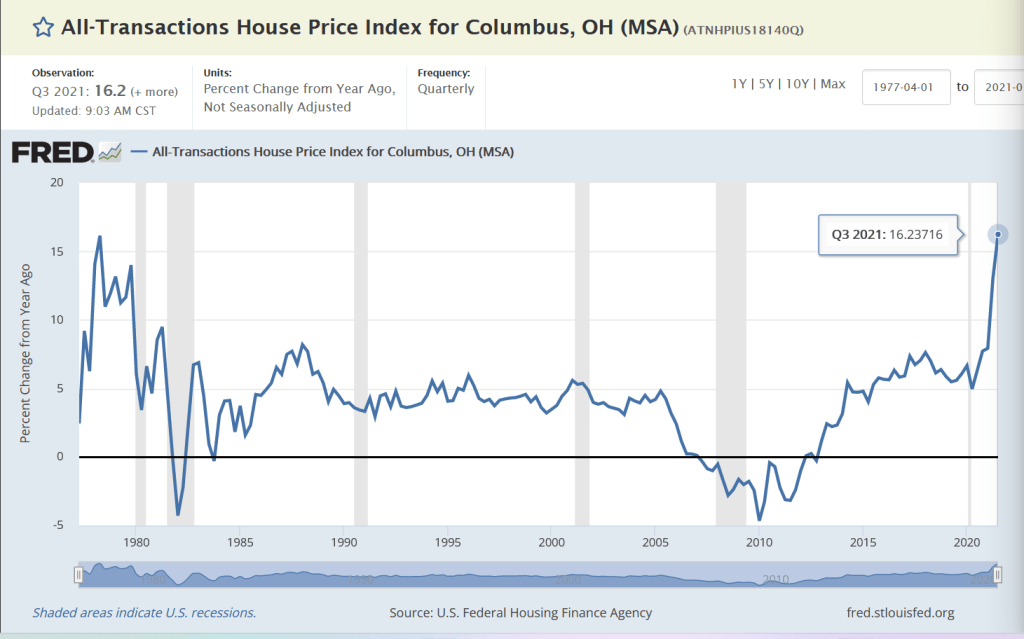
Although Columbus OH is the growth hub of the state, Case-Shiller only reports Cleveland. So here is Columbus’s all-transactions home price growth for Q3: +16.2% YoY placing Columbus at the top of the midwest metro areas of Detroit, Chicago, Minneapolis and Cleveland.
With the latest Omicron Variation (sounds like a Star Trek TV show episode), I will bet that The Fed will stay a little longer and keep rates low, leading to home price growth (with limited available inventory) to continue to grow at double digit speeds.
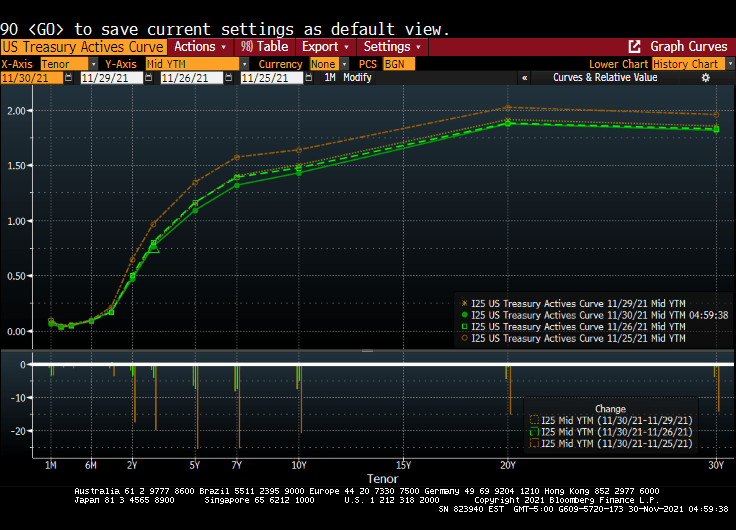
The latest scare hitting financial markets is the Omicron Variant (or Oh! Macron! Variant in France). While it caused an initial decline in global equity markets {Dow fell 900 points on early reports on Omicron), the Treasury market has been relatively unscathed.
For example, the US Treasury Actives curve dropped last Friday (the orange line represents the Wednesday before Thanksgiving), while the remaining three lines represent last Friday, Monday and Tuesdays (today). In other words, the US Treasury Actives curve has been quiet so far this week after Friday’s flattening.
The US Dollar Swaps curve shows the same dynamics. The dark blue line is last Wednesday, while the remaining lines are last Friday, this Monday and today. Not a lot happening after the initial Omicron fear factor was priced in.
Federal Reserve Chairman Jerome Powell believes that the omicron variant of Covid-19 and a recent uptick in coronavirus cases pose a threat to the U.S. economy and muddle an already-uncertain inflation outlook.
“The recent rise in COVID-19 cases and the emergence of the Omicron variant pose downside risks to employment and economic activity and increased uncertainty for inflation,” Powell said in remarks he plans to deliver to Senate lawmakers on Tuesday. “Greater concerns about the virus could reduce people’s willingness to work in person, which would slow progress in the labor market and intensify supply-chain disruptions.”
Do I detect FEAR in Powell’s voice? The odds of rate increases for next year just fell to one rate increase at the September 2022 meeting.
On the equity side, it seems to be all about whether The Fed will withdraw its support. Back in early 2018, then Fed Chair Janet Yellen and the FOMC started to shrink the Fed balance sheet (green line). This resulted in the “Smart Money Index” declining. The S&P 500 index received a jolt with the Fed stimulus around the COVID outbreak and have taken off like a jackrabbit. Despite the Smart Money Flow index being lower than in 2017.
So, is Omicron the “planet killer” or just another mild flu-like outbreak? The data is pointing towards the latter, but FEAR may cause it to be a bigger deal than is warranted.


You must be logged in to post a comment.