US Housing Starts Surge Most Since 2016, Exceed All Estimates (The Pause That Refreshes As Fed Dot Plots Suggest Return Of Zorp [Zero Outrageous Rate Policies!)

Well, not really unexpected since the housing sentiment index for home builders was above 50 yesterday. But with The Fed pausing rate hikes, housing starts are soaring!

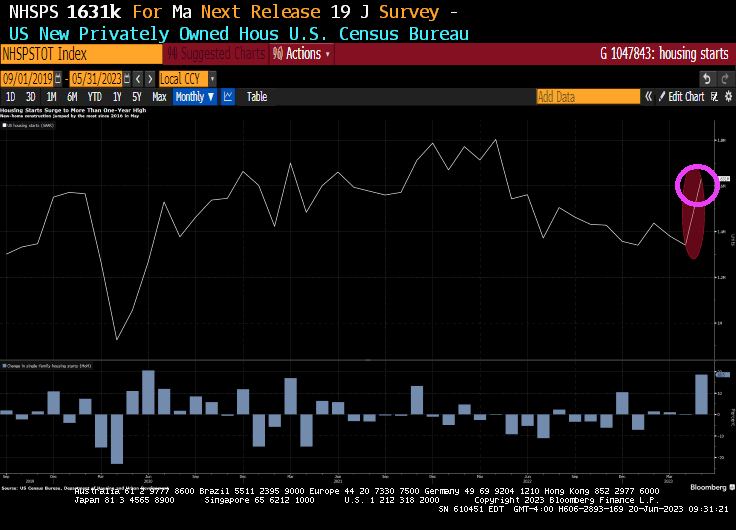
US housing starts unexpectedly surged in May by the most since 2016 and applications to build increased, suggesting residential construction is on track to help fuel economic growth.

Beginning home construction jumped 21.7% to a 1.63 million annualized rate, the fastest pace in more than a year, according to government data released Tuesday. The pace exceeded all projections in a Bloomberg survey of economists. Single-family homebuilding rose 18.5% to an 11-month high.

Applications to build, a proxy for future construction, climbed 5.2% to an annualized rate of 1.49 million units. Permits for one-family dwellings increased.

MetricActualEst.
Housing starts (SAAR)1.63 mln1.4 mln
One-family home starts (SAAR)997,000na
Building permits (SAAR)1.49 mln1.425 mln
One-family home permits (SAAR)897,000na

The figures corroborate Federal Reserve Chair Jerome Powell’s comments last week that the housing market has shown signs of stabilizing. Homebuilders, which are responding to limited inventory in the resale market, have grown more upbeat as demand firms, materials costs retreat and supply-chain pressures ease.

The housing starts data will feed into economists’ estimates of home construction’s impact on second-quarter gross domestic product. Prior to the report, the Atlanta Fed’s GDPNow forecast had residential investment subtracting about 0.1 percentage point from gross domestic product. Homebuilding last contributed to growth in the first quarter of 2021.

At the same time, elevated mortgage rates are crimping affordability, suggesting limited momentum in housing demand. 

The increase in starts from a month earlier was the biggest since October 2016 and reflected gains in three of four US regions. Starts of apartment buildings and other multifamily projects jumped more than 27%.

The number of homes completed increased to a 1.52 million annualized rate. The level of one-family properties under construction were little changed at 695,000.

Existing-home sales data for May will be released on Thursday, while a report on new-home purchases is due next week.

Now only has The Fed paused, but the most recent Fed Dots Plot reveals that Fed open market committee (FOMC) members see The Fed slashing rates over the coming years. Just in time for creepy, demented Grandpa Joe to be reelected as President. In other words, the return of ZORP (zero outrageous rate policy).

Maybe The Fed should adopt the Coca Cola slogan “The Pause That Refreshes!”

US Housing Starts Decline -17.2% YoY (11th Straight Month Of Negative Growth), But 1-unit Starts Up 2.74% MoM In March As Fed Removes Covid Stimulus

It’s springtime for housing! But winter for the mortgage market.

US housing starts have declined in March by -17.2% since the same time last year (YoY) as The Fed rapidly removes Covid-related monetary stimulus (green line).

On the positive side, 1-unit detached housing actually rose by 2.74% from February to March (MoM). However, 5+ unit (multifamily) starts decline -6.71% MoM. Permits are similar: 1-unit permits were up 4.07% in March from February while 5+ unit permits were down -24.27%.

Housing starts out west were down -28.13% MoM as people are escaping “Gruesome Newsom Land” (aka, California). Starts are up by 6.8% MoM in The South.

“Hey Aunt Nancy, do you think American voters will vote for me for President after I helped destroy California? Can I be President and spend like a mad man like you did as Speaker of the House??”

Alarm! US New Homes Sales DOWN -19% Since Last Feburary (Median Sales Price DOWN -8.18% Since Dec 31, 2022)

Alarm!

New home sales rose 1.11% since January and is down -19% since last February (YoY).

The median price of new home sales is down a whopping -8.18% since December 2022. And average price is down -12.83%.

US Housing Starts Plunge -21.8% Since Last December (But 1 Unit Starts UP 11.26% Since November)

December’s housing construction numbers are a mixed bag. On the one hand, US housing starts are down -1.36% from November to December, but down -21,8% since December 2021 (YoY).

The good news? 1-unit (single family detatched) rose 11.26% from November to December (MoM). But 5+ (multifamily) starts are down -18.91% MoM.

But 5+ unit PERMITS are up 7.14%. Perhaps Hunter Biden can now rent an apartment rather than pay his father $50,000 a month in rent for Joe’s Wilmington Delaware house.

KB Homes experienced a 68% cancellation rate in Q4 2022.

This version of The Scream is one of four made by Edvard Munch, and the only one outside Norway. It is coming up for auction at Sotheby’s in New York.

US New Home Sales Rose 5.8% MoM In November, But DOWN -15.3% YoY For The Ninth Straight Month (M2 Money Is Vanishing)

A classic good news, bad news story. The good news? US new home sales rose 5.8% in November, better that the expected -5.1%, The bad news? On a year-over-year basis, US new home sales FELL

Sales of new US homes unexpectedly rose in November, suggesting some stabilization in demand as mortgage rates eased late in the month from their highs.

Purchases of new single-family homes increased 5.8% to an annualized 640,000 pace last month after rising in October, government data showed Friday.

A mid-month retreat in 30-year mortgage rates back below 7% along with an increase in builder incentives may have helped support demand. Still, the sales data are volatile from month to month. With home prices remaining elevated and the Federal Reserve poised to raise interest rates further, headwinds for the housing market will persist into 2023.

The increase in sales last month was concentrated in the West and Midwest.

The report, produced by the Census Bureau and the Department of Housing and Urban Development, showed the median sales price of a new home was up 9.5% from a year earlier to $471,200.

There were 461,000 new homes for sale as of the end of last month, though the grand majority remain under construction or not yet started. The number of homes sold in November and awaiting the start of construction — a measure of backlogs — rose to the highest since the beginning of the year.

But for all the cheerleading, new home sales were DOWN -15.3% on a year-over-year basis. The ninth straight month of negative new home sales growth.

At least the median price of new home sales was down -2.79% from October to November.

US New Home Sales Tank -17.6% YoY In September (Declines In 15 Of Last 16 Months) As Rates Soar With Fed Tightening (Median Price Of New Homes Sold UP 7.8% YoY)

Another day, another lousy economic report under Biden.

Today, we found out that new home sales declined -11% MoM (from August to September) and fell -17.6% from last year YoY. With 603k SAAR sold.

The median price of new home sales was UP 7.8% YoY.

Here is the rest of the story as Paul Harvey used to say.

The housing and mortgage markets seem broken. Time for a new approach??

US 1-Unit Housing Starts Plunge -18.5% In September As Liquidity Grinds To A Halt (Multifamily Starts DOWN -13.11%)

Liquidity is a big deal for the housing and mortgage markets.

Unfortunately, M2 Money YoY (liquidity) is shrinking fast and 1-unit (single family detached) starts dropped -18.5% in September.

This is not surprising given the decline yesterday in the NAHB market index.

Even multifamily (5+ unit starts) were down -13.11% in September.

Powell’s Famous Chili! National Association of Home Builders Market Index Falls More Than Expected To 46 As Fed Tightens Monetary Noose (Lowest Since 2012, Excluding Covid Crash)

The National Association of Home Builders market index fell more than expected in September to 46, the lowest reading since 2012 (if I exclude the Covid economic shutdown).

Note that the NAHB market index is declining along with at the increase in the 30yr mortgage rate.

Powell Channels Mr T As Dow Drops 1,000 Points, Home Builder Index Plummets (UMich Buying Conditions For Houses Remains Near 1982 Levels)

‘‘We will keep at it until we are confident the job (i.e. killing inflation) is done.’’

Jerome Powell, Jackson Hole speech

Interviewer : What’s your prediction for the market?

Clubber Lang (Mr T) : My prediction?

Interviewer : Yes, your prediction.

[Clubber looks into camera] 

Clubber Lang : Pain!

Of course, Friday was one of those “Black Fridays” for investors. And pension funds.

The Dow Jone Industrial Average fell -1008.38 points after Powell’s “Mr T” remarks on pain. That was a whopping -3%. The NASDAQ composite index fell almost -4%.

Equity markets struggled in Europe as well, particularly the German DAX index.

The UMich Buying conditions for houses rose slightly, but remains near the lowest level since 1982.

Clubber Powell, Federal Reserve Chairman.

The Case-Shiller house price numbers are due out Tuesday for June and it is expected that they will show a significant slowing in home prices. Biden and Clubber Powell could then take “credit” for slowing “inflation.”

Meet Me At The Bottom? US Housing Starts (1-Unit) Tank -18.5% YoY In July (Down -10.11% MoM, Apartment Starts Down -10% MoM)

Meet Me At The Bottom … of the housing market?

As The Federal Reserve fights inflation (caused by too much Fed stimulus for too long) and Federal energy policies, we are seeing mortgage rates rising and the housing market decaying.

1-unit (single family detached) housing starts dropped -18.5% YoY in July as mortgage rates rose in 2022. Note the impact of the Covid stimulus (green line) and the resulting surge in housing starts in April 2021, but housing starts have decayed as M2 Money growth slows.

5+ unit (apartment) starts were down -10% MoM in July, but at least permits for apartments rose +2.51% MoM.

Well, we at least know why the NAHB Homebuilder index sucked wind so badly yesterday.

Perhaps the housing market needs a little spoonful of QE.