Fed Data Shows a Half Century of Moderate Growth in the Fed’s Balance Sheet Through Two World Wars – Then a Seismic Explosion Under Bernanke, Yellen and Powell (Mortgage Rates Rise To Highest Since June 2009)

Wall Street on Parade had an excellent article showing the seismic explosion in the Fed’s Balance Sheet after the housing bubble burst and ensuing financial crisis.

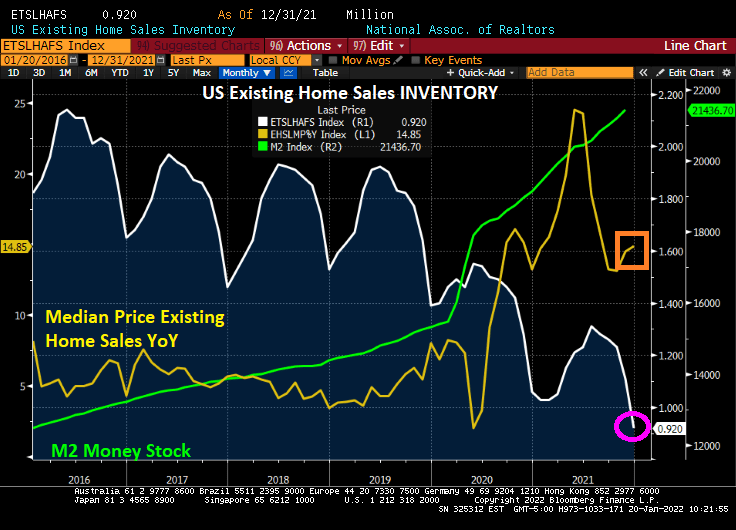
Here is my version of their chart since 2000 where you can seen the seismic shift in the balance sheet (toxic green slime line), particularly with The Fed’s response to Covid. The Fed is signaling a tightening in monetary policy to help reduce inflation (blue line).

But notice that M2 Money Velocity (GDP/M2) is now near the all-time low along with consumer purchasing power.

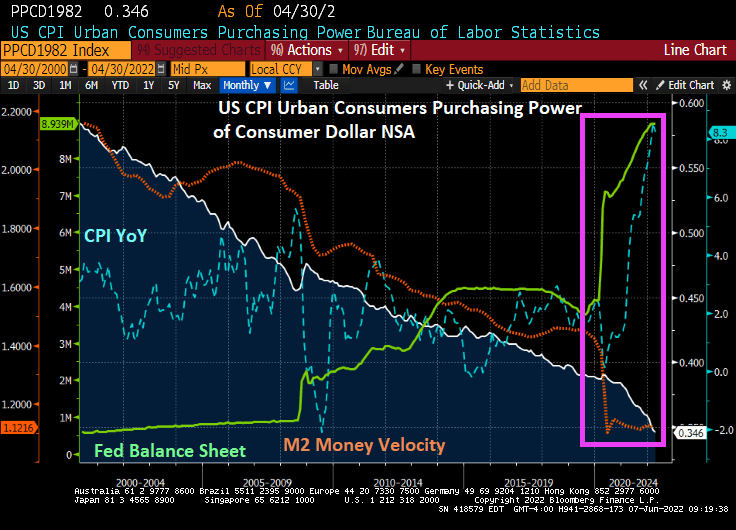
How BIG is The Fed’s balance sheet? Try more that a third of size of US GDP.

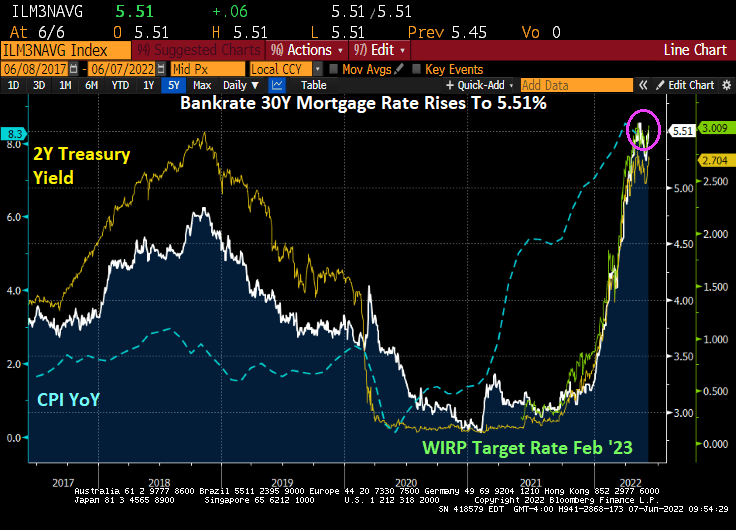
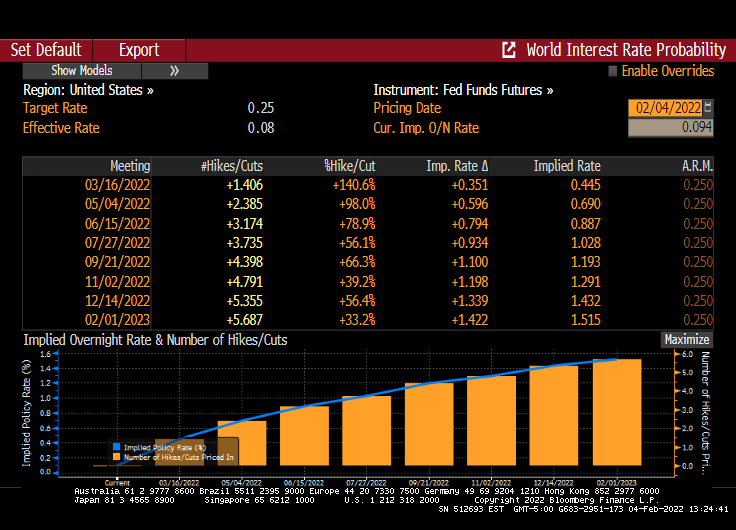
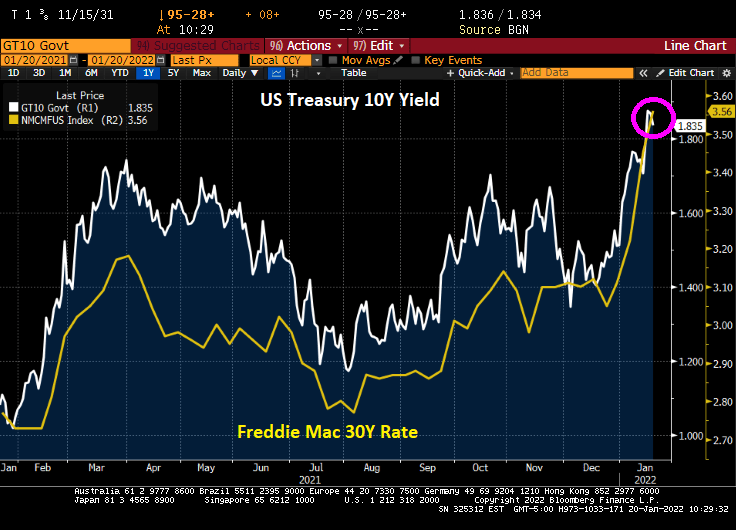
And as The Fed signals its inflation-fighting intentions, mortgage rates have shot up to 5.51%, the highest mortgage rate since June 2009.

Here is a video of the seismic shift in The Fed Balance Sheet, now that they are allegedly tightening monetary policy.

Speaking of seismic shifts, the Atlanta Fed’s Q2 GDP tracker just fell to +0.9%.

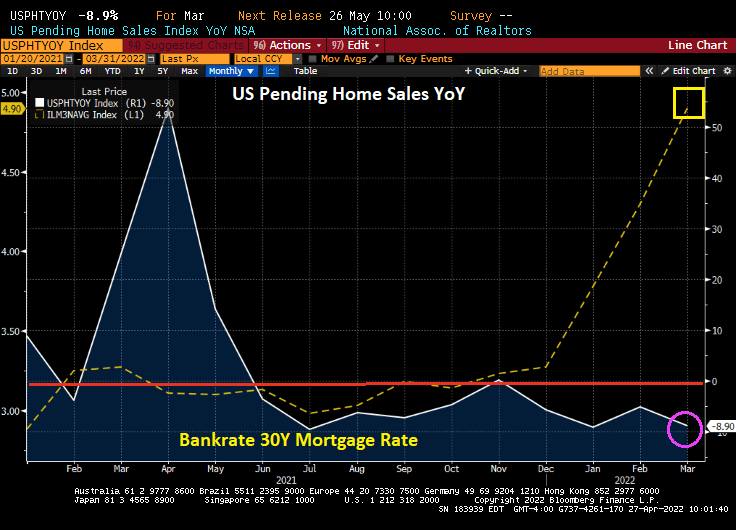
The Fed’s noose is tightening on the economy.

Heartaches In Heartaches! US Q2 Real-time GDP Stumbles To 0.446% As Fed Continues Monetary Stimulypto (What Will Happen When The Fed Pulls The Plug??) March Pending Home Sales Decline -8.90% YoY

Heartaches in heartaches. US GDP growth for Q2 has stumbled to 0.446% as The Fed is launching quantitative tightening (QT) to fight the inflation that they caused in the first place.

According to the Atlanta Fed’s GDPNow real-time GDP tracker, US GDP growth has stumbled to a meager 0.446%. Despite the massive stimulus from The Federal Reserve and Washington DC’s massive fiscal stimulus.

Biden, Powell and Congress are driving me crazy with inflation/price changes.

No corporate economists, inflation is NOT a good thing.

Pending home sales decline 8.9% in March, another heartache for Americans.

Will The Fed say good bye to its Snake Juice??

US New Home Sales Decline -19.3% YoY As Mortgage Rates Rise (Median Price Of New Home Sales UP 13.4% YoY)

US new home sales declined -19.3% YoY in January as mortgage rates have risen awfully fast.

On a MoM basis, US housing starts declined -4.53% from December, but heck … its winter. The median price for new homes rose 7.03% from December.

Median price of new home sales YoY is now 13.4% thanks to limited available inventory for sale.

Alarm! US 30-year Mortgage Rates UP 100 Basis Points Since Jan 4, 2021, REAL 30-year Rate Is Now -3.2% (And UP 57 BPS Since Dec 31, 2021)

Alarm!

US 30-year mortgage rates are up 100 basis points and climbing since January 4, 2021. Most of the increase has occurred since the turn of the year into 2022. According to the Bankrate 30-year mortgage rate index, the 30-year rate is up 57 basis points just since December 31, 2021 as the benchmark 10-year Treasury yield rises.

Bear in mind that the REAL 30-year mortgage rate is now -3.2%. Get it while you can!!

Given today’s surprise jobs report, The Fed now has a green light to raise rates.

To quote Van Morrison and Them, “Here Comes The Night” for the housing and mortgage market.

US Existing Home Sales: Still No Inventory, Median Price UP 14.85% YoY (Freddie’s 30Y Mortgage Rate Rise To 3.56%)

The banner headline is … US existing home sales declined 4.6% MoM in December. But that isn’t the interesting news. The interesting news is the mystery of the missing housing inventory. While various pundits told us that inventory would be returning … it isn’t. And the median price of existing home sales is up 14.85% YoY with insane Fed stimulus still in play.

That was December. What will January bring with rising mortgage rates? Freddie Mac’s 30-year commitment rate rose to 3.56% today.

When will housing inventory for sale start to increase? Probably about the same time The Fed ACTUALLY starts raising interest rates and paring back on the monetary stimulus.

Real Estate Hedge Against Inflation? Housing And REITs Did Better Than Inflation, NCREIF Not So Much

Now that inflation has reared its ugly head, how can investors protect themselves against the ravages of inflation?

Back in 1977, Fama and Schwert showed that housing acted as a hedge against inflation. Over the past year as inflation has reached its highest levels in 40 years, home prices have outpaced inflation by 19.08% to 6.8%.

How about real estate investment trusts? The NAREIT all-equity index rose by 35.6% YoY while inflation rose at 6.8%. The S&P 500 index rose 28.9% YoY.

Of course, the NAREIT all-equity index has a beta of 1.276.

How about the NCREIF All-property commercial real estate index? For Q3, the NCREIF property index rose by 5.22%, less than the most recent inflation reading of 6.8%.

So for the past year, housing has beaten the pants-off inflation, REITs have earned a higher return than inflation, and the NCREIF index seems to be rising slower than inflation (but with its lag problems, I anxiously await the Q4 numbers which should be higher.

The Mystery Of The Missing Housing Inventory For Sale (Elderly Americans Selling Less)

The inventory of existing homes for sale in the US is extremely low. The lack of available inventory to buy is helping drive home prices through the roof.

Available inventory for purchase peaked back in the 2007-2008 period during the dreaded housing bubble in the US. But inventory for sale has declined ever since. Why?

I think it has something to do with the aging of the US population. Look at this chart of Existing Home Sales Inventory against the growth 65+ years old.

Perhaps households 65+ are resisting moving to states like Florida and Arizona as they had in the past, leaving them stationary in their dwelling.

Another reason for the bewildering lack of inventory is the growth of the HECM (Home Equity Conversion Mortgage) that allows elderly households to drain the equity in their home rather than have to sell to utilize it. But HECMs have not taken-off sufficiently to explain the mystery of the missing inventory.

So we know that housing inventory is very low and we know that the number of Americans 65 and over is increasing. But we do not know the reason for the decline in inventory.

Jack Guttentag has an excellent write-up in Forbes on the HECM. Particularly with rapidly growing home prices and equity.

Home Sales Rose 0.8% MoM In October As Investors Rushed Into The Market (Inventory Remains Thin, Median Price +13.1% YoY)

Fools rush in … or at least investors rush into the US housing market. Investors made up 17% of existing home purchases in October.

Inventory of homes remains depressed and with investors picking up 17% of homes for sale, the median price of existing homes rose to 13.1% YoY.

While existing home sales rose 0.8% MoM, they fell -5.79% on a YoY basis as M2 Money slowed.

It is lonesome town for inventory. But it will be a poor little fool for those buying into this thin inventory market if home prices correct.

President Biden has decided to nominate Fed Chair Jerome Powell for a second term in an effort not to rock the boat. Lael Brainard is nominated for Deputy Chair.

US New Home Sales Rise 14% In September As Median Prices Rose 20.1% YoY (Fed Pumping Trillions Into Clogged Economic System)

US new home sales rose a whopping 14% in September as the median price of new home sales rose 20.1%.

Existing home sales still remain low allowing median prices to soar with Fed money printing.

New home sales surged as The Fed turns a blind eye to out-of-control inflation in prices.

Thanks to The Fed, new homes under $150,000 have disappeared and new homes over $500,000 have grown to 31% of all new homes. Where have all the starter homes gone?

Between Fed stimulypto and massive over-spending by Congress and the Biden Administration, the economic system is clogged like an interstate toilet, driving construction prices soaring.

Apparently Fed Chair Jerome Powell and Treasury Secretary Janet Yellen have never experienced clogged plumbing in their homes. And President Joe Biden has probably forgotten.

I can’t wait to hear if Biden’s press secretary Jen Psnarki attempts to put a positive spin on this debacle.

Time To Buy? Real 30Y Mortgage Rate At -2.21% As Real Home Price Growth At 14.34% YoY (UMich Home Buying Sentiment Improves To 75)

Wake up. Time to buy?

This is a time even unlike the disastrous housing bubble of the 2000s that led to the financial crisis and Great Recession. Even during the housing bubble years, we still had positive REAL mortgage rates: Bankrate 30Y Fixed rate – CPI YoY. But today we have even FASTER REAL home price growth and NEGATIVE mortgage rates!

And yes, REAL home price growth is 14.34% YoY while REAL hourly earnings growth is -0.79%.

The University of Michigan consumer survey came out today and buying conditions for housing improved to 75. Which means that more people were negative than positive due to skyrocketing home prices.

With negative 30Y mortgage rates and rising apartment rents, is it time to buy? Just remember what happened to Leon in Blade Runner.