As The Federal Reserve tries to fight inflation (it can’t thanks to Federal energy policies and bottlenecks), it is causing a disconnect between mortgage current coupon rate and the MBS index coupon. The disconnect is so bad that it is back to 1985 levels.
The Fed can certainly try to cool inflation, but Biden is intent on raising energy prices (leading to food price increases, and everything else) to shift us to electric cars. So, Biden is unlikely to back off.
So, The Fed is left trying to fight a war against inflation that only Biden can fight.
Meanwhile, the US mortgage market is getting pulverized
The Biden Administration and The Federal Reserve together should be called “The Cooler Kings” in that their policies are putting a Big Chill on the mortgage market and equities.
Mortgage rates are skyrocketing thanks to the Federal Reserve.
The 30-year fixed-rate mortgage averaged 5.27% for the week ending May 5, according to data released by Freddie Mac FMCC, -1.62% on Thursday. That’s up 17 basis points from the previous week — one basis point is equal to one hundredth of a percentage point, or 1% of 1%.
House price growth to wage growth is below the all-time high, but remains above housing bubble levels of 2005-2007.
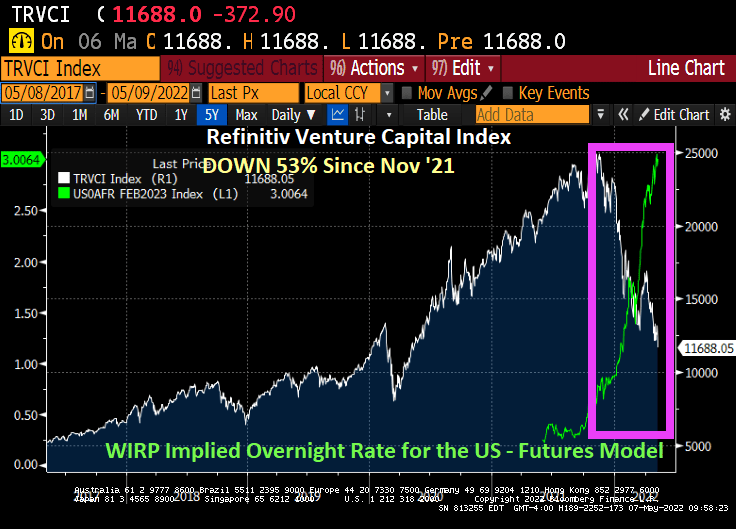
The Refinitiv Venture Capital Index is down 53% since November ’21 as The Fed cranks up interest rates.
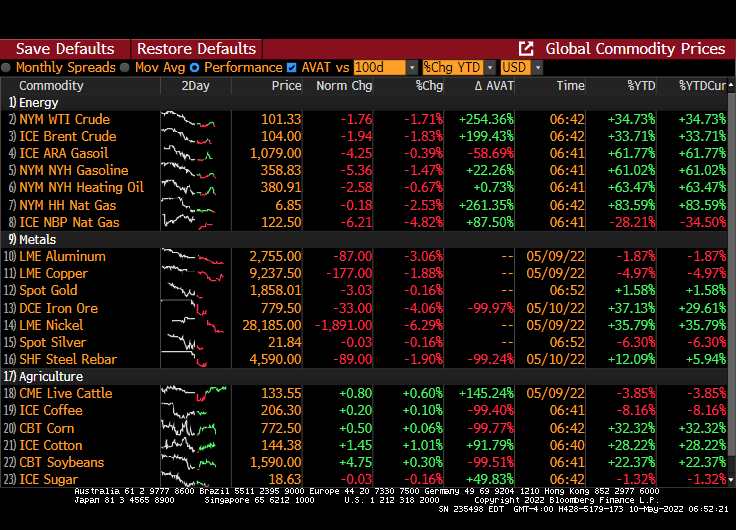
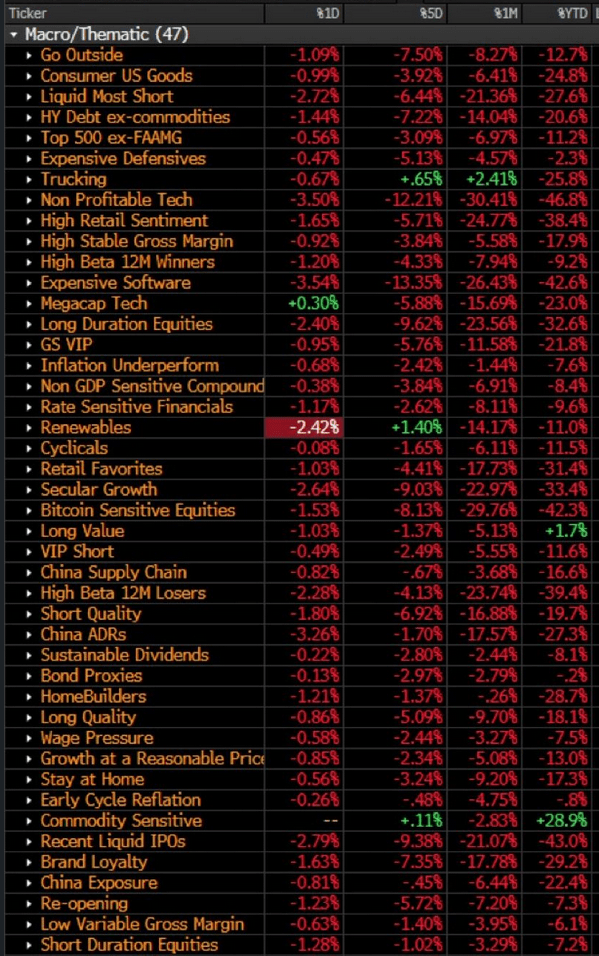
Well, at least commodities are soaring under “The Cooler Kings.” Pretty much everything else is sucking wind.
The question, of course, is whether The Federal Reserve will back off its plans to aggressively raise interest rates in lieu of crashing stock market, venture capital, and possibly home prices.
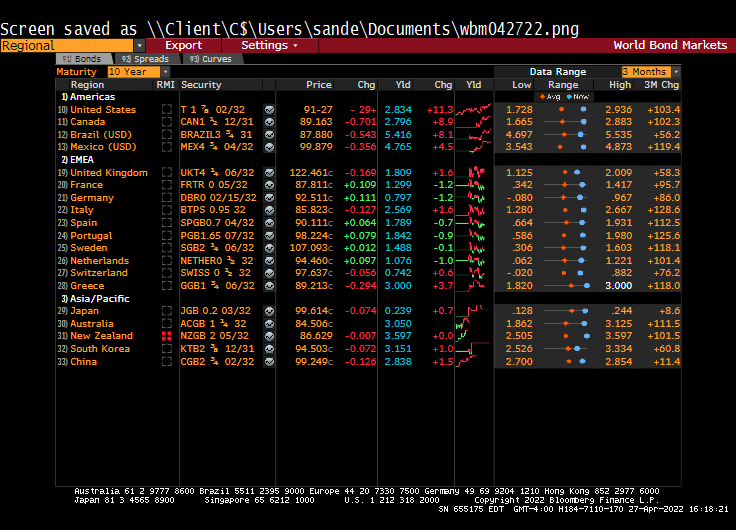
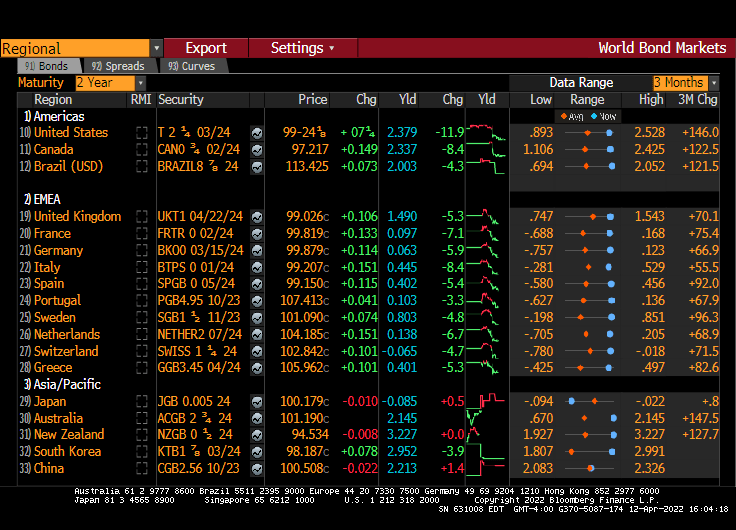
Particularly if you are a pension fund and hold US Treasuries and Agency Mortgage Backed Securities.
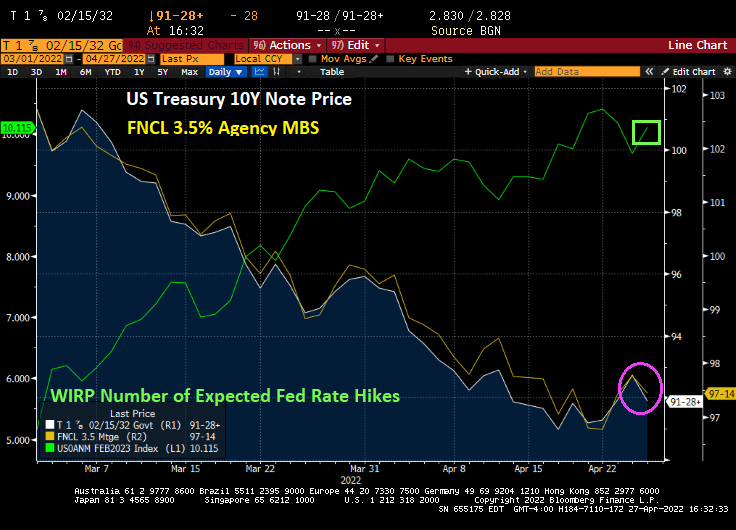
The bad news is that the 10-year US Treasury Note declined in price, sending the yield up over 10 bps today.
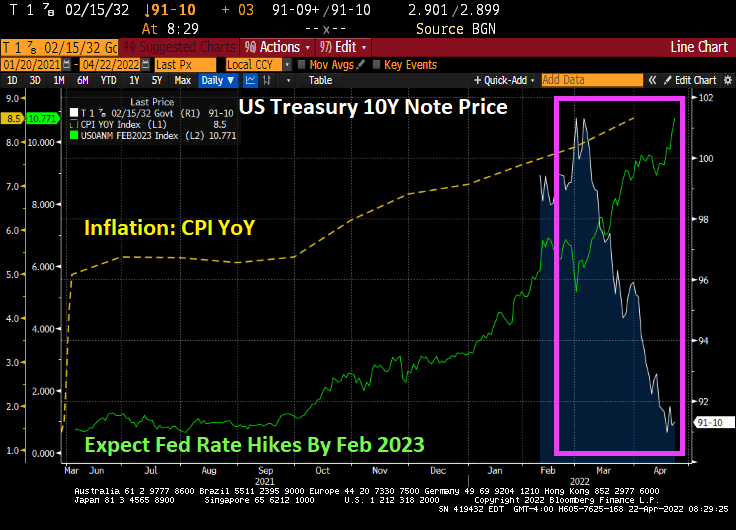
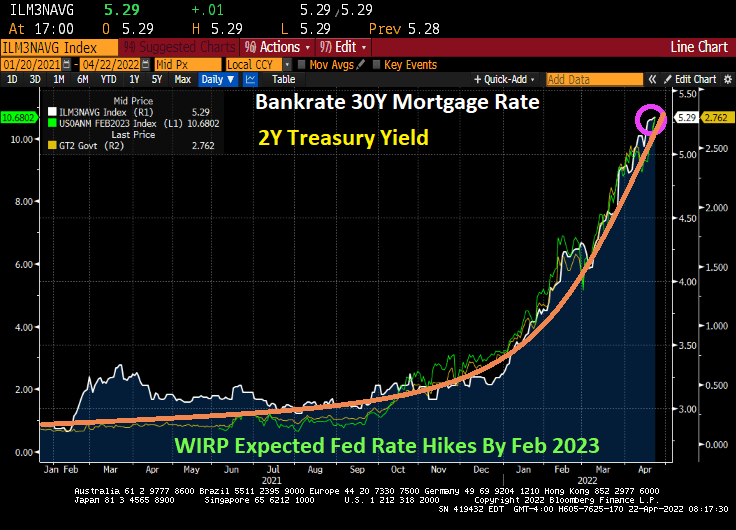
As The Fed is projected to raise its target rate over 10 times by February 2023, 10-year Treasury Note prices and agency MBS 3.5% prices continue to decline.
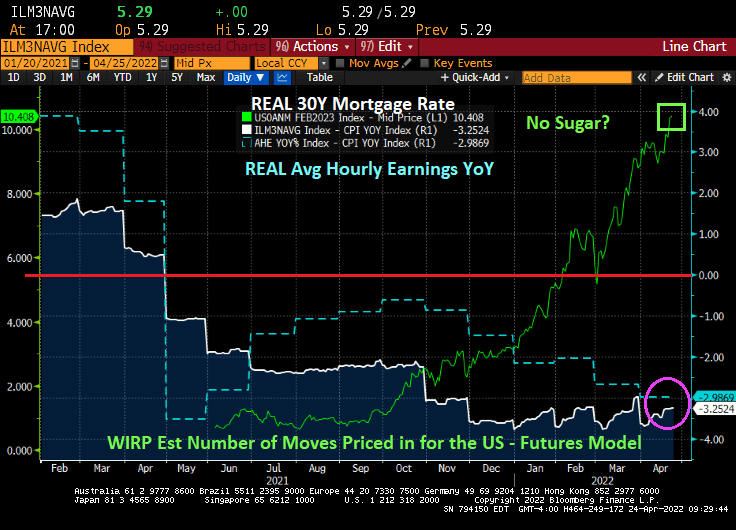
As The Fed sings “No sugar tonight” exemplified by the number of expected Fed rate hikes by February 2023 has grown to 10.4. Mortgage rates are now the highest since 2009, but inflation is the highest in 40 years. The result? The REAL 30-year mortgage rate is -3.25%.
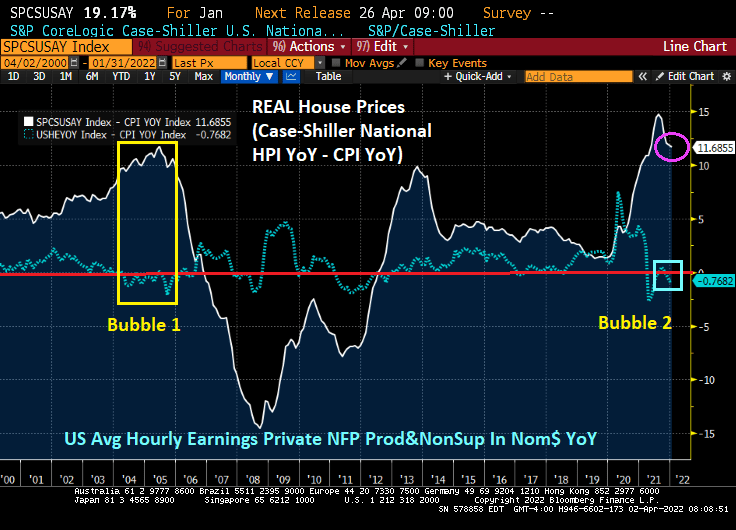
REAL average hourly earnings are now a terrible -2.99% YoY thanks to the worst inflation in 40 years. REAL home prices are growing at 11.8% YoY.
Traders are betting that even with the Fed boosting its target for the federal funds rate by 2.5 percentage points this year to 3% won’t be enough to get the inflation rate back down to 2% over the next decade from around 8.5% currently.
In nominal terms, mortgage rates are seemingly trying to rise to 2007 levels (6.5%). But the gap between the 30-year mortgage rate and Fed Funds target rates is back to 2009 levels.
Talk about Fed and Fed government OVER stimulypto! Even REAL US home prices grew at 12% YoY pace while the REAL Fed Funds Target rate is -8.04%.
Its Saturday and I am dreading markets opening on Monday. But here is where we sit today.
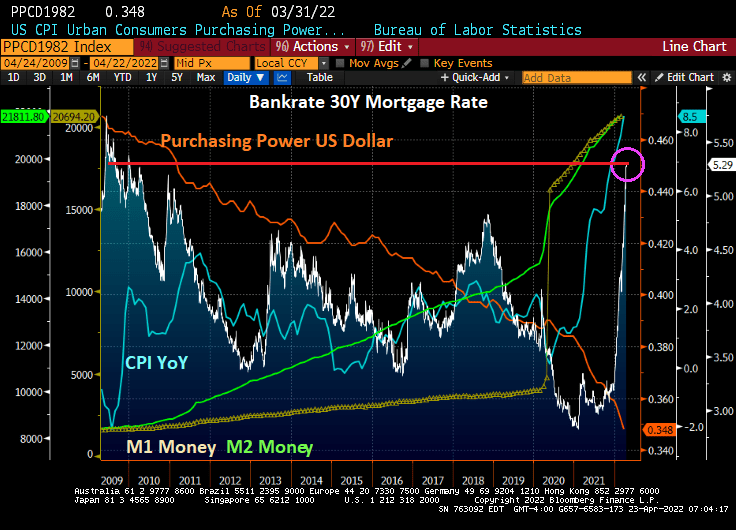
The 30-year mortgage rate has soared to 5.29%, the highest level since 2009 at the beginning of Obama’s Presidency. Since 2009, we have seen the purchasing power of the US Dollar decline further (orange line) while inflation (blue line) has soared. M1 (yellow) and M2 (green) has been growing since the financial crisis, but really took-off with the Covid outbreak in 2020 and The Fed’s massive overreaction coupled with Federal government stimulus.
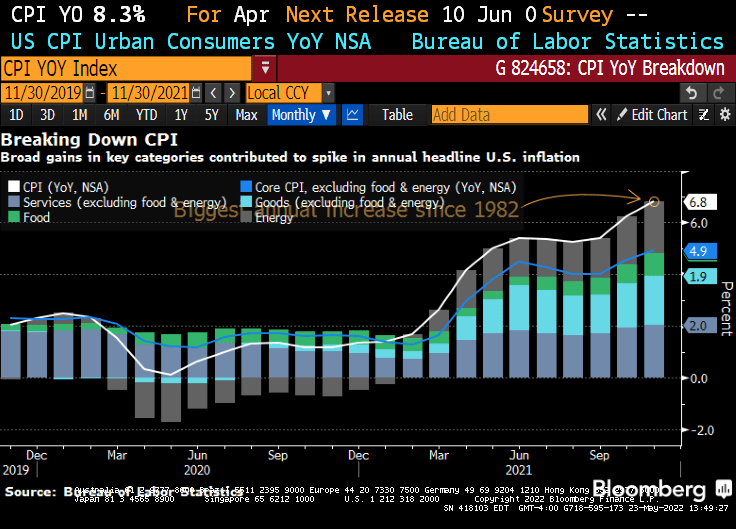
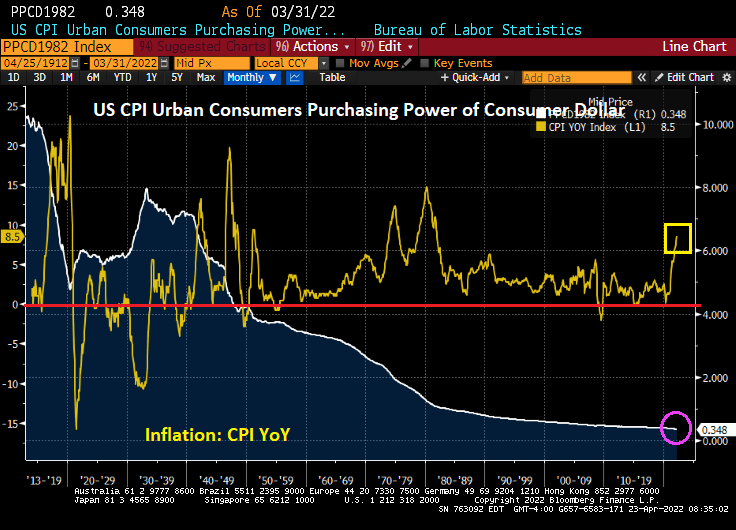
Since the creation of The Federal Reserve System under President Woodrow Wilson, the purchasing power of the US Dollar has collapsed so much that $10 in 1913 in worth 34.8 cents today. But notice that since 1949, the CPI YoY has rarely been negative meaning that prices are pretty much only going up.
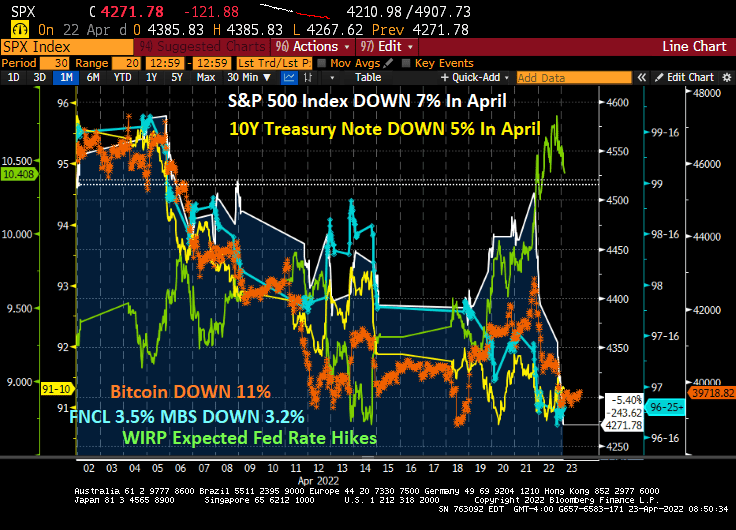
Instead of April showers bring May flowers, it is April expected Fed rate hikes (now 10.408 rate hikes by February 2023) bringing declining assets prices. In April so far, the S&P 500 index is DOWN 7%, the 10-year Treasury Note price is DOWN 5%, Bitcoin is DOWN 11%, the 3.5 coupon agency MBS price is down 3.2%.
We are seeing increased volatility in both the equity and bond markets.
Well, Powell and The Fed are hurling fireballs at mortgage rates and asset prices in April.
US President Biden went green and signed executive orders on his first day to limit oil and natural gas exploration of Federal lands and offshore (also, killed the Keystone Pipeline), helping to drive up energy prices and food prices. These orders begat inflation (also caused by the massive Covid relief by the Federal government). The highest inflation in 40 years begat The Federal Reserve signalling a tightening of Fed monetary policy … to fight the problem caused by The Fed in the first place … too much monetary stimulus for too long. Fiscal and monetary fanaticism and ignorance is forever busy and needs feeding
There was an interesting article on MarketWatch entitled “Bond rout exposes Social Security’s insanity.” The headline was “Every dollar of yours that’s invested in the Social Security trust fund is invested in low-yielding government bonds.”
Yes, another disastrous consequence of The Fed’s lax monetary policy since 2008, helping to push Treasury yields extremely low. And REAL Treasury yields into negative territory.
But here we sit today with The Fed threatening to trim their balance sheet and raise rates … to combat the inflation they helped create in the first place. Now we have the 10-year Treasury Note price falling like a paralyzed falcon with expected hate hikes going above rate hikes by February 2023 (based on Fed Funds Futures prices).
Most pension funds also invest heaving in US Treasuries, along with agency Mortgage-backed Securities (AgencyMBS).
People Get Ready! For The Federal Reserve to actually withdraw its massive stimulus.
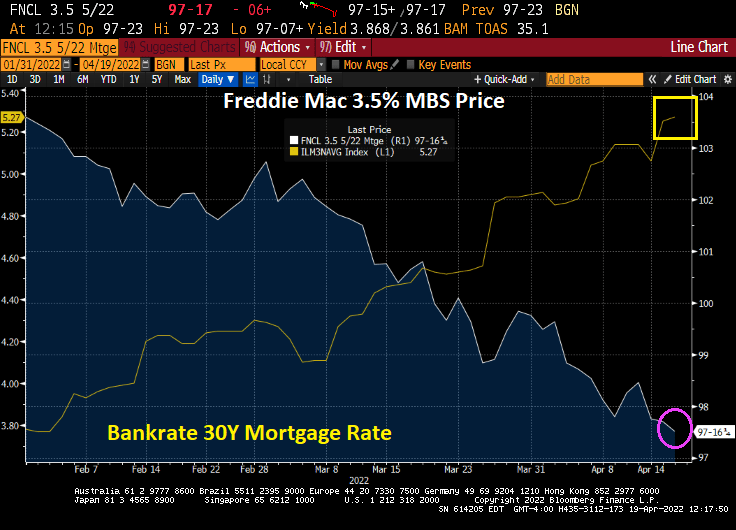
I generally discuss that negative impact of rising mortgage rates on the housing market, but today I am focusing on the decline in agency mortgage-backed security prices due to rising mortgage rates.
Here is the uniform MBS price for a 3.5% coupon security. It is falling like a rock with anticipated Fed monetary tightening.
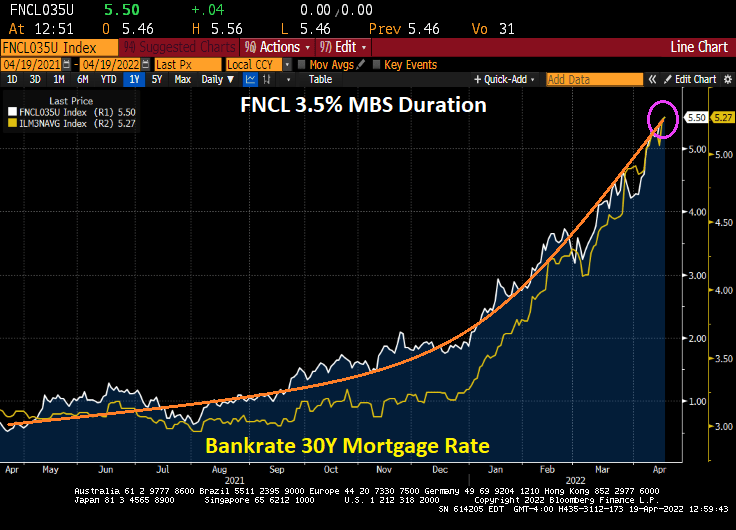
And duration risk is going to the moon! (That is, accelerating rapidly).
FNCL 3.5 coupon MBS has a WAC of 4.206 and a WAM (or WARM) of 359. Not to mention a factor 0.997.
At least energy prices are cooling thanks to China grinding to a halt with the latest Covid epidemic.
I wish The Fed would back off its allegedly ambitious tightening and soothe me.
US real average weekly earnings growth YoY is down to -3.60%. That is the lowest since 2007 and is worse than The Great Recession and financial crisis of 2008.
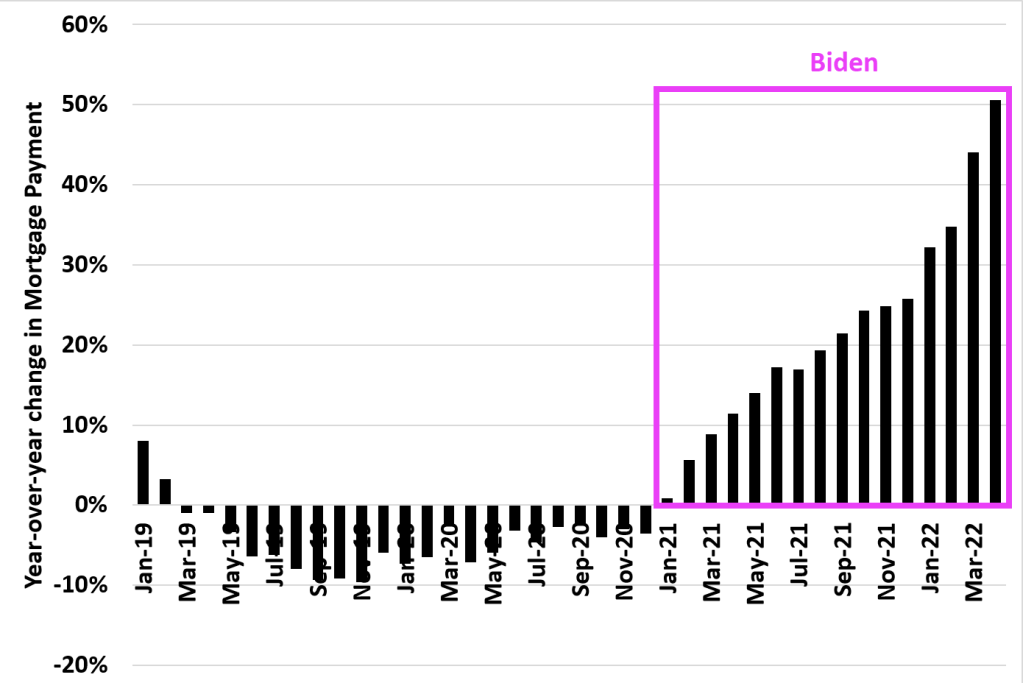
And look at this chart of mortgage payments under Biden. The US was actually experiencing DECLINING mortgage payments YoY in 2019 and 2020. But under Biden’s leadership, mortgage payments have increased by 50% making housing even MORE unaffordable for the middle class and lower-income households.
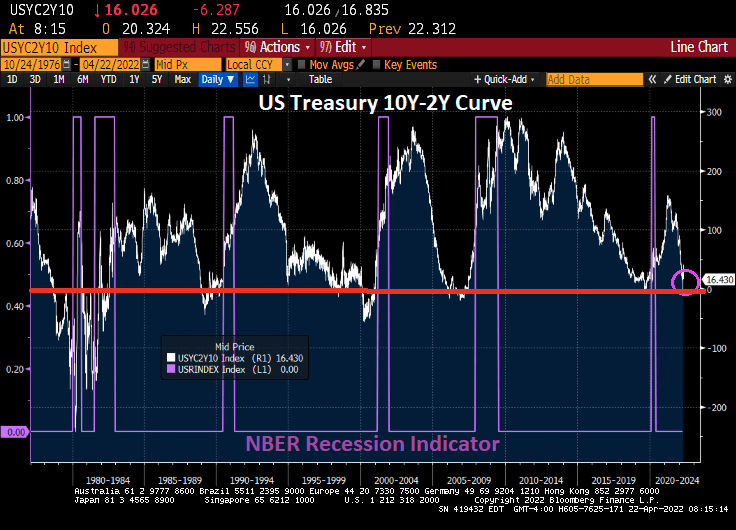
And now for something kind of scary. The US today suffered a 12 basis point decline in the 2-year Treasury yield, generally a bad sign for the economy. As if we needed more bad news for today.
Highest inflation in 40 years, worst wage growth since 2007 and rising mortgage payments. We will need all the luck we can get.
The Dallas Federal Reserve issued a warning recently that a housing bubble is brewing … after the economy drank its magic monetary elixir. We can see the housing bubble clearly (defined as the spread between REAL home price growth and REAL average hourly earnings). Notice that the current housing bubble looks similar to the infamous 2005 housing bubble. And the US is seeing several months of the spread between REAL home price growth and REAL hourly earnings be even higher than the peak of the 2005 bubble.
The Federal Reserve is starting to slow down its asset purchases, so we should see a cooling of the housing bubble. Unless, of course, The Fed changes its tune from quantitative tightening (QT) back to quantitative easing (QE) … again.
The Dallas Fed has a measure of housing “exuberance” which shows a bubble forming, but not there yet. I like the spread between real house price growth and real hourly earnings better.
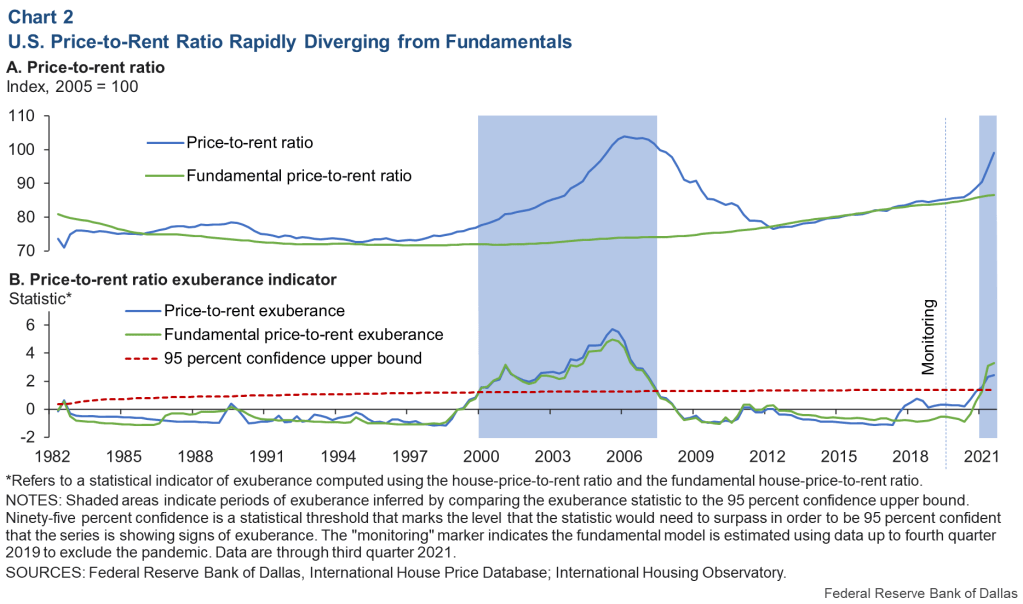
The Dallas Fed also has a price-to-rent chart also showing growing exuberance.
But if we look at the Case-Shiller National HPI YoY to US CPI Urban Consumers Owners Equivalent Rent of Residences YoY we see that the US is currently experiencing a price-to-rent ratio higher than the peak of the 2005 house price bubble. What is the culprit? The vast expansion of monetary and fiscal Stimuylpto surrounding the Covid outbreak in early 2020.
So, the Dallas Fed thinks that is a house price bubble is brewing, but it has actually been in the works since QE3 in 2013 (bubble 2), but really took off with The Fed’s stimulypto and Federal COVID spending surrounding the COVID outbreak in early 2020.


You must be logged in to post a comment.