Dallas After Midnight! “Poor National Leadership” As Stagflation ‘Erodes Business Confidence’

Dallas after midnight! Especially with a broken Congress and President.

Philly Fed Services jumped into expansion (to two year highs?), Chicago Fed National Activity Index surged, Case-Shiller home prices hit a new record high but appreciation slowed, Conference Board Expectations hovers near decade lows, Richmond Fed Manufacturing tumbled, Dallas Fed Services improved but remains in contraction

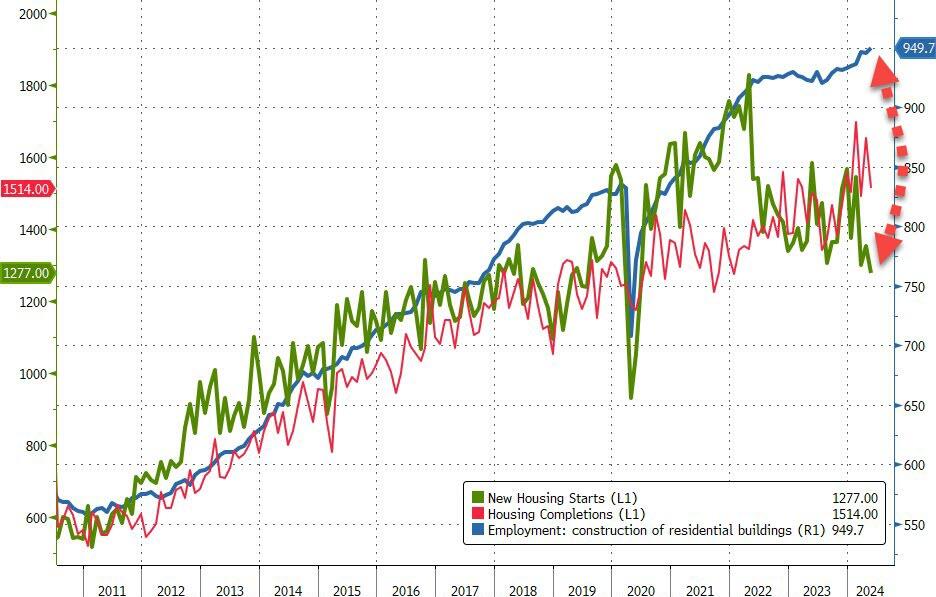
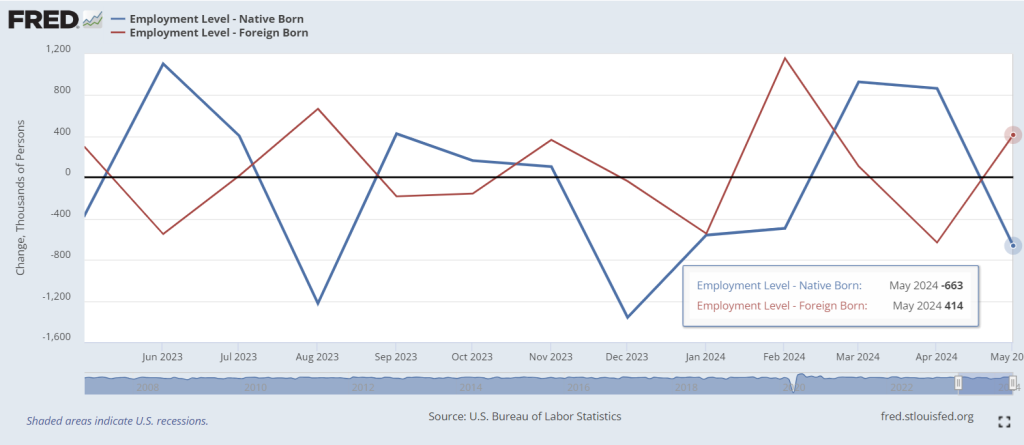
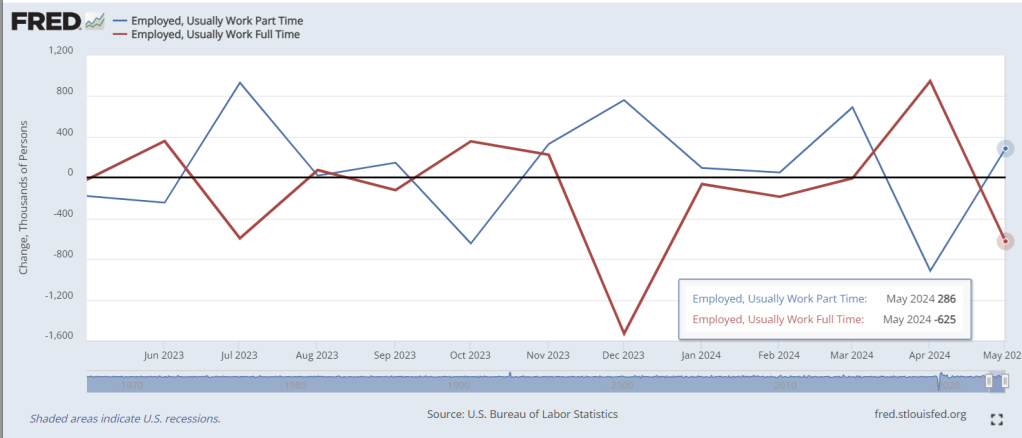
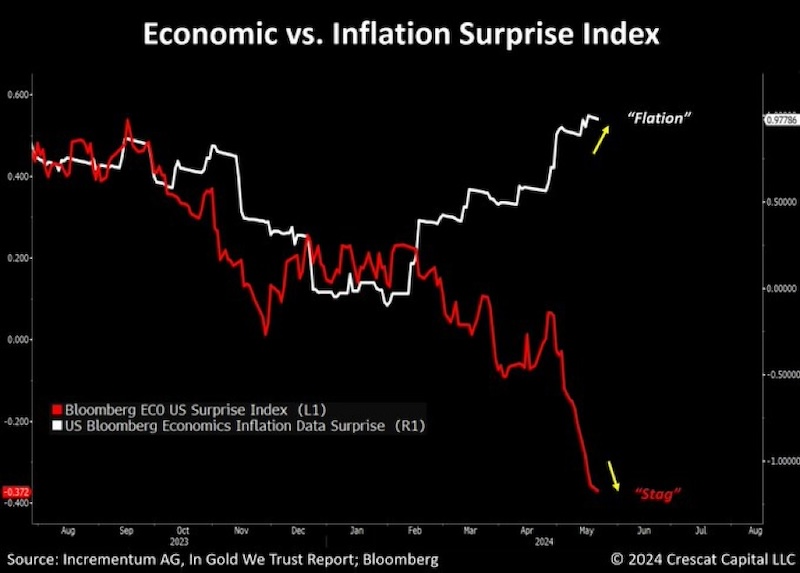
But, below the hood of the last one we see some more interesting dynamics evolving as revenues and employment decline while prices re-accelerate

Source: Bloomberg

This is the 25th straight month of contraction (sub-zero) for the Dallas Fed Services index and judging by the respondents’ comments, there is a clear place to point the finger of blame:

Poor national leadership and lack of confidence have eroded the business environment.

  • The Federal Reserve’s recent  announcement of no rate cuts in the near future is concerning regarding the  immediate and lag effect it could  have on the local economy. We have received  direct feedback from many of our clients in various industries, and they are  increasingly concerned. They are freezing hires and spending, with many  reducing spending. The primary reason is the economic stagnation locally and  nationally affecting their businesses.
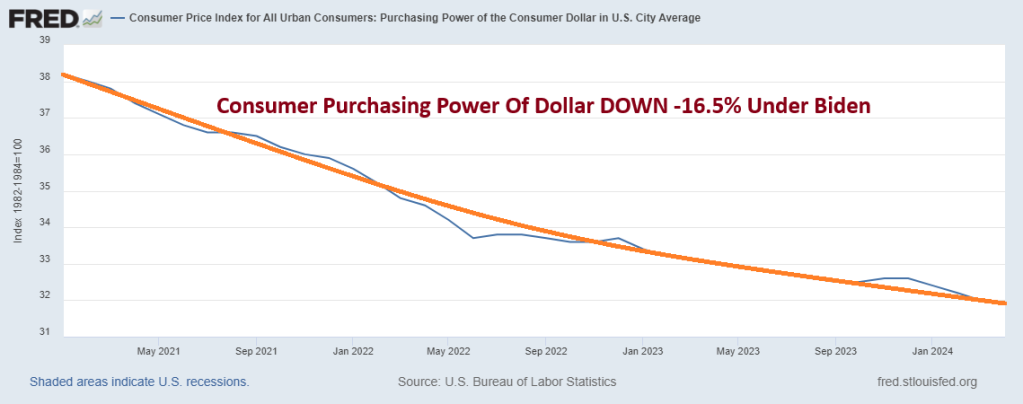
  • People are adjusting to new economic realities. Few are expecting salary increases and are instead making lifestyle  adjustments to deal with higher living costs. Reality is also setting  in for the apartment owners we serve. They understand rents aren’t going up and  interest rates aren’t coming down. As rate caps expire and loans mature,  lenders are having to adapt as well. Ultimately, a lot of private equity (much  in the form of individual retirement savings put into syndications) is getting  wiped out.
  • We need a rate cut before we will  see any revenue improvement from home sales.
  • As elections draw near, the political environment worsens, creating more uncertainty in our business.
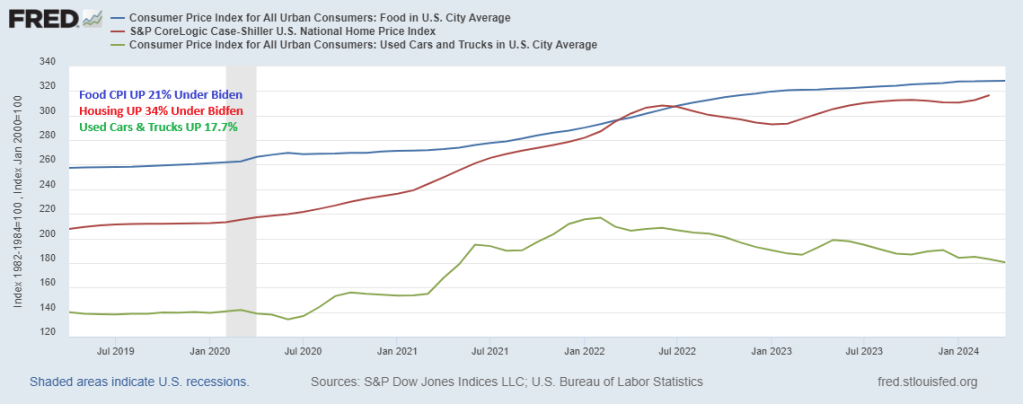
  • We feel inflation and fear of more inflation plus the rise in cost of living are holding consumers back. Hopefully we will adapt to the new realities soon.

Customers are concerned about the election, so they are holding off on large purchases.

  • The lack of building activity is  shutting down the appliance industry.
  • Affordability has become an ever-increasing problem for new car dealers. The price increases of new cars combined with  higher interest rates have put new cars out of reach for more and more people.
  • [Car] inventories continue to swell, and  interest rates remain high. Our grosses are off, and margins continue to  decline. Profits are down 20  percent from the prior year.
  • The economy is slowing. The consumer  is more cautious and more reluctant to purchase at higher prices and payments.

And finally, this seemed to sum up just how business-owners feel in general about the current occupant of The White House:

“Our outlook depends heavily on the presidential  election.

BIG Bubbles! National House Price Index Up 6.3% Year-over-Year in April Despite Mortgage Rates Up 147% Under Biden (San Diego Fast Growing At 10.3% YoY, Portlandia Slowest Growing)

This isn’t a tiny bubble!

S&P/Case-Shiller released the monthly Home Price Indices for April (“April” is a 3-month average of February, March and April closing prices). The pace of appreciation has slowed from the previous month, reflecting the toll of 7% mortgage rates and low inventory.

This release includes prices for 20 individual cities, two composite indices (for 10 cities and 20 cities) and the monthly National index.

From S&P S&P CoreLogic Case-Shiller Index Break Previous Month’s All-Time High in April 2024

The S&P CoreLogic Case-Shiller U.S. National Home Price NSA Index, covering all nine U.S. census divisions, reported a 6.3% annual gain for April, down from a 6.5% annual gain in the previous month. The 10-City Composite saw an annual increase of 8.0%, down from an 8.3% annual increase in the previous month. The 20-City Composite posted a year-over-year increase of 7.2%, dropping from a 7.5% increase in the previous month. San Diego continued to report the highest annual gain among the 20 cities in April with a 10.3% increase this month, followed by New York and Chicago, with increases of 9.4% and 8.7%, respectively. Portland once again held the lowest rank this month for the smallest year-over-year growth, with a 1.7% annual increase in April.

The U.S. National Index, the 20-City Composite, and the 10-City Composite upward trends decelerated from last month, with pre-seasonality adjustment increases of 1.2%, 1.36% and 1.38%, respectively.

After seasonal adjustment, the U.S. National Index and 10-City Composite posted the same month-over-month increase of 0.3% and 0.5% respectively as last month, while the 20-City reported a monthly increase of 0.4%.

“For the second consecutive month, we’ve seen our National Index jump at least 1% over its previous all-time high,” says Brian D. Luke, Head of Commodities, Real & Digital Assets at S&P Dow Jones Indices. “2024 is closely tracking the strong start observed last year, where March and April posted the largest rise seen prior to a slowdown in the summer and fall. Heading into summer, the market is at an all-time high, once again testing its resilience against the historically more active time of the year.

“Thirteen markets are currently at all-time highs and San Diego reigns supreme once again, topping annual returns for the last six months. The Northeast is the best performing market for the previous nine months, with New York rising 9.4% annually. Sustained outperformance of the Northeast market was last observed in 2011. For the decade that followed, the West and the South held the top posts for performance. It’s now been over a year since we’ve seen the top region come from the South or the West.

Of course, Fed Money Printing is helping drive home price growth. Perhaps too much!

Here is Jerome Powell, Chairman of The Fed Bubble Blowing Machine!!

Biden Shrugged: US Housing Starts Fall To COVID Lockdown Lows (Multifamily Starts Down -51.7% YoY In May)

It begs the question: where are the 10+ million illegal immigrants living who have poured over the border under Binden/Mayorkas? Especially when 5+ units housing starts dropped -51.7% since last year (YoY) in May. And the trend under Biden looks terrible!

Despite ugly consumer confidence and soaring mortgage rates, analysts expected a small rebound in housing starts and building permits in May (after April’s disappointing misses). They were wrong… again… as both Starts and Permits plunged MoM (-5.5% MoM and -3.8% MoM respectively)…

Source: Bloomberg

That was the third monthly drop in permits (more forward looking) in a row. Worse still, April Housing Starts were revised lower (from +5.7% to +4.1%), making this miss even worse.

This dragged the SAARs for starts and permits to their lowest since the trough of COVID…

Source: Bloomberg

With Multifamily starts falling back near COVID lockdown lows…

  • Single-Family 982K SAAR, down 4.8% from 1,031K and the first sub-million print since October 2023
  • Multi-Family 278K, down 13.7% from 322K and the lowest since March’s 245K (which was the lowest print since covid crash)

Source: Bloomberg

And multi-family permits cratering to their lowest since Oct 2018…

  • Single-Family permits 949K SAAR, down 2.9% from 977K
  • Multi-Family permits 382K SAAR, down 6.1% from 407K

And with rate-cut expectations holding near their lows, there is no sign of recovery in home-building yet…

Source: Bloomberg

It seems reality is starting to set in for homebuilders…

Source: Bloomberg

As housing starts plummet, jobs seem to keep growing to record highs…

Source: Bloomberg

Will any rate-cut actually move the dial here?

The Streets Of San Francisco! Office Availability Rates Soar In Large US Metro Areas (San Francisco Leads Nation In Office Availability)

I can’t wait to get back where we started from. In terms of the economy.

And the CRE office market is showing disaster. San Francisco office market availability rates have soared in Q1 2024 to over 35%, up from less than 10% in Q1 2019.

Welcome to The Streets of San Franciso!

Biden Shrugged! US Economy Actually Lost -408k Jobs In May (Initial Claims Surge To 10-Month Highs As California Joblessness Soars)

Joe Biden is a dishonest politician, so it is no wonder that he ignores actual data. Like claiming that crime is down under his leadership, when it is actually large cities like New York and Los Angeles not reporting their crime data to the FBI.

Take the May jobs numbers. The BLS reports that 272k jobs were added. However, the more accurate Household Survery reported a loss of -408k jobs in May.

While the Establishment Survey did indeed report that 272K “jobs” were added, this number also included multiple job holders; stripping those out, we get that the actual number of “employed” workers plunged by -408K.

On the jobless claims side, the number of Americans applying for jobless benefits for the first time surged last week to 242k (up from 229k and well above the 225k exp). That is the highest since August 2023…

Source: Bloomberg

On an NSA basis, claims exploded higher.

The last three weeks have seen the largest surge in claims since January…

Source: Bloomberg

Notably this surge is very VERY similar to what we saw last year (but not the prior few years, so not a ‘seasonal’ pattern per se)…

Source: Bloomberg

The surge in NSA claims was driven by California…

California leads the nation in initial jobless claims, thanks to Newsom’s $20 per hour minimum wage law for fast food restaurants. This one’s gonna hurt Californians for a long, long time.

Biden and Newsom WISH they were Atlas.

Consumer Prices Hold At Record Highs – Up 20% Since Biden Elected (Shelter Index Rose 5.4% Over Past Year)

The middle class and low wager workers are made for kicking. And that’s with Bidenomics did.

The headline consumer price index was unchanged MoM in May – the smallest change since July 2022 – just less than the +0.1% MoM expected. On a YoY basis, headline CPI rose 3.3% (less than the 3.4% exp) – but very much stuck in a range well above the 2% target for over year now…

Source: Bloomberg

Energy was the biggest drag on the headline CPI MoM…(Gasoline prices tumbled 3.6% in May from April, one key reason why the headline CPI was flat on the month. )

Source: Bloomberg

Core CPI rose 0.2% MoM (below the 0.3% exp) pulling the YoY change down to 3.4% (from 3.6% and below the 3.5% exp). That is the lowest Core CPI YoY since April 2021…

Source: Bloomberg

Core CPI has not had a down-month since President Biden was elected.

Core Services inflation slowed notably MoM…

Source: Bloomberg

The shelter index increased 0.4 percent in May and was the largest factor in the monthly increase in the index for all items less food and energy.

  • May Shelter inflation 5.41% YoY, down from 5.55% in April and lowest since April 2022
  • May Rent inflation 5.30% YoY, down from 5.44% and lowest since May 2022

For context on how important housing costs are to US inflation data, the shelter index rose 5.4% over the last year, making up over two thirds of the total 12-month increase in the all items less food and energy index.

Source: Bloomberg

It does make one wonder were exactly the BLS is getting their BS OER data from…

The full breakdown…

Services INflation remains awkwardly stuck above 5% while Goods DEflation is at its weakest since January 2004…

Source: Bloomberg

SuperCore CPI fell 0.05% MoM – its first drop since Sept 2021, but that left the YoY level still above 5.0%…

Source: Bloomberg

Transportation Services costs tumbled MoM to drag SuperCore lower MoM…

Source: Bloomberg

We note that consumer prices have not fallen in a single month since President Biden’s term began (July 2022 and May 2024 was the closest with ‘unchanged’), which leaves overall prices up over 19.5% since Bidenomics was unleashed (compares with +8% during Trump’s term).

And prices have never been more expensive…

That is an average of 5.4% per annum (almost triple the 1.9% average per annum rise in price during President Trump’s term).

Source: Bloomberg

Since President Biden was elected, food prices at home are up around 21% and food prices away from home are up almost 23%…

And while the Biden administration will continue to gaslight voters with comments like “inflation is tumbling”… every man, woman, and child who actually buys food knows prices have NEVER been higher…

Finally, while the ‘flations’ have broadly tracked M2 lower, we note that M2 YoY is now starting to turn back higher once again…

Source: Bloomberg

Will the next President and Fed head face a 70s redux?

Source: Bloomberg

And is this guaranteed if Powell decides “insurance” cuts are required (for Biden?)

Too Much Debt! US Government And Consumers Are Debt Crazed (US Debt Hits $34.8 TRILLION, Consumer Debt Hits $17.69 TRILLION, Unfunded Liabilities Hits $216 TRILLION)

Too much debt should be the theme song for the US! Both for consumers and the Feral government (not a typo!)

Consumer credit increased by +$6.403 billion in April, much softer than consensus estimate of +$10 billion … more notable, however, was March data, given initial read of +$6.274 billion was revised down to -$1.099 billion.

Not to mention $13 trillion in mortgage debt (1-4 unit housing), but at least that is backed by property. Unlike The Feral government who borrows/prints with only a promise.

Consumer Debt Hits $17.69 TRILLION.

US national debt stands at $34.8+ trillion.

And growing awfully fast. Note that since the “pandamic”, debt as % of GDP has exceeded 100% and is projected to hit 166% by 2054. But look at the UNFUNDED LIABILITIES the need to be paid ($216+ TRILLION ($641.5k per citizen!). Pretty soon, we (the 99%) will be back on the chain gang paying for endless wars and government corruption. I wish Biden, Schumer, McConnell and other swamp creatures would consider all the spending the government is on the hook for rather than focus on spending that will help them get elected perpetually. There is no middle of the road anymore. The US is broke and has too much debt.

Of course, President Biden wants endless spending on wars (Ukraine, Israel, etc) and now wants an unlimited check to pay for the next pandemics. The Pretenders’ song “My City Was Gone” seems to be appropriate for the US as “My County Is Gone.”

Of course, some “economists” claim that the US can borrow/print unlimited amounts of money … until they can’t.

ZERO INCREASE In Jobs For Native-born Workers In Over Five Years! (Native-born Workers Lost 463k Jobs In May 2024 While Foreign-born Workers Gained 414k Jobs)

The theme song for the Biden Administration should be “South of The Border.”

Biden’s open borders policies are like something out of the book/film “Gangs of New York.” This time it isn’t Irish immigrants that are rioting/looting, it iis illegal immigrants from Latin America, China, and the Middle East. Essentially replacing native-born workers with foreign-born workers.

Since COVID, the growth in foreign-born workers have blow away the growth in native-born workers. So much so that since 2019, native-born workers have actually lost jobs while foreign-born workers have surged.

But for May 2024, native-born workers lost 463k jobs while foreign-born gained 414k jobs.

In May, part-time jobs soared by 286k jobs while full-time jobs nosedived by -625k jobs.

Finally, the difference between the BLS survey and the more accurate Household Survey is huge!

Krugman’s Grossly Misleading Inflation Victory Declaration … BUT Purchasing Power Of US Dollar Is Down -16.5% Under Biden (Food Prices UP 21%, Home Prices UP 34%, Used Car/Truck Prices UP 17.7%)

Call it Washington DC soullessness.

Back in 2023, Socialist Paul Krugman declared that “the war on inflation is over!!! “We” won, at very little cost.” I love when elitists claim “We won!” since clearly 99% of Americans lost since food, housing and car prices up are double digits under Biden.

The problem is that food, energy, shelter, and used cars/trucks are a huge part of Americans consumption basket.

Under Biden, food CPI is up 23%. Home prices are up 34% and used cars/truck prices are up 17.7%.

A note to Paul Krugman, YOU may have won, but the rest of Americans lost. Consumer purchasing power of the US Dollar is DOWN 16.5% Under Biden.

Here is where we stand under Bidenomics.

Ask Joe if he cares.

Chicago PMI Screams RECESSION! Falls To Cycle Low Of 35.4, Back To 2008 Recession Levels (Copper Prices Rising!)

Not so Sweet Home Chicago!

After unexpectedly slumping last month to 37.9, the Chicago PMI index cratered even more unexpectedly in May, when it defied hopes of a rebound to 41.5, and instead tumbled even more, sliding to a cycle low of 35.4 which was not only below the lowest estimate, but was staggeringly low. To get a sense of just how low, the last two times it printed here was during the peak of the covid and global financial crises…

… which seems to suggest that at least according to Chicago-based purchasing managers, the economy is in a depression.

This is how the final number looked relative to expectations.

Looking at the report we find the following:

  • Business barometer fell at a faster pace; signaling contraction
  • New orders fell at a faster pace; signaling contraction
  • Employment fell at a faster pace; signaling contraction
  • Inventories fell at a faster pace; signaling contraction
  • Supplier deliveries fell at a slower pace; signaling contraction
  • Production fell at a slower pace; signaling contraction
  • Order backlogs fell at a faster pace; signaling contraction

Did nothing rise? One thing did:

  • Prices paid rose at a slower pace; signaling expansion

So we have not just a depression, but a stagflationary depression in which everything else is going to hell, except prices: they keep on rising.

And while it is unclear what has prompted this unprecedented bearishness (the surely negative contribution from Boeing is likely to blame for a substantial portion of the apocalyptic outlook), one thing is certain: Goldman will have to come up with even more goalseeked surveys that explain away reality and tell us how purchasing managers really should feel…

On the good news front, REAL Gross Domester Income rose to 1.5%.

As copper prices keep on rising. Which is bad news for Biden’s shift to EVs! (Once again, Biden is driven around in gas guzzling Chevy Tahoes/Suburbans and owns a Chevy Corvette). There isn’t enough copper production to build the EVs that Biden wants.

Biden drove his Chevy to the STRATEGIC PETROLEUM RESERVE and the reserve was dry. And them good old Democrats were drinkin’ whiskey and rye after a New York Jury found Trump guilty of 34 felony counts, despite there not being any laws broken.

I have testified and sat through many trials in New York city and have never seen a court case quite like the one the Trump lost with the Judge effectively telling the jury to find Trump guilty.