Hang ‘Em High! US Treasury 10Y-2Y Yield Curve Inverts To Near Lowest Since 1981, Credit/Equity Spread Turns Positive As Fed Tightens Monetary Noose

Hang ’em high!

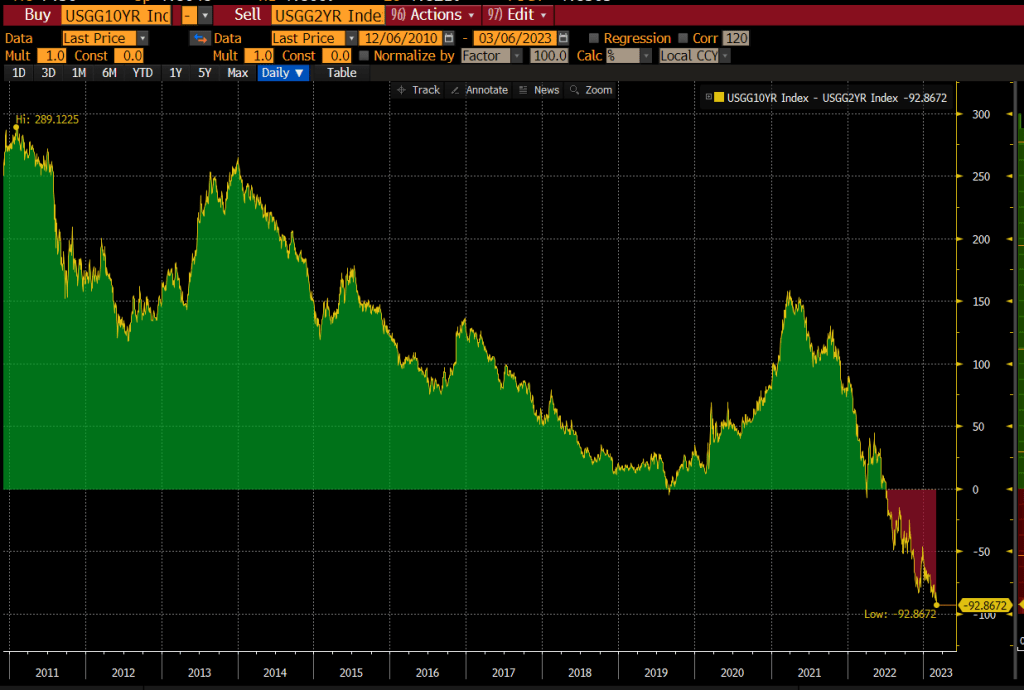
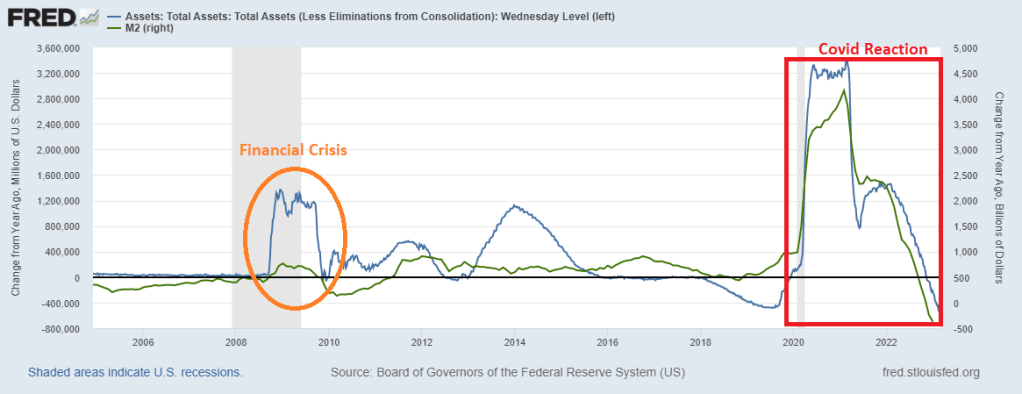
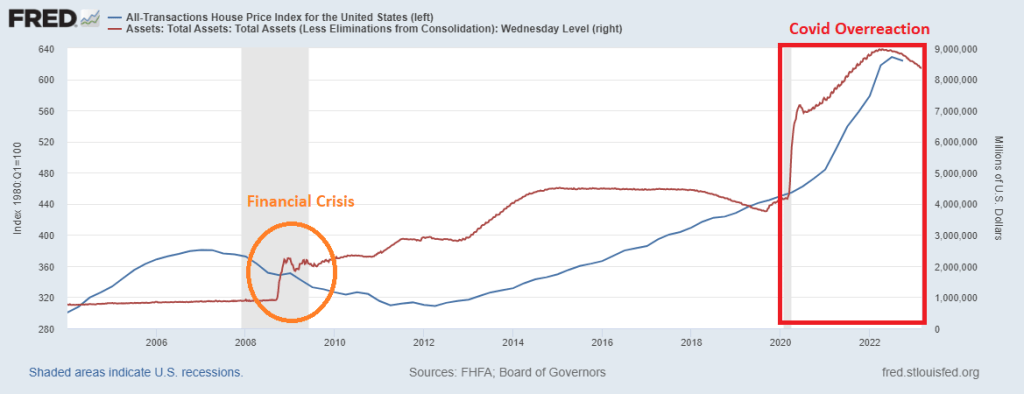
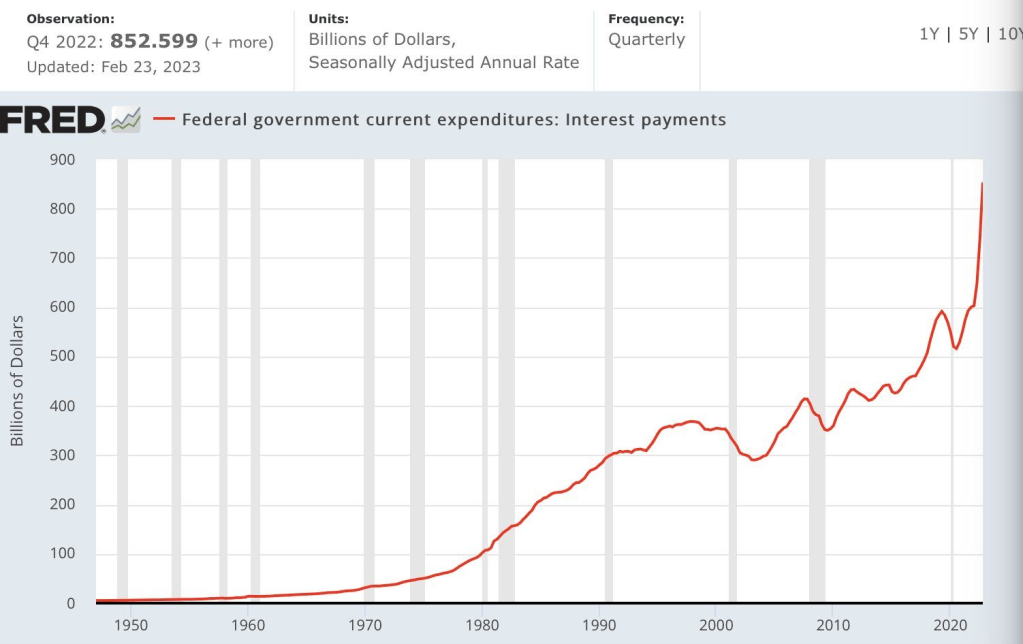
As inflation remains persist (thanks to endless Fed stimulus and endless Federal spending splurges), we are seeing The Federal Reserve finally withdrawing the monetary stimulus (tightening the monetary noose). And with it, the US Treasury yield curve (10Y-2Y) goes down with it.

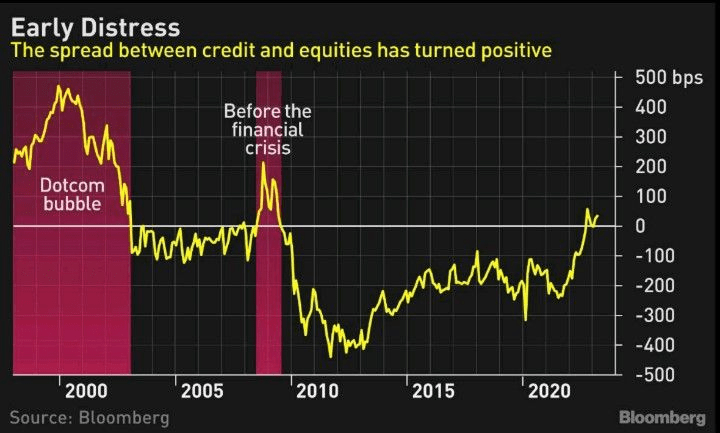
Another sign of distress is the spread between credit and equities which has turned positive as it does in times of crisis.

UPDATE! Recession predictor the US Treasury yield curve just went “red alert”, inverting to -100 basis points.

Price Of Insuring Against US Debt Default Highest Since Last Debt Ceiling Crisis In 2013 (Debt Up 88% Since The Last Crisis, $182 In Unfunded US Liabilites)

The last US debt crisis occured in 2013 when Congress finally raised the debt ceiling … and kept on borrowing and spending, But if you thought that a debt crisis would scare Congress (and the Administration) into balancing the Federal budget, you would be wrong. In fact, since the 2013 debt crisis, Federal debt is up 88% (+$14.7 TRILLION over the last 10 years).

And with the massive growth in Federal debt under Obama, Trump and Biden has resulted in an explosion in interest payments on the Federal debt.

And with $182 TRILLION in UNFUNDED liabilities, the debt issuance won’t stop.

Let’s see what is in Treasury Secretary Janet Yellen’s bag of tricks.

LIBOR cracked 5% for first time since 2007.

And the US Treasury 10Y-2Y yield curve is the most inverted since 1981.

Is Janet Yellen the “evil woman” from Crow’s song?

Sink The Economy! S&P 500 Down -6% Since Fed Started Raising Rates On May 4, 2022, Equity REITs Down -16% (Pension Pain From Interest Rate Increases)

Interest rates are an important driver of the economy and financial markets. And what has happened to the S&P 500 index since The Federal Reserve started raising their target rate on May 4, 2023 to fight surging inflation?

Since that fatal day, the S&P 500 index has fallen -6% and equity REITs (commercial real estate) has fallen -16%.

What about returns on US Treasuries and Mortgage-backed Securities (MBS)? Same thing. PAIN!

Although The Fed has pledged to keep raising rates to fight inflation (and further decimate retirement accounts), investors are pointing to a peak (terminal) Fed rate of 5.44% at the September 2023 FOMC meeting. Then rate cuts following the September 2023 meeting.

Of course, much of the blame belongs to former Fed Chair Ben (QE) Bernanke and current Treasury Secretary Janet “Too Low For Too Long” Yellen who never met a Fed rate hike that she liked. But Yellen LOVES giving away US taxpayer dollars … to Ukraine.

Give The Fed 3 Steps! The Fed’s Overreaction To Covid Shutdown (Over Twice The Reaction To The Crippling Financial Crisis Of 2008/2009)

There is a fascinating film about the 2008/2009 financial crisis called “The Big Short.” Actually, Iiked a similar film a little more called “Margin Call” where the infamous fire sale of securities (primarily subprime asset-backed securities).

But despite how bad the financial crisis of 2008/2009 was, the growth of Fed assets on it balance sheet (orange oval) paled in comparison to The Fed’s overreaction to the Covid outbreak of 2020. And the government shutdowns and mask mandates.

The good news? The rate of growth YoY of both The Fed’s balance sheet and M2 Money is negative. But it is still startling to see the comparison of Fed reactions to crises.

Give The Fed three steps to catch up to the mayhem they created. Particularly in inflation home prices.

They call Janet Yellen, former Fed Chair and current Treasury Secretary “The Breeze” because idiotic monetary policies just blow over her head.

After all, The Fed is way behind the curve on raising rates.

All this is happening as the interest paid on our rapidly expanding Federal debt is getting Titanic-like.

US Mortgage Rates Rise To Over 7% As Fed Tightens Monetary Noose (Is Powell Chanelling Volcker?)

Yesterday’s inflation report (in the form on skyrocketing labor costs) helped lead Bankrate’s 30-year mortgage rate to over 7% … again.

Here is yesterday’s horrible unit labor costs YoY chart showing the fastest growth in labor costs since 1982 and Fed Chair Paul Volcker. Jerome Powell, the current Fed Chair is trying to reduce the Bernanke/Yellen/Powell monetary stimulypto (with an extra dose of “sugar” from the Covid outbreak).

The good news is that the 10-year Treasury yield is down -7.3 basis points this morning.

Here is The Fed’s Open Market Committee (FOMC) trying to summon Paul Volcker to help them figure out how they got inflation so wrong.

Inflation Alert! US Unit Labor Costs Soar in Q4 2022 To 3.2%, 2x Expectation Of 1.6%, UP 6.50% YoY (The Worst In 30 Years)

Despite Treasury Secretary Janet Yellen claiming that inflation was only transitory and likely to disappear, we are seeing continued inflation. Now we see that Unit Labor Costs are up 3.2% QoQ for Q4 2022.

Even worse, US unit labor costs rose 6.5% on a year-over-year (YoY) basis, the WORST since 1982.

And yes, Q4 2022 unit labor costs are up 2x the expectations.

In normal times, The Federal Reserve would raise rates to cool down the economy. The Taylor Rule suggests a Fed target rate of 10.59% versus the current Fed rate of 4.75%. A long way to go!!

Damn it, Janet!

Dazed And Confused! Treasury Flows Show Bullish $2.5 Billion Shift to ST Sovereigns Versus S&P 500 (Credit ETFs Hammered by Record Outflows of Almost $12 Billion As Fed Worries About Inflation)

The Federal Reserve is dazed and confused about inflation.

As The Federal Reserve reaffirms their draining of the monetary punch bowl, we are seeing investors flock towards the bond market. Particularly the iShares Short Treasury ETF. $2.5 BILLION to be exact.

Meanwhile, credit ETFs are hammered by record outflows of almost $12 Billion.

The reason why? Inflation remains elevated which is leading The Fed to keep their foot on the monetary brake pedal.

I’m an economist.

Mortgage Purchase Demand Decreases, Lowest Level Since 1995 As Fed Removes Punch Bowl (Punch Bowl To Dust Bowl)

Today’s mortgage application (demand) numbers from the Mortgage Bankers Association was disappointing to say the least. Mortgage purchase demand just sank to it lowest level since 1995.

Typically, mortgage purchase applications peak in May or June of each year before beginning their annual lemmings drive downwards. But this year is seeing a early turn for the worse.

The unadjusted Purchase Index decreased 3 percent compared with the previous week and was 44 percent lower than the same week one year ago. The Refinance Index decreased 6 percent from the previous week and was 74 percent lower than the same week one year ago.

The Fed is hell bent on removing the punch bowl to fight inflation. Looks like Biden’s economic plan is turning the punch bowl into a dust bowl.

Uh-oh! January Personal Consumption Expenditures Soar 1.8% MoM, PCE Deflator UP 5.4% YoY, 2-year Treasury Yield Rises 10 Basis Points (Here Comes The Fed!)

Not really a surprise, but January’s personal spending numbers came in hot at 1.8% MoM. Also, Personal Consumption Expenditures PRICE index (aka, inflation) rose to 5.4% YoY.

Here comes The Fed! The 2-year Treasury yield rose 10 basis points this morning.

Pelsoi and Schumer (with McConnell) got the gold mine and American consumers got the shaft.

Is That All There Is? US Q4 Real GDP Up Only 0.91% YoY Despite $54.8 TRILLION In Federal Debt (+36%) Added Since January 2020

The US Federal government reminds me of the Peggy Lee song “Is That All There Is?” Since the outbreak of Covid in 2020 and the absurb spending spree by Pelosi and Schumer, the Federal government has increased their debt by 36% to help pay for the Federal spending spree. That amounts to $54.8 TRILLION in additional Federal debt since January 2020.

What did the US economy get for all that Federal spending? In Q4 2022, Real GDP rose by … 0.91% YoY. Seriously? Is that all there is from $54.8 TRILLION in additional Federal debt?

What do you expect when low-life lobbyists shuffle in and out of Congressional offices and the White House. Lobbyists don’t represent middle class America, but represent the elites.

Another bit of lousy news. Look at the trend in S&P 500 Earnings Surprise (5 year).

On the housing front, the US housing market was hit with the biggest six-month wipeout since 2008.

At least US Transportation Secretary “Pothole Pete” Buttigieg FINALLY showed up (three weeks after that East Palestine Ohio train disaster). Here is Buttigieg practising for his press conference.