The U.S. breakeven 10 year (USGGBE10 Index) went above 3% for the first time EVER.
Breakeven inflation is the difference between the nominal yield on a fixed-rate investment and the real yield (fixed spread) on an inflation-linked investment of similar maturity and credit quality.
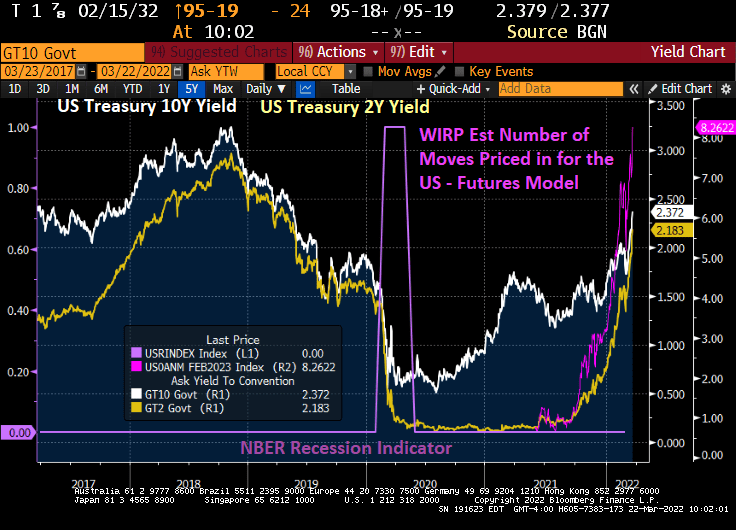
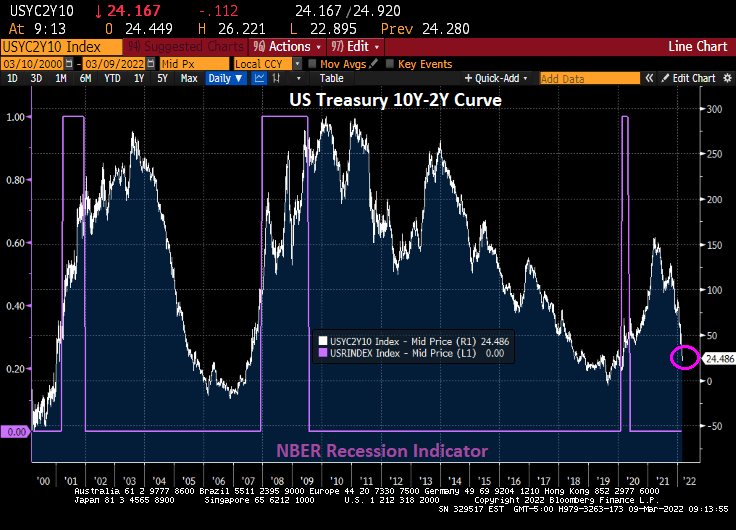
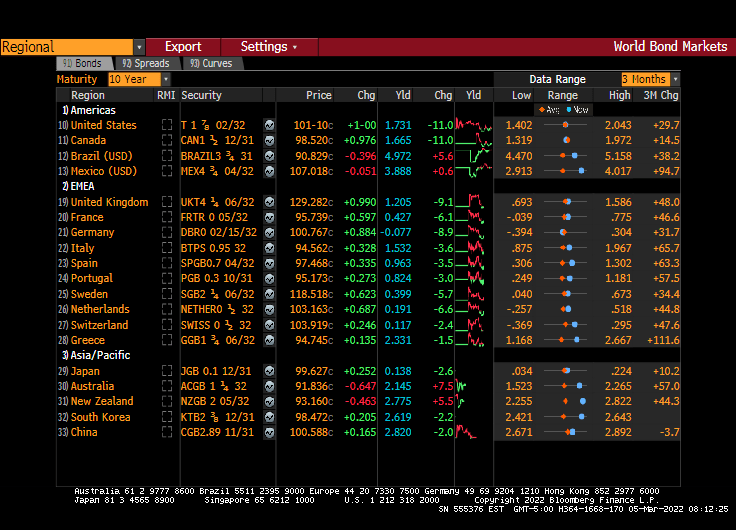
The US Treasury yield curve (10Y-2Y) is rapidly approaching inversion at 20.5 bps (where the 10-year yield is lower than the 2-year yield). But the 10Y-3M curve is generally steepening at 173.33 bps.
Of course, the driving force behind the flattening of the 10Y-2Y curve is the rapidly rising 2-year Treasury yield (orange line). The last time the 10Y-2Y curve inverted was in 2019, prior to the COVID outbreak in early 2020.
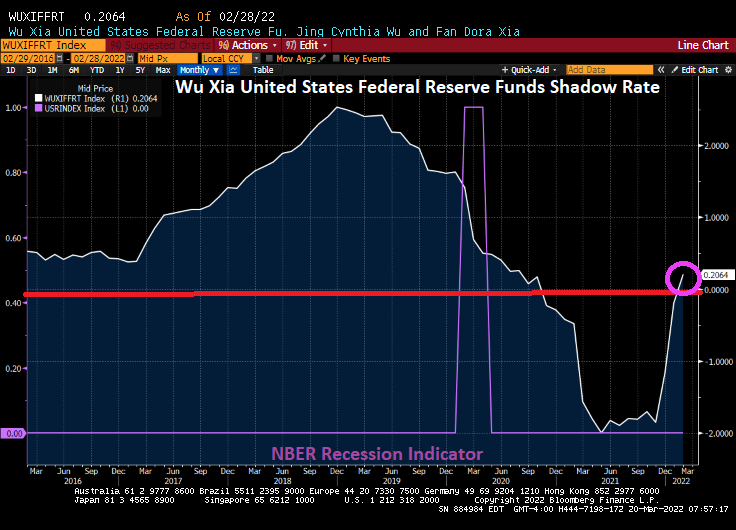
The Wu Xia United States Federal Reserve Funds Shadow Rate has finally climbed back into positive territory.
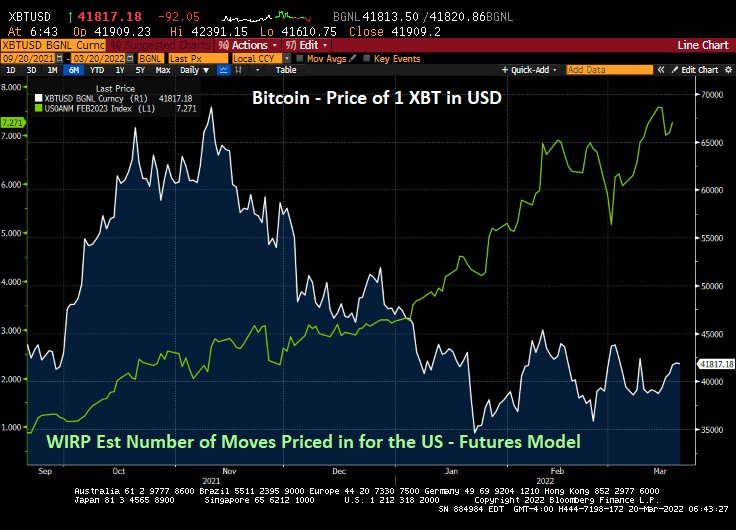
At last look, The Federal Reserve is forecast to raise their target rate 7 times over the coming year. And with the increasing forecast of rate hikes, we are seeing the cryptocurrency Bitcoin fall from near $70,000 to $41,817.
President Biden announced that he will be issuing an executive order to combat rising energy prices (the rising energy prices that he caused in the first place with … executive orders). Let’s see what happens next.
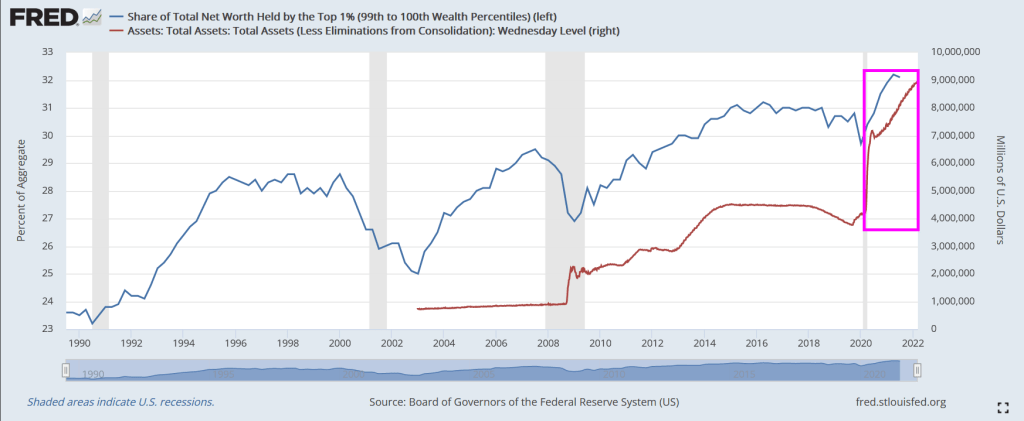
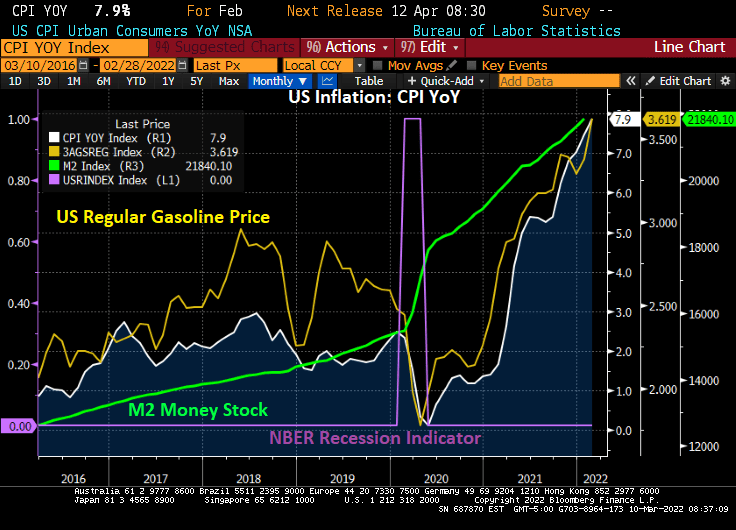
Following the financial crisis of 2008/2009, The Federal Reserve began their dramatic purchase of assets such as Treasuries and Agency mortgage-backed securities (AgencyMBS). And then Covid struck and The Fed went berserk with asset purchases.
So, who benefited the most? The top 1% or the bottom 50%?
Answer? The top 1%. The share of total net worth spiked dramatically after the Fed infusion.
Even the bottom 50% benefited with The Fed’s Covid stimylpto, but no where near how the top 1% benefited.
World Economic Forum’s elitist Klaus Schwab approves of this message!
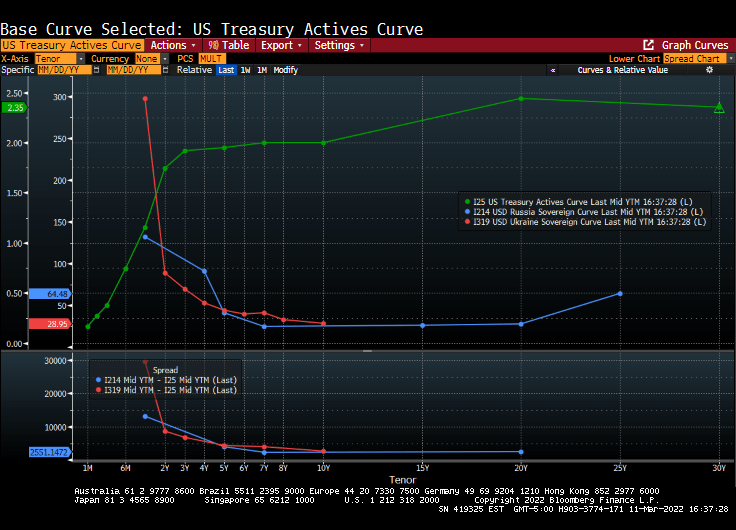
On an unrelated note, the US Treasury yield curve is strongly UPWARD sloping, while Russia’s and Ukraine’s yield curves are inverted and collapsing.
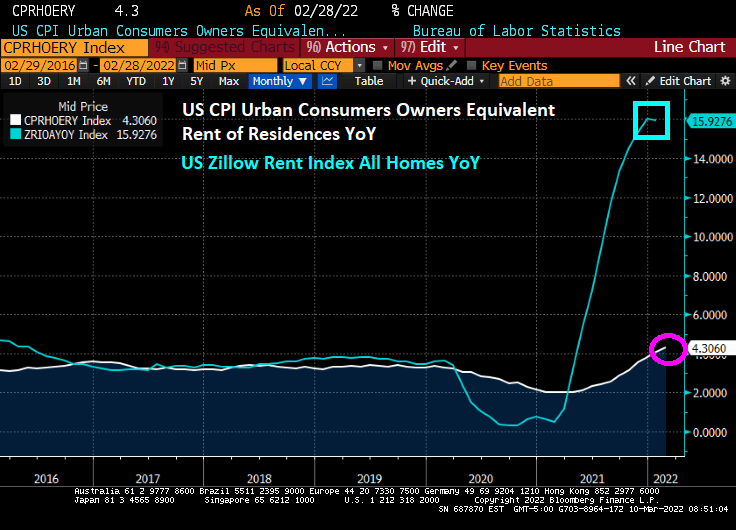
US rent inflation (owner’s equivalent rent of residence YoY) surged to 4.30%. However, Zillow’s rent index last month was 15.93% YoY.
But if we look at US Monthly Rent YoY, we see that rents are climbing at a 17.6% rate.
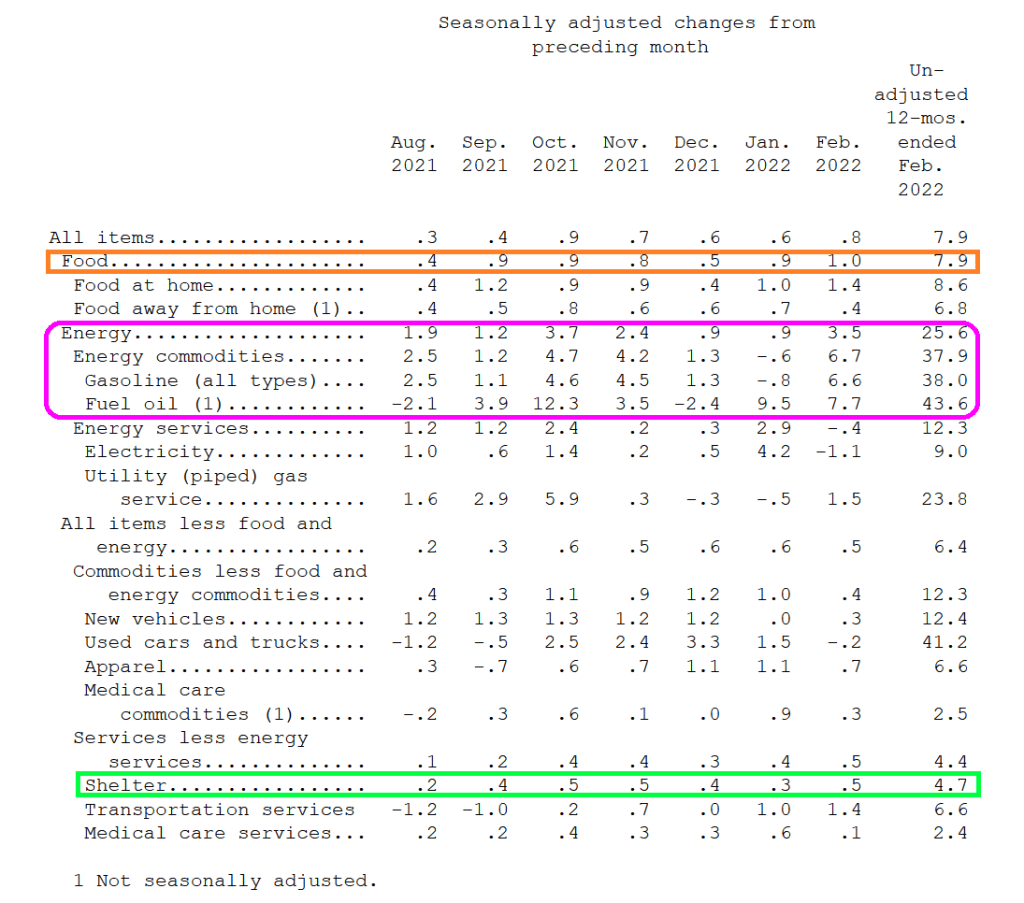
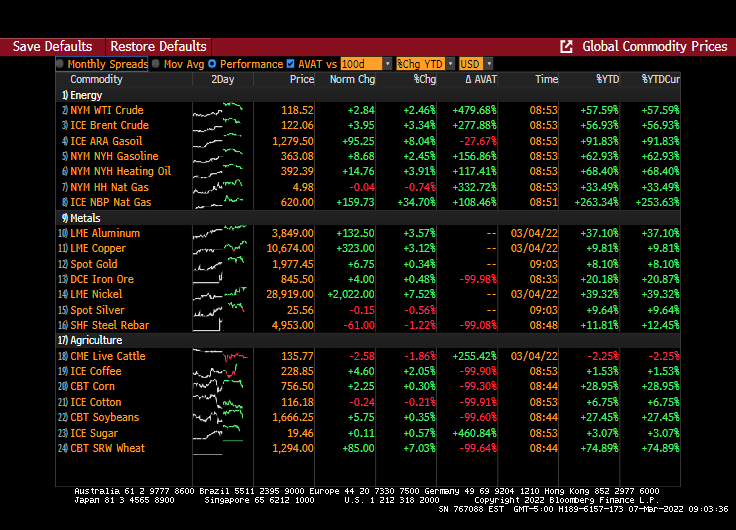
Energy costs soared in February YoY. Gasoline was up 38%. Fuel Oil was up 43.6%. Food was up 7.9%.
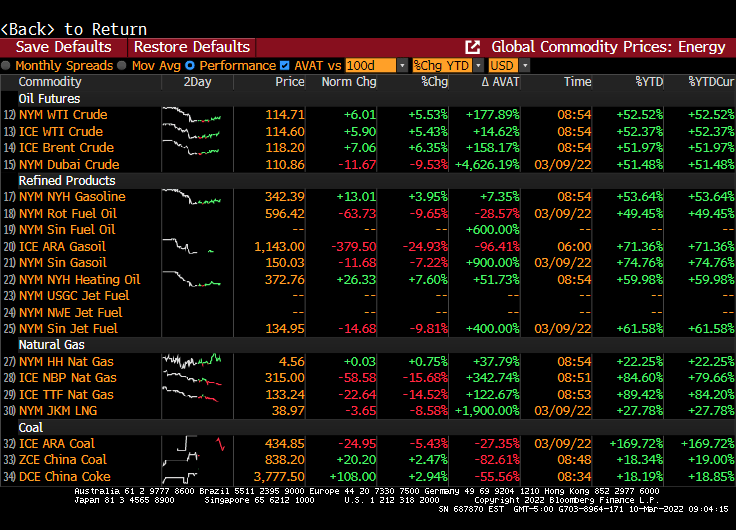
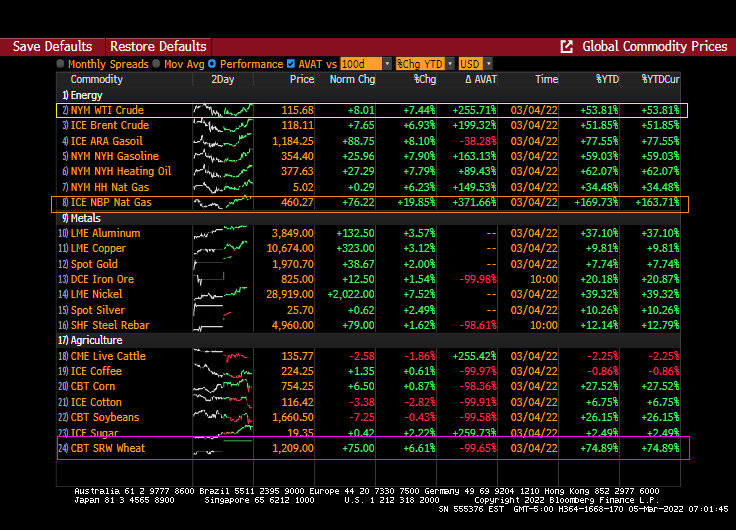
Volatility (AVAT) rages in the energy sector.
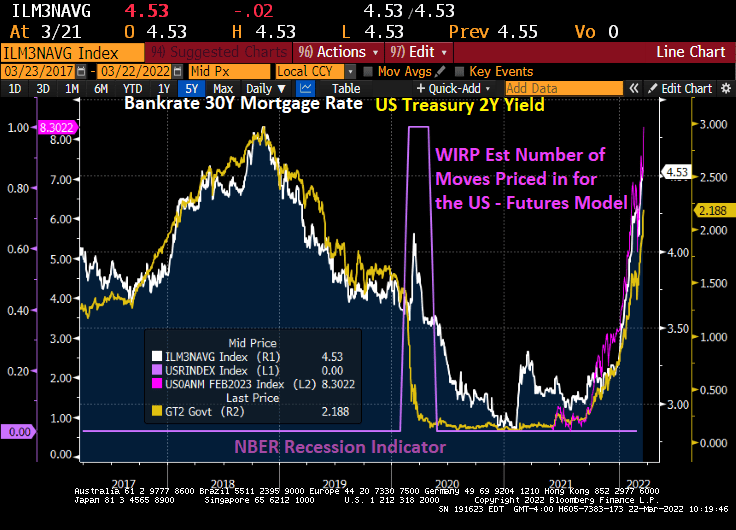
There are still 7 rate hikes in the cards from The Federal Reserve.
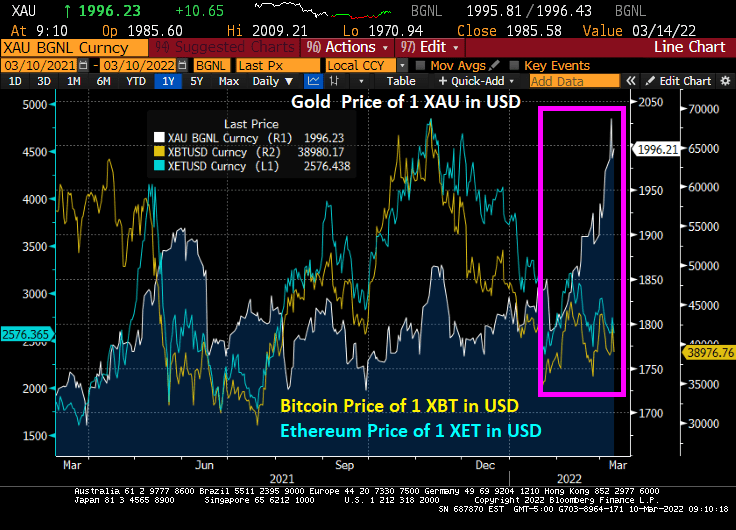
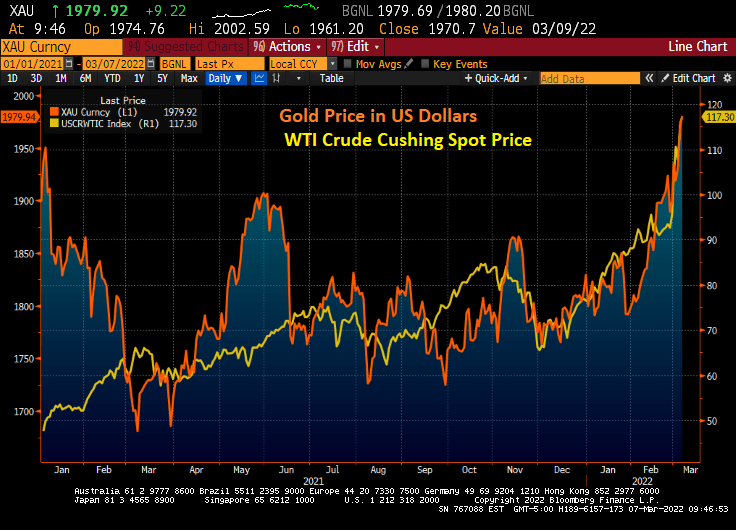
Gold has been climbing as Russia invades Ukraine. Cryptos Bitcoin and Ethereum are steady, even as the Biden Administration issues an executive order to “study” cryptocurrencies.
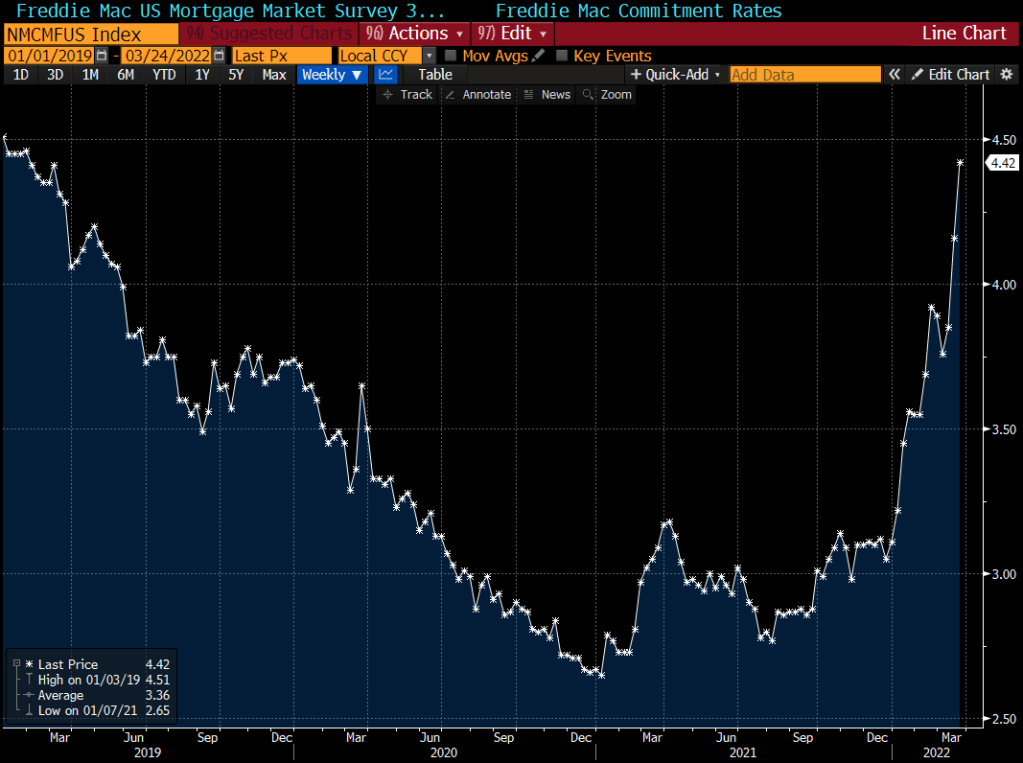
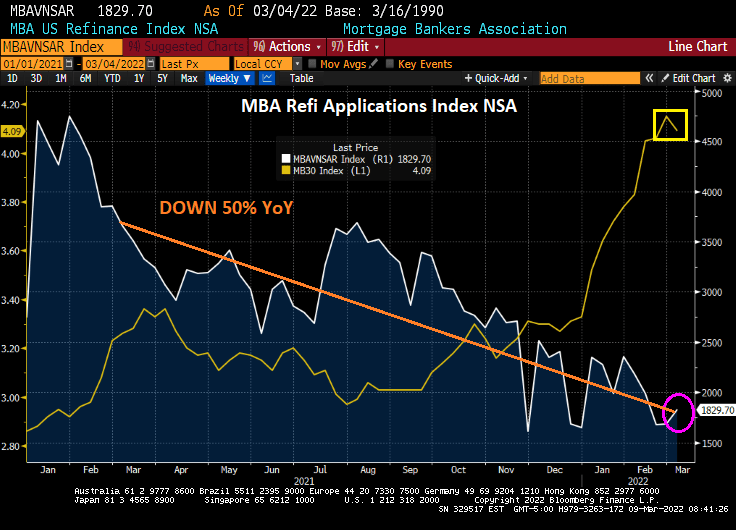
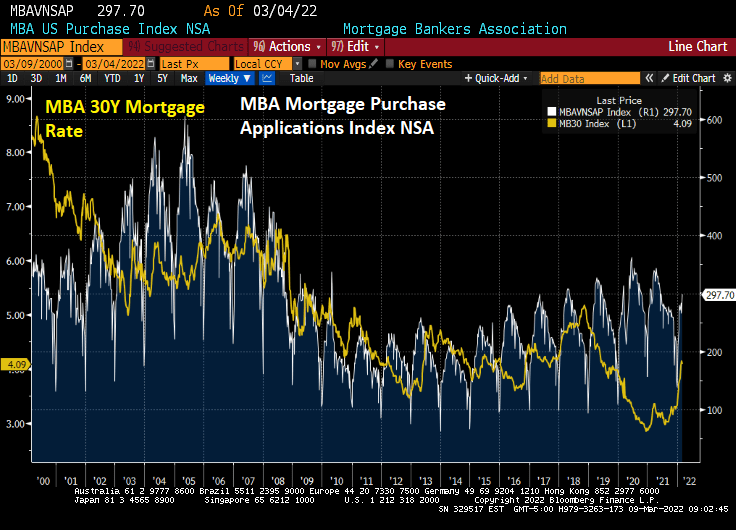
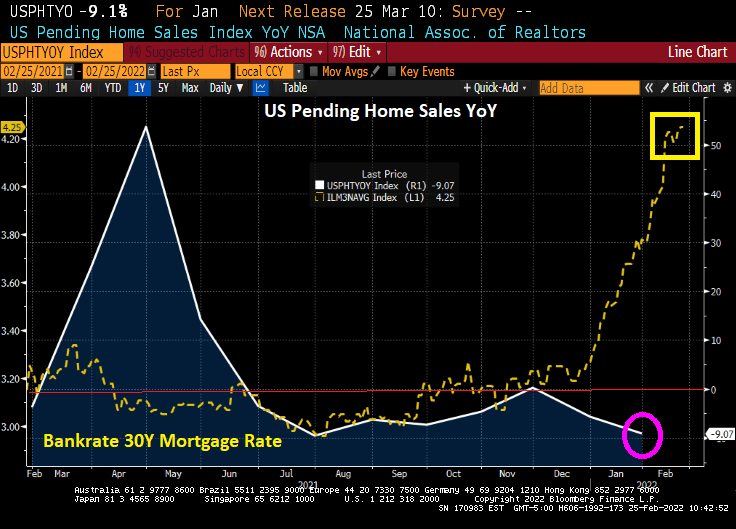
The mayhem caused by the Russian invasion of Ukraine is helping drive down interest rates … for the time being … and this is helping push down mortgage rates and increase mortgage applications.
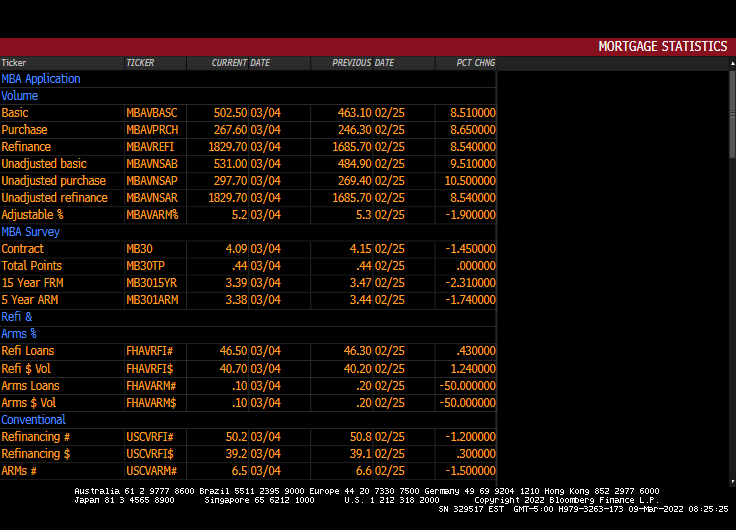
Mortgage applications increased 8.5 percent from one week earlier, according to data from the Mortgage Bankers Association’s (MBA) Weekly Mortgage Applications Survey for the week ending March 4, 2022.
The seasonally adjusted Purchase Index increased 9 percent from one week earlier. The unadjusted Purchase Index increased 11 percent compared with the previous week and was 7 percent lower than the same week one year ago.
The Refinance Index increased 9 percent from the previous week and was 50 percent lower than the same week one year ago. Diane Olick at CNBC has the hilarious headline “Brief drop in mortgage rates sparks mini refinance boom.” The slight rise in refi applications from the previous week is more of a firecracker going off than a boom given that refi apps are still down 50% from the same week last year.
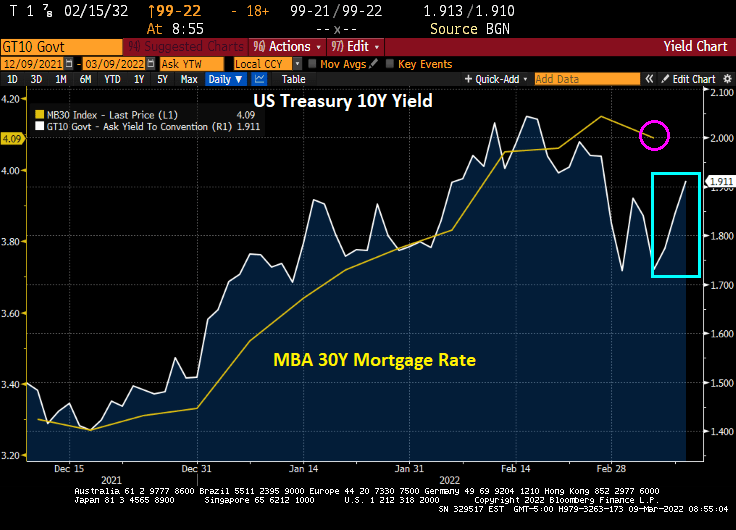
Bear in mind that the US Treasury 10-year yield is up since the MBA’s reporting week ended on March 4, 2022. So, look for Olick’s mini-refi boom to end as quickly as it started.
Here is the rest of the MBA story.
The MBA Mortgage Purchase applications index typically peaks in mid-to-late April, so we still have another month (seasonality) until purchase applications begin declining again.
The US Treasury 10Y-2Y curve continues to flatten and is the worst curve recovery in modern history.
The general rise in US mortgage rates is more closely tied to expectations of Fed rate increases than Fed Agency MBS holdings.
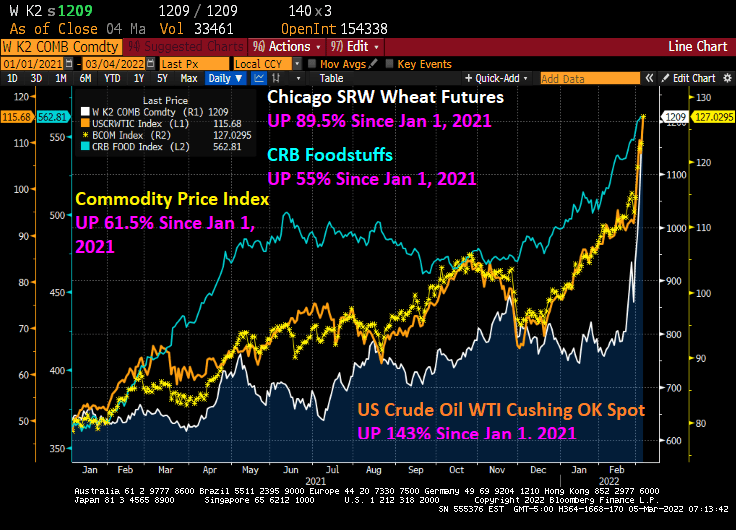
WTI Crude Oil spot price was up 91% from the beginning of 2021 to the Russian invasion of Ukraine. Now it is up 142% thanks to the invasion of Ukraine.
Energy prices are still soaring with UK Natural Gas prices up another 34.70% today with Brent Crude futures up 3.34%. Wheat futures are up 7.03%.
The US Treasury 10Y yield rose 6.8 bps this morning (UK takes the lead with a 10.3 bps increase).
The US Treasury 10Y-2Y yield curve slope continues to swoon to where it is now flatter than when President Biden entered office.
Gold is now at it highest level since before Biden was sworn-in as President as WTI Crude Oil soars.
Gold hit $2,000 before retreating back down.
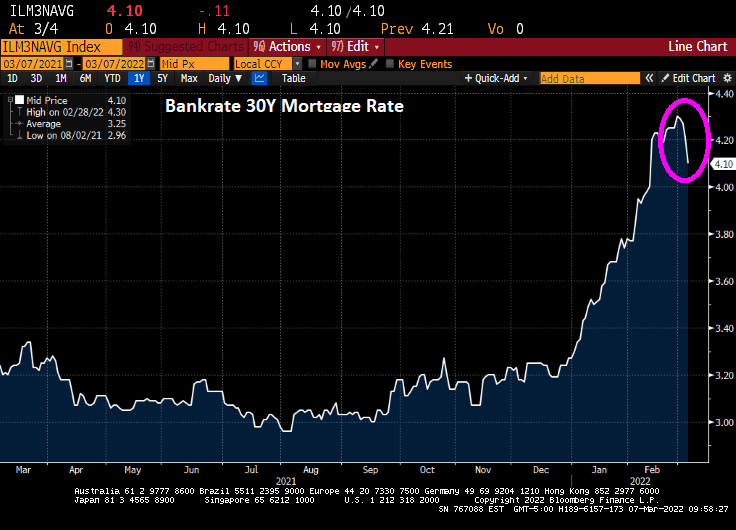
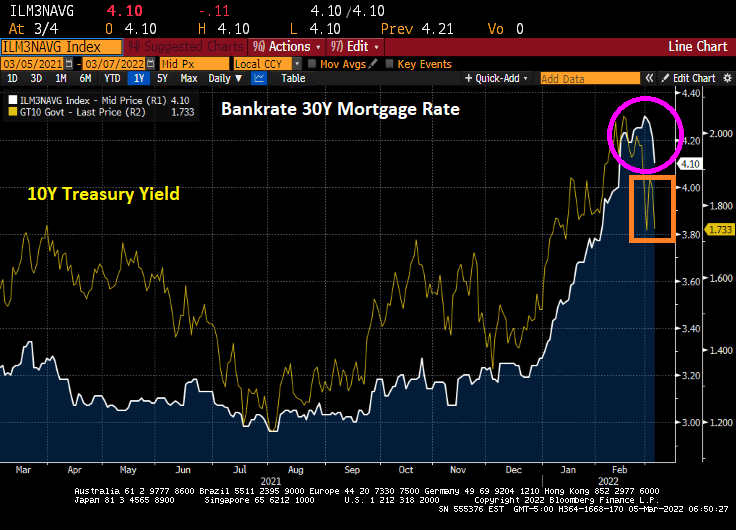
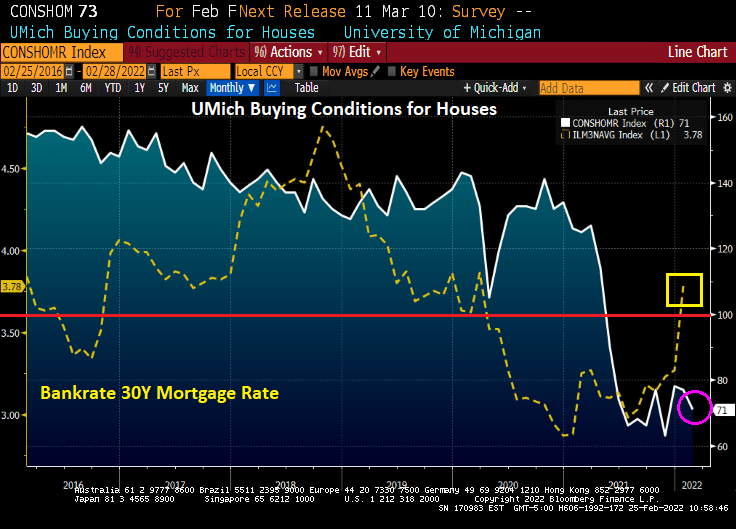
And Bankrate’s 30Y mortgage rate declined to 4.10%.
Russia is the world’s largest exporters of wheat and Ukraine is the 5th largest exporter.
This has been a brutal week for consumers. With the Russia/Ukraine conflict raging and Congress seems determined to not allow for additional oil and gas production, and Biden’s anti-fossil fuel edicts still in place, we are seeing dramatic price increases in wheat (UP 89.5% since January 1, 2021), WTI Crude (UP 143% since January 1, 2021), and food stuffs (UP 55% since January 1, 2021).
Bankrate’s 30-year mortgage rate has actually been falling the last several days, which is good for prospective home buyers as the 10-year US Treasury Note yield has been declining.
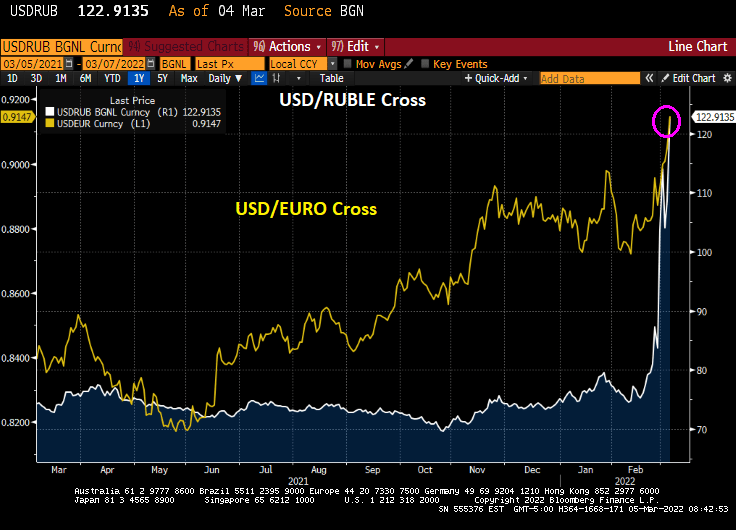
The USD/Russian Ruble cross is skyrocketing and the USD/Euro is doing likewise. Russians visiting the US will find that their trip is suddenly unaffordable (as do many American citizens will its rampant inflation). As Bruce Willis said in “Die Hard,” “Welcome to the party, pal.”
On Friday, the US Treasury 10-year yield declined 11 bps.
And energy prices continue to soar, particularly UK Natural Gas Futures that rose 19.85% overnight.
The US inflation data will be released on March 10th and the consensus is that February CPI inflation will rise to 7.9% YoY.
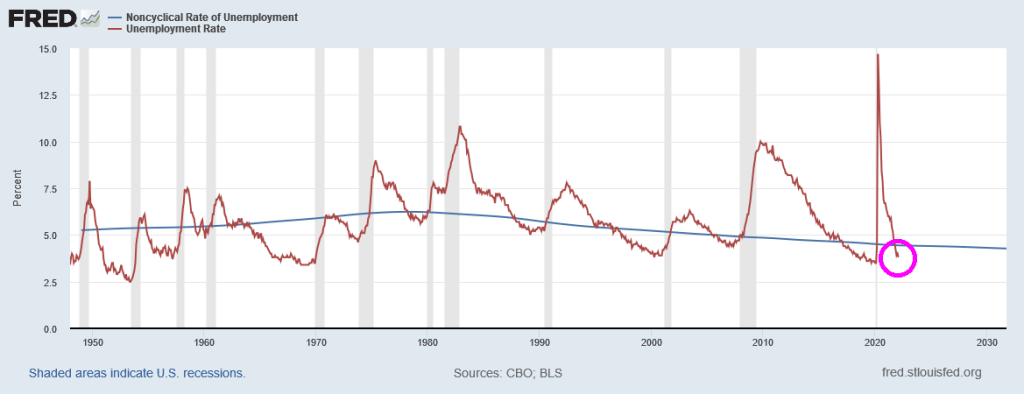
But even the latest unemployment rate report (3.8%) is signalling that The Fed should be raising interest rates since it is lower than the Natural Rate of Unemployment or NAIRU (4.44%).
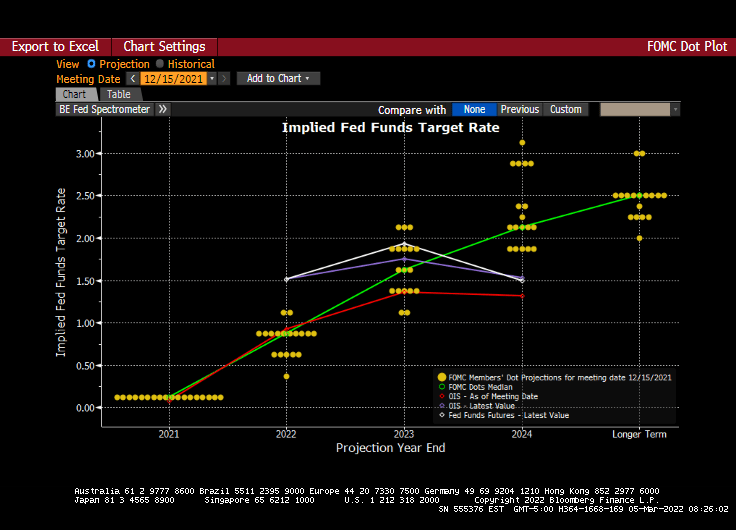
And we have the next Fed policy error on March 16th. The Fed dots plot looks like the glide slope for an aircraft, but the message is that rates will be going up at future meetings.
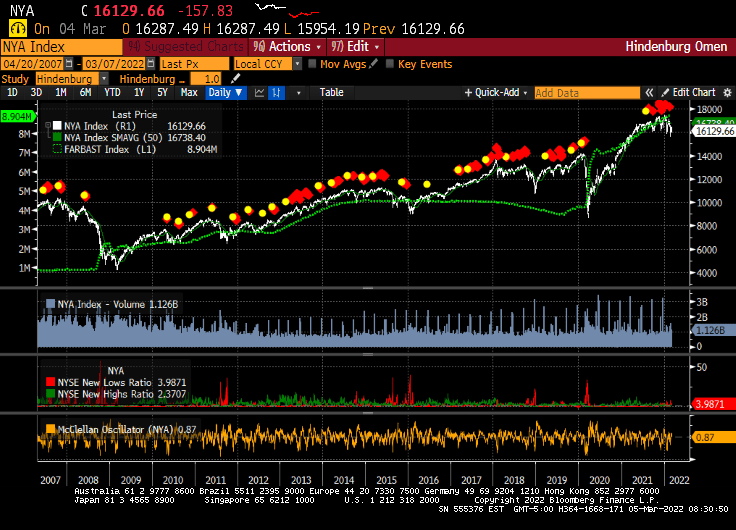
And just for amusement, I present to you the infamous Hindenburg Omen chart that forecast the 2008/2009 stock market correction. Since that correction, the Hindenburg Omen has been flashing “danger” but the only correction was the COVID-linked correction of early 2020. While the Hindenburg Omen is flashing red right now, The Federal Reserve’s balance sheet (green line) has protected against market corrections. Let’s see what happens if and when The Fed decides to remove the epic monetary stimulus.
Its anyone’s guess as to whether The Fed will actually tighten monetary policy.
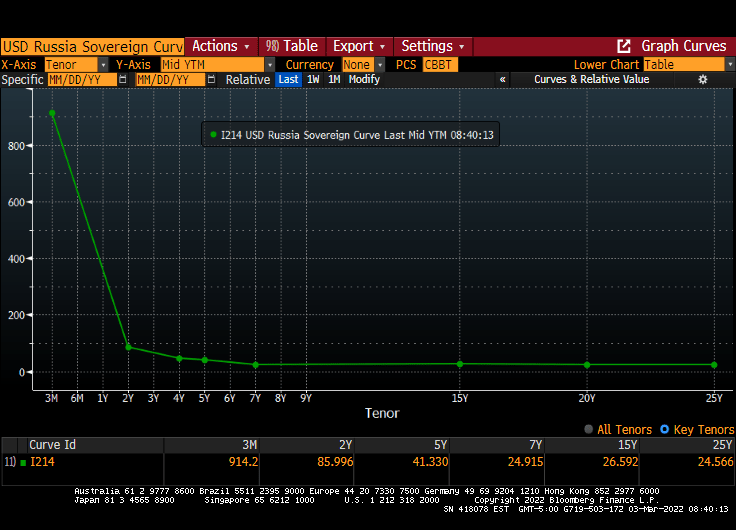
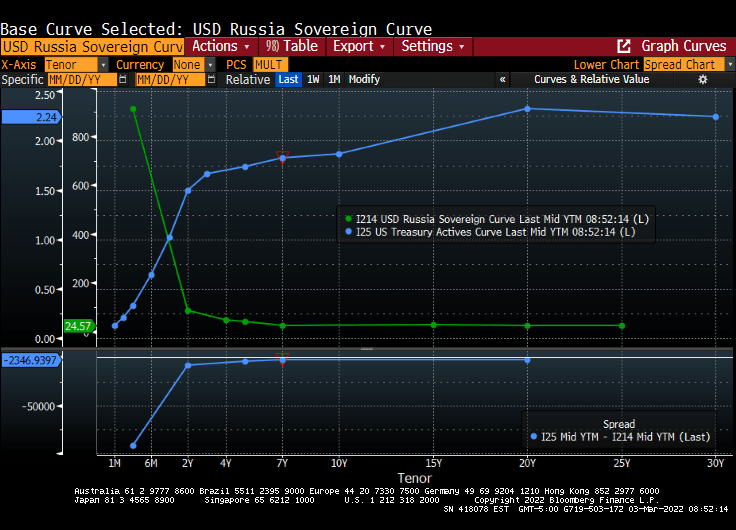
The US still has a steeply upward-sloping yield curve, but Russia has the exact opposite: a steeply downward-sloping or inverted yield curve.
Here is a comparison of the US Treasury Actives curve (steeply-upward sloping) compared to Russia’s sovereign curve (steeply-downward sloping).
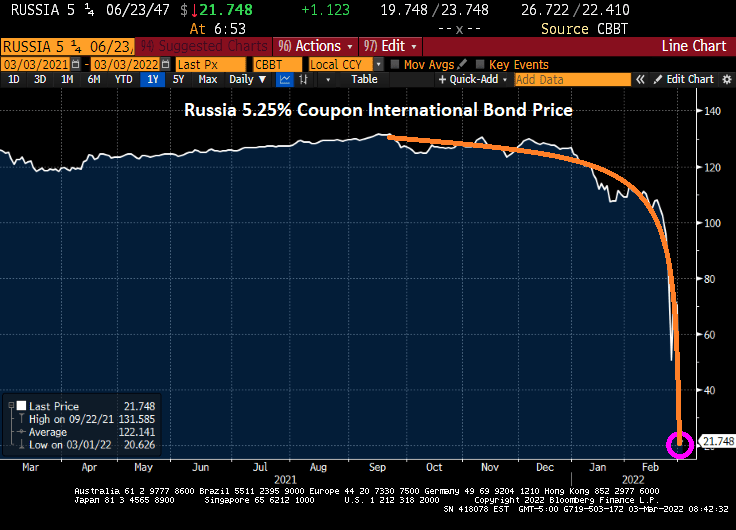
Russia’s technical default on international bonds has led to its 5.25% coupon international bond (denominated in Euros) to plunge from 131.6 in September 2022 to only 21.75 this morning.
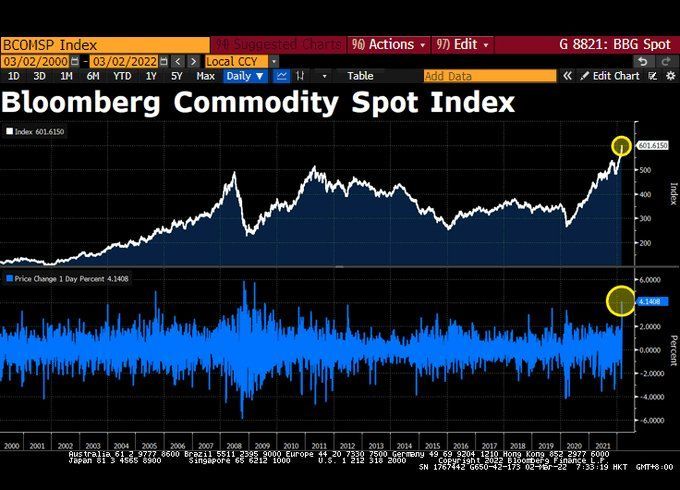
Commodity prices? Commodity prices saw the biggest one-day gain in 13 years on Tuesday.
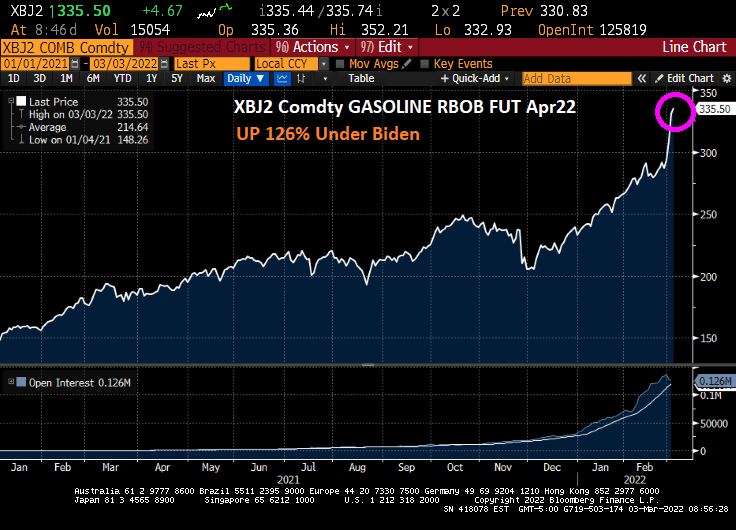
Between Biden’s anti-fossil fuel executive orders and the Russian invasion of Ukraine, gasoline futures are up 126% since the start of January 2021.


You must be logged in to post a comment.