I learn something new everyday. Like Biden yesterday claimed has was VP during Covid (uhm, Covid was in 2020 and Biden left the office of VP in 2017). But nothing gets in the way of Biden and a good story! Like his whopper that he inherited 9% inflation from Trump (even CNN fact-checked this whopper and found it was false. It was only 1.4%!)
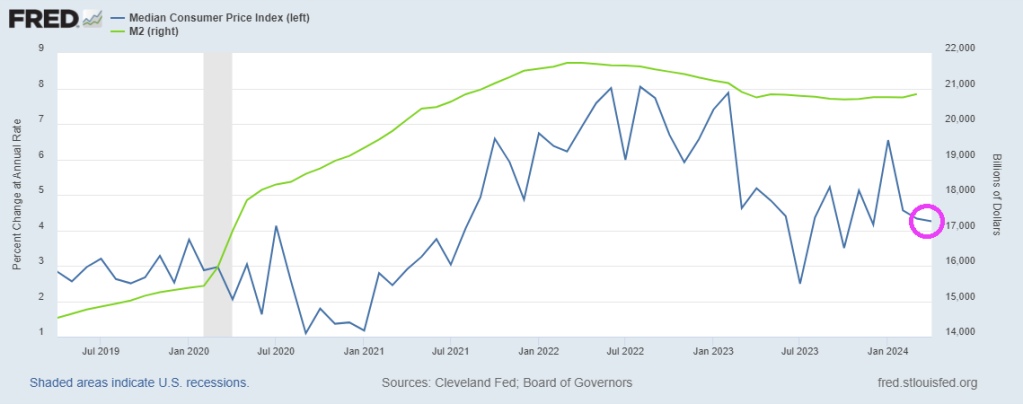
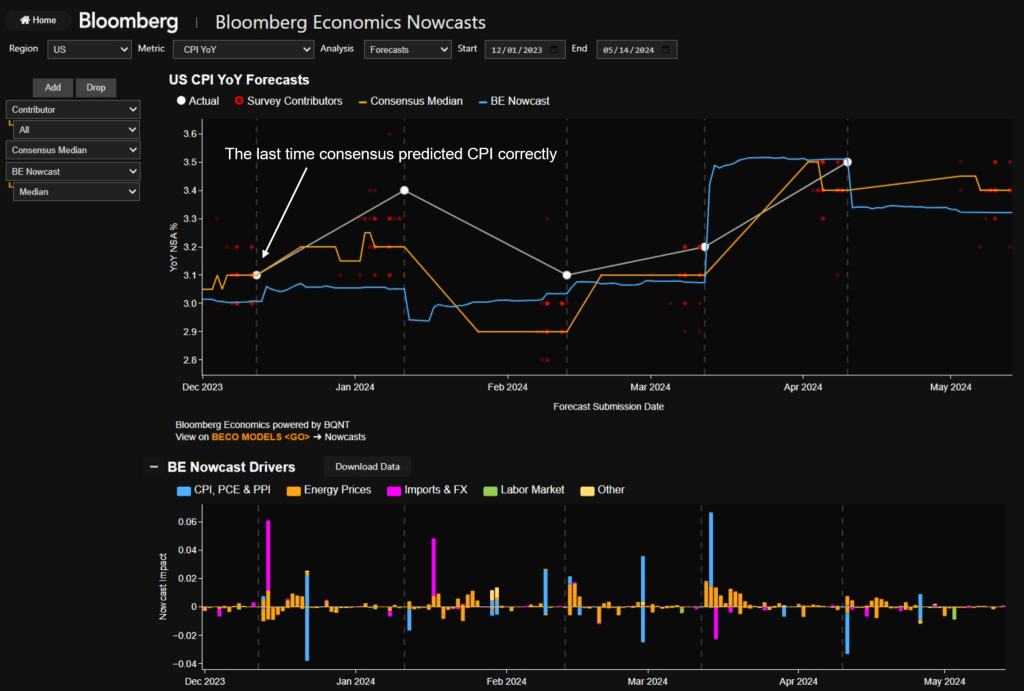
But inflation is still at 4.5%, according to the Cleveland Federal Reserve.
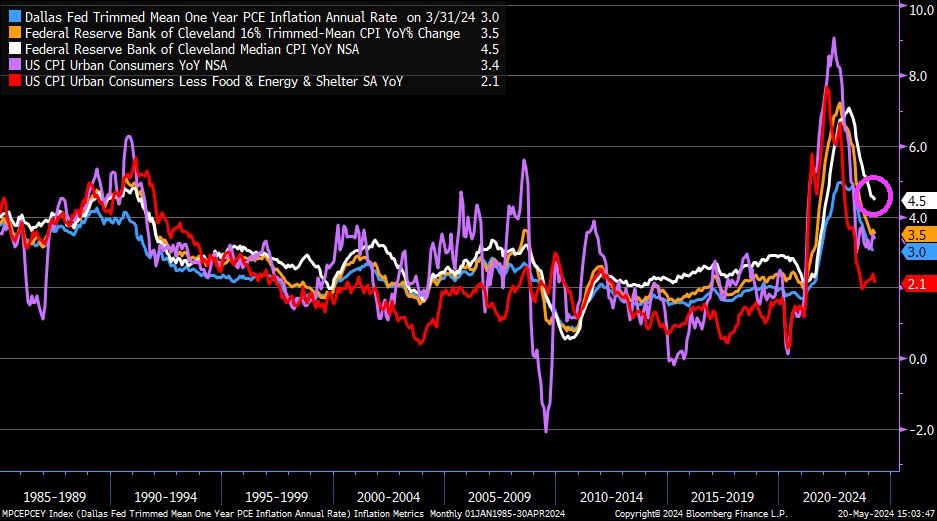
Now, there are many measures of inflation to choose from, from Core CPI of 2.1% YoY to Cleveland Fed’s Median CPI of 4.5%.
The US is on a “Highway to Hell!” thanks to flawed economic policies under Biden.
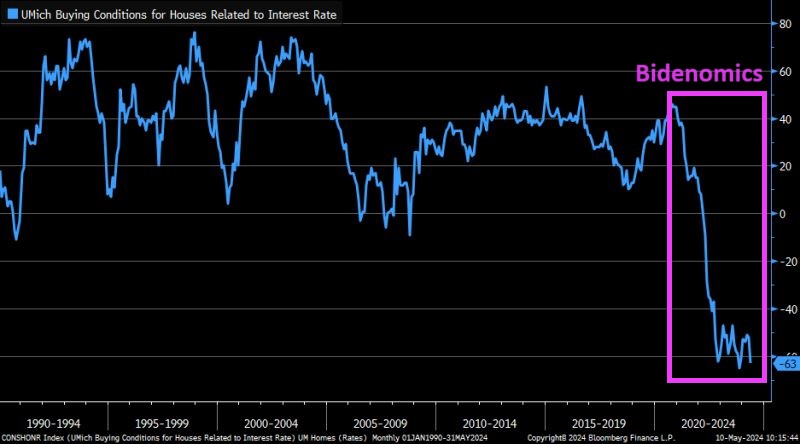
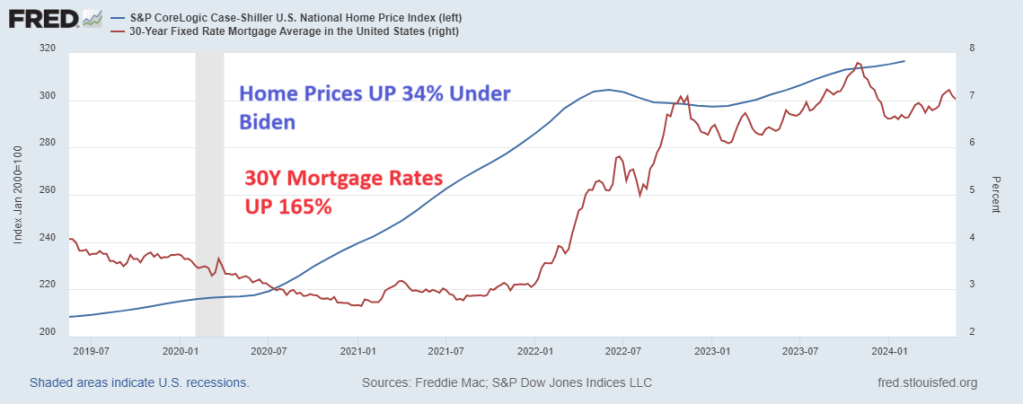
First, interest and mortgage rates under Biden have soared driving buying conditions for housing to all-time lows. Combine sky-high home prices with high mortgage rates and we have as serious affordability crisis.
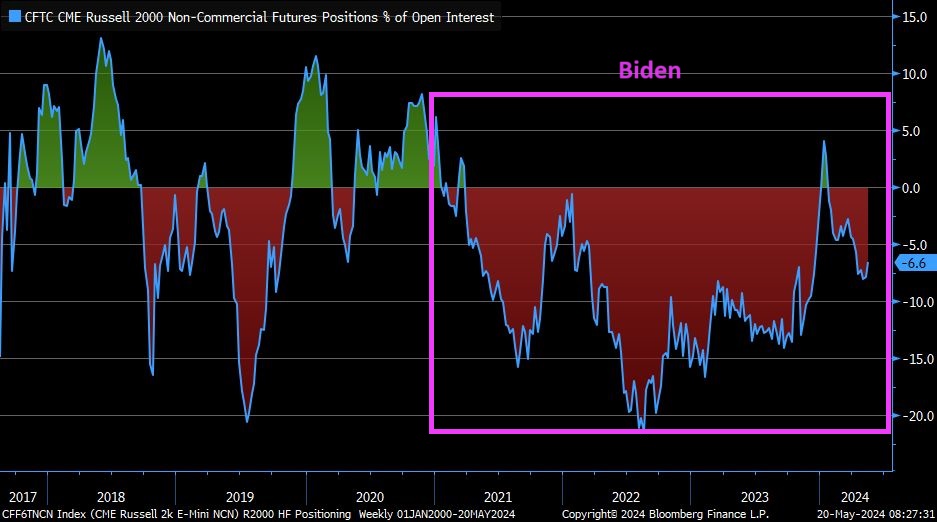
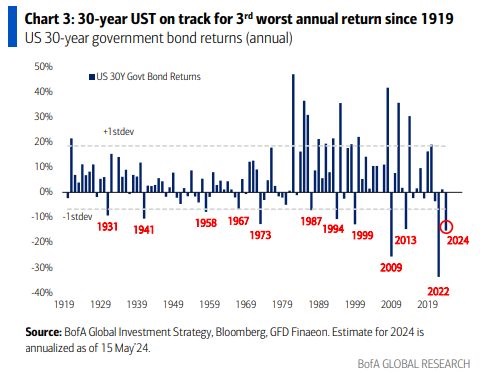
Second, on the interest rate front, the 30-year Treasury bond is on track for the 3rd worst annual return since 1919 and Russia’s invasion of Ukraine. Not not the current invasion, but the 1919 invasion.
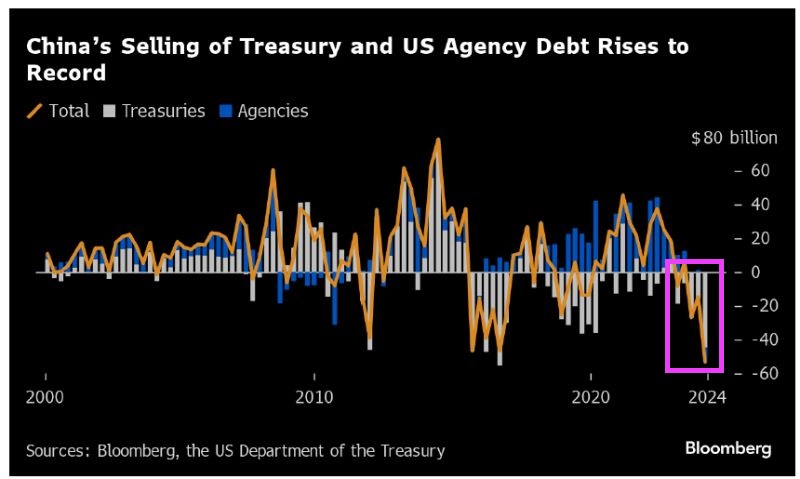
Third, China is dumping their holdings of US Treasuries and Agency Debt at record rates.
Of course, mortgage rates hit 18% in 1981. So, the term high mortgage rates is relative. The US had low rates for too long (Bernanke/Yellen) and mortgage rates are now in the 7% range, up 165% under Biden. And home prices are up 34% since Biden was sworn-in as President. Wow! Mortgage rates up 165% and home prices up 34% under Biden’s Reign of Error.
The US middle class and low-wage workers are back on the chain gang while the top 1% party hearty.
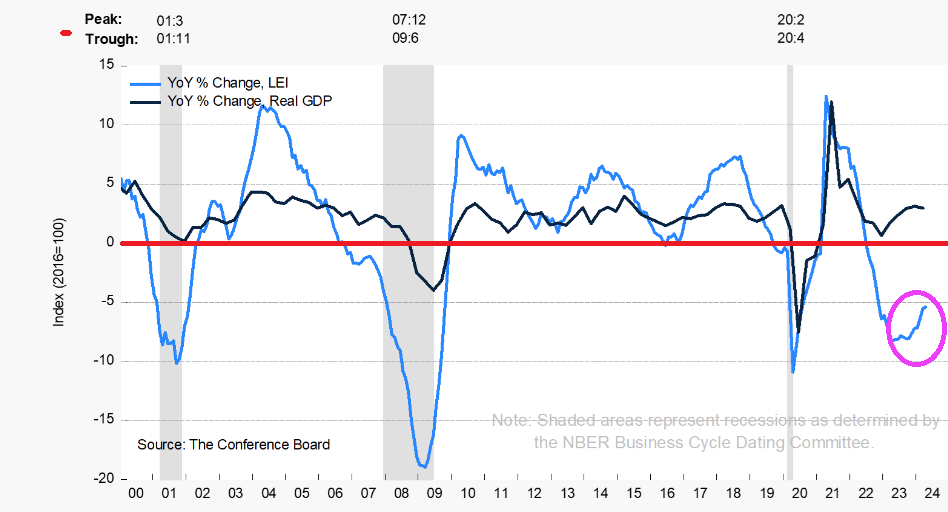
The Conference Board Leading Economic Index® (LEI) for the U.S. decreased by 0.6 percent in April 2024 to 101.8 (2016=100), after decreasing by 0.3 percent in March. Over the six-month period between October 2023 and April 2024, the LEI contracted by 1.9 percent—a smaller decrease than its 3.5 percent decline over the previous six months.
It is surprising that Americans trusts the millionaires in the Administration (like Biden) or Congress (like Schumer, McConnell, etc) to have our backs on the roaring inflation rate. At least Speaker Mike Johnson isn’t a millionaire … yet. But that might explain his selling out conservatives.
Bloomberg reports that PBoC Deputy Governor Tao Ling announced the new 300 billion yuan ($41.5 billion) nationwide program of cheap funding to allow state-owned companies to purchase unsold homes.
Ling said the funding will be directed at 21 providers, including policy banks, state-owned commercial lenders, and joint-stock banks. A rate of 1.75% will be offered. The low-cost loans have a one-year term and can be rolled over four times.
The new program powerfully signals that policymakers are pushing for property policy easing and measures to balance the supply-heavy housing market, which casts a dark cloud over the world’s second-largest economy. This announcement appears to be a step in the right direction in a national-level policy.
Also, on Friday, policymakers eased mortgage rules and removed the mortgage rate floors for first and second homes. PBoC also lowered the minimum downpayment ratio for first-time homebuyers to 15%. The downpayment ratio for second-home purchases was lowered to 25%.
Chinese Vice Premier He Lifeng said that authorities in cities with excess home inventories should purchase unsold properties and convert them into affordable housing. He also urged local governments to repurpose inactive land parcels held by property developers to alleviate their financial troubles.
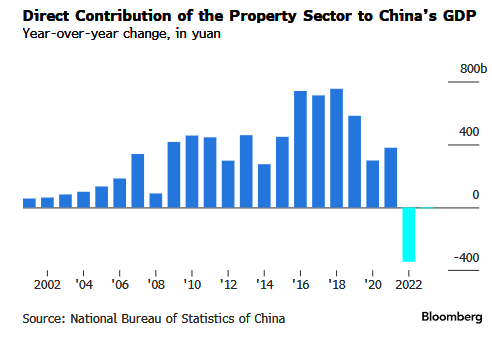
This was a very policy-heavy week to save the debt-stricken real estate market. Data showed that property investment and new home sales in April experienced larger contractions, while housing prices slid even further.
China’s ailing property sector is a drag on GDP.
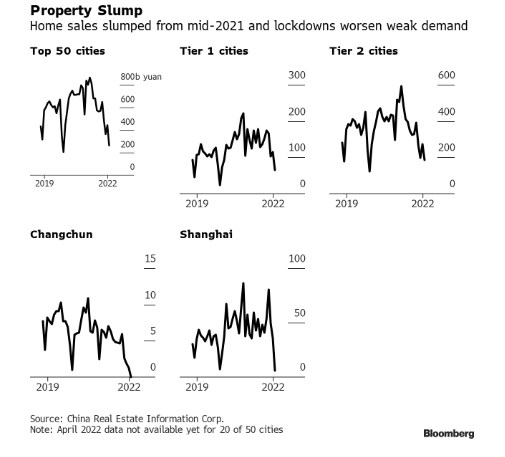
Housing sales are tumbling.
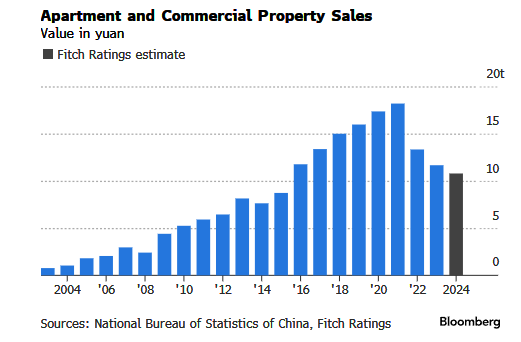
And apartment and commercial property sales are sliding.
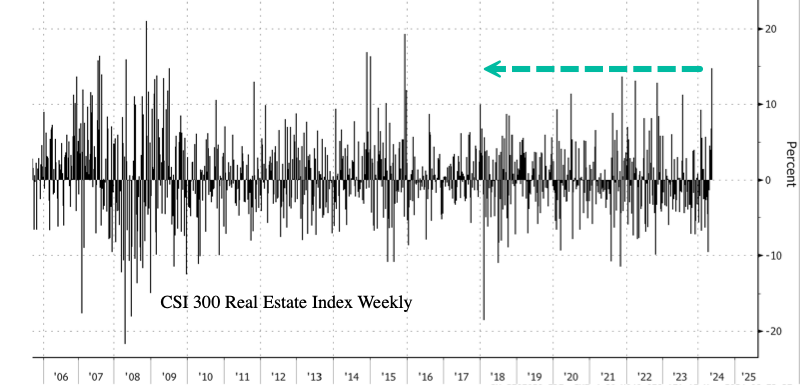
In markets, the CSI 300 Real Estate Index closed up 9%, with gains from April 24 totaling about 36%. Yet the latest gains in the property index are still 68% below the early 2018 peak.
The index’s weekly gain was the most since early December 2015.
It isn’t in a Communist countries’ DNA to let markets solve the problem … like letting prices correct no matter how painful that adjustment is. Biden and his “economic” advisor Jared Bernstein (not an economist but a public policy hack) would likely follow China’s idiotic solutions to the problem.
I debated Bernstein once at a Washington DC conference. He was arrogant but eventually confessed that he didn’t know anything about housing or mortgages. Nice economic advisor, Joe!
Mortgage applications increased 0.5 percent from one week earlier, according to data from the Mortgage Bankers Association’s (MBA) Weekly Mortgage Applications Survey for the week ending May 10, 2024.
The Market Composite Index, a measure of mortgage loan application volume, increased 0.5 percent on a seasonally adjusted basis from one week earlier. On an unadjusted basis, the Index increased 0.3 percent compared with the previous week. The seasonally adjusted Purchase Index decreased 2 percent from one week earlier. The unadjusted Purchase Index decreased 2 percent compared with the previous week and was 14 percent lower than the same week one year ago.
The Refinance Index increased 5 percent from the previous week and was 7 percent higher than the same week one year ago.
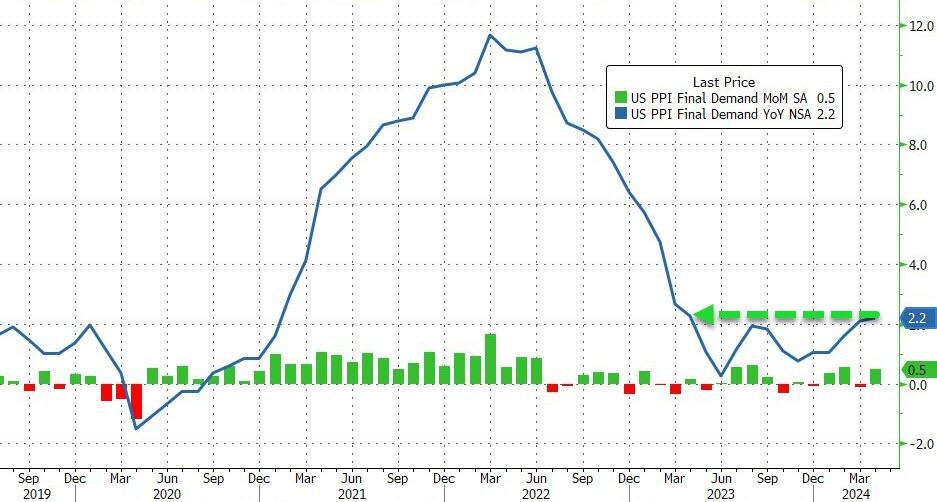
April Producer Prices rose 0.5% MoM (vs +0.3% exp), with March’s +0.2% MoM revised down to -0.1% MoM. The downward revision did not stop the YoY read rising to 2.2% (from +2.1% in March)…
Source: Bloomberg
This is the highest YoY read since April 2023 and is the fourth hotter than expected headline PPI print…
Source: Bloomberg
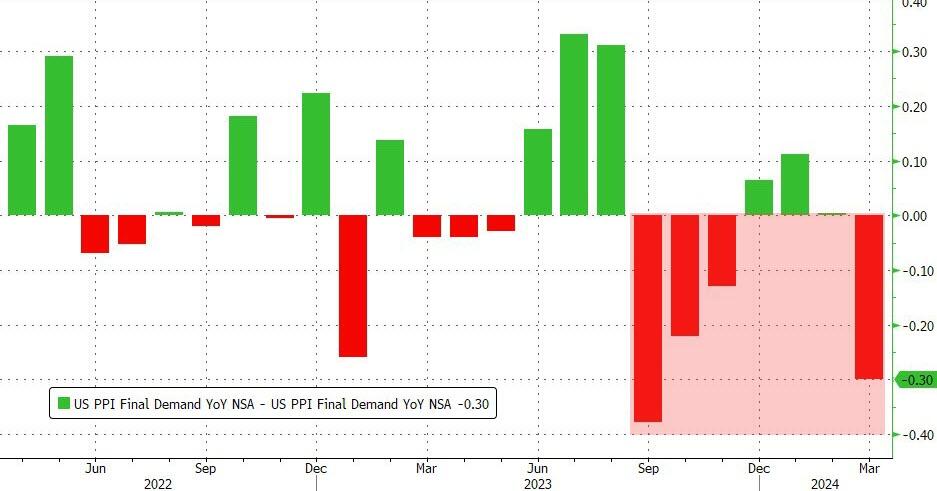
Producer Prices have been aggressively downwardly revised for 4 of the last 7 months…
Source: Bloomberg
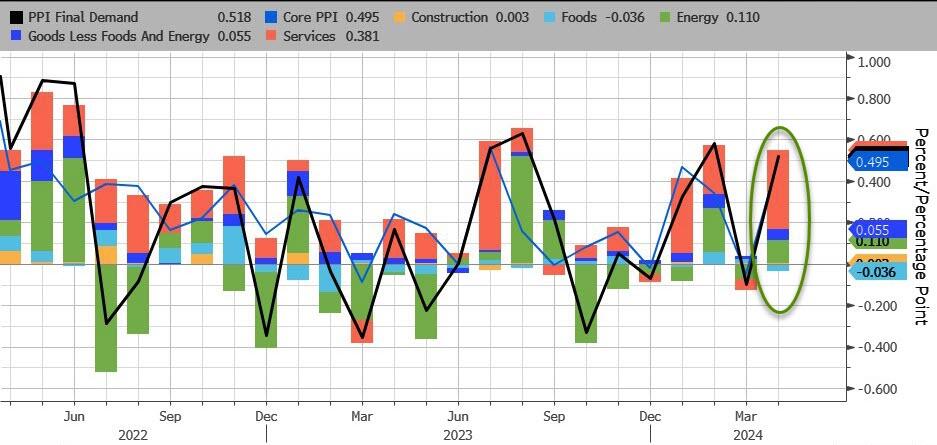
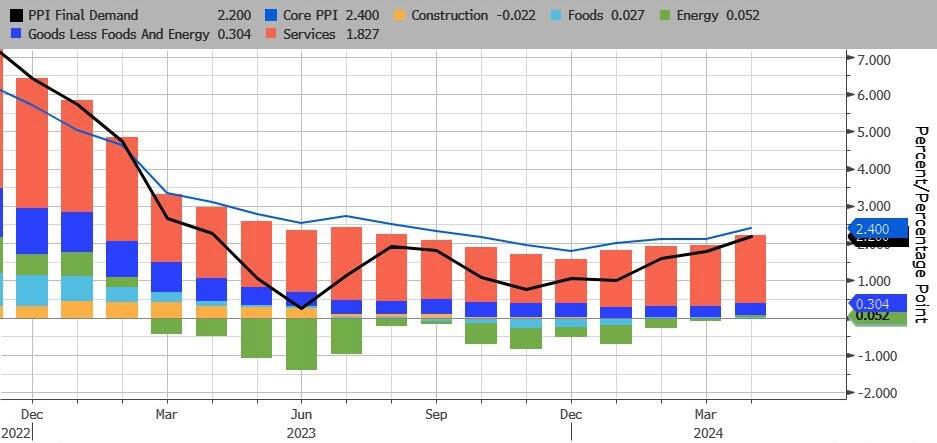
Services costs soared, dominating April’s PPI gains with Energy the second most important factor. Food prices actually declined on a MoM basis.
Source: Bloomberg
On a YoY basis, headline PPI’s rise was dominated by Services (rising at their hottest since July 2023). For the first time since Feb 2023, none of the underlying factors were negative on a YoY basis…
Source: Bloomberg
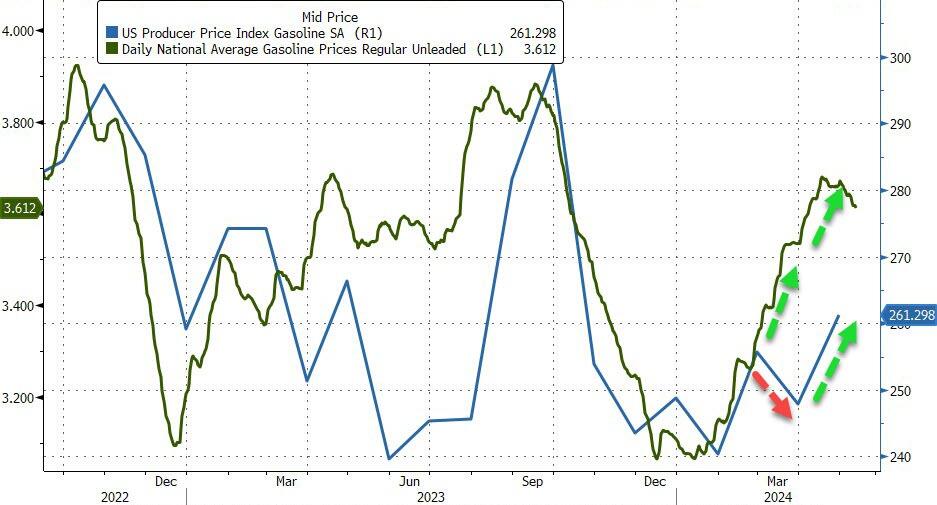
After last month’s farcical ‘seasonally adjusted’ gasoline price, April saw the PPI Gasoline index rise (with actual prices at the pump) but still has a long way to go…
Source: Bloomberg
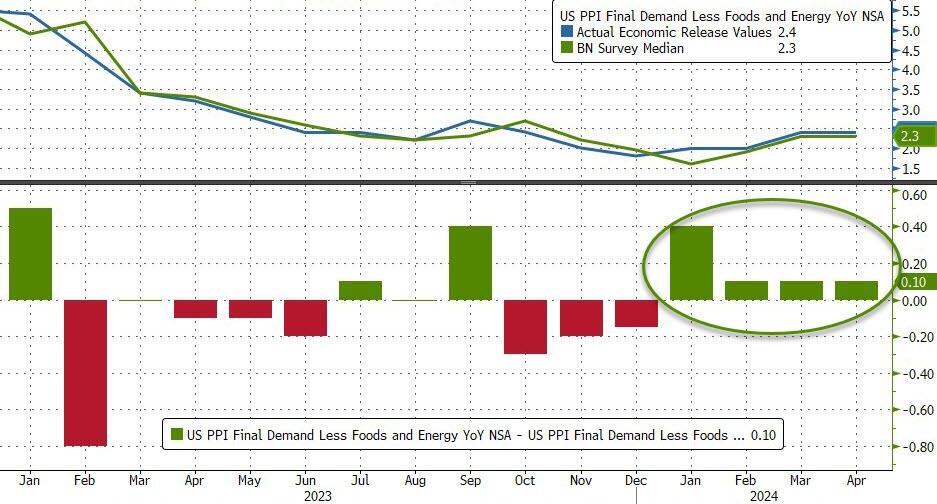
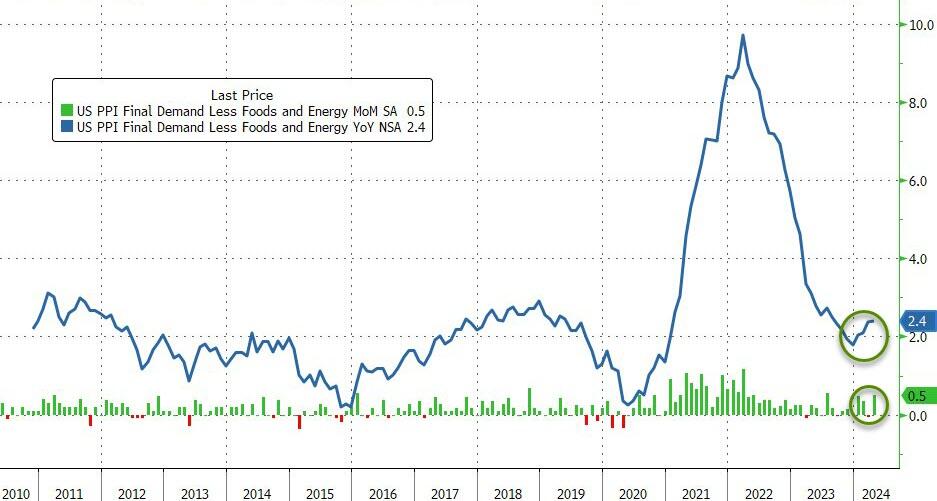
Core PPI was worse – rising 0.5% MoM (more than double the +0.2% MoM expected) – which pushed the Core PPI YoY up to +2.4%…
Source: Bloomberg
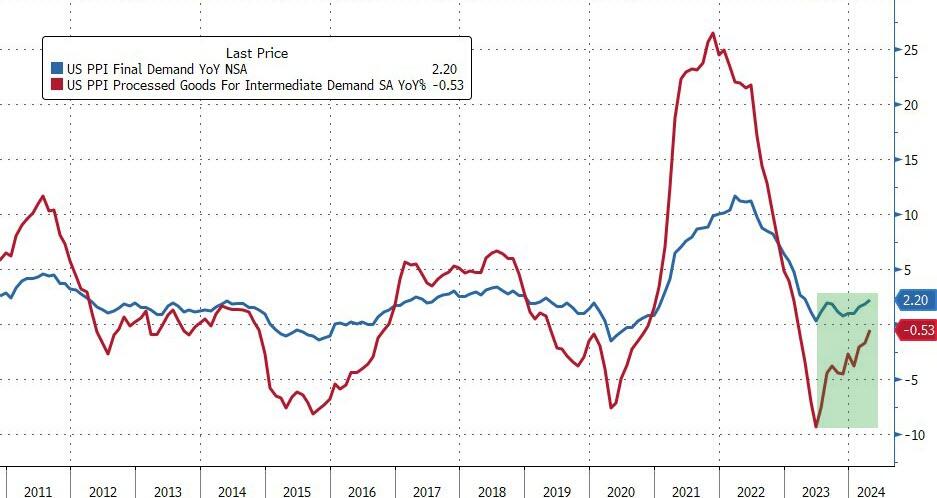
And finally US PPI Final Demand Less Foods Energy and Trade Services rose by 0.4% MoM and 3.1% YoY (the highest in 12 months).
Worse still the pipeline for primary PPI is not good as intermediate demand is starting to accelerate…
Source: Bloomberg
Over the past month, ‘higher prices’ have dominated ‘lower prices’ in recent survey data…
Higher producer prices:
New York Empire manufacturing price paid advanced to 33.7 from 28.7.
Philadelphia Fed manufacturing reported prices paid gained to 23.0 from 3.7 in March.
Philadelphia Fed non-manufacturing prices paid rose to 31.0 from 26.6 in the prior month.
Richmond Fed services prices paid rose to 6.11 from 5.43 in March.
Kansas City Fed manufacturing prices paid advanced to 18 from 17.
Kansas City Fed services input price growth continued to outpace selling prices.
S&P Global manufacturing input cost inflation quickened to hint at sustained near-term upward pressure on selling prices.
ISM Manufacturing prices paid gained to 60.9, the highest since June 2022, from 55.8 in March.
ISM Services prices paid notched up to 59.2, the highest since January, from 53.4 in March.
Lower producer prices:
New York Fed Services prices paid fell to 53.4 from 55.1 in March.
Richmond Fed manufacturing growth rates of prices paid dipped to 2.79 from 3.22 in March
Dallas Fed Manufacturing outlook reported prices paid for raw materials dropped to 11.2 from 21.1 in the prior month.
Dallas service sector input prices index nudged down to 28.8 from 30.4 in the prior month.
S&P Global Service saw input costs slowed from six-month highs in March.
Do you see the ‘flation’ now, Jay?
So, no, The Fed does not have inflation under control.
In a Socialist economy, housing is owned by The State, not its individual citizens. (Except for political party elites, of course). Fortunately, the United States hasn’t become a full-blown Socialist nation … yet.
But with home prices surging 33.2% under Biden and mortgage rates up 160%, homeownership is getting progressively more difficult and costly.
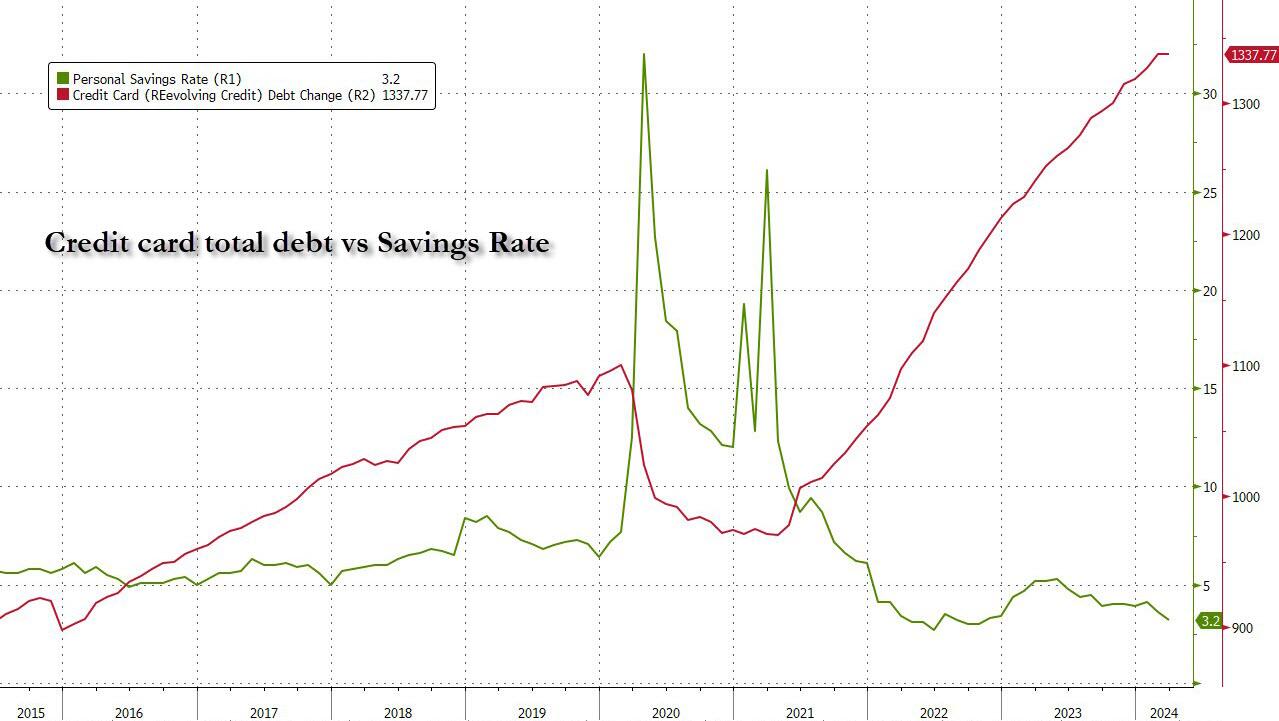
To be sure, credit card debt is just a small portion (~6%) of the total household debt stack: as the next chart from the latest NY Fed consumer credit report shows, the bulk, or 70%, of US household debt is in the form of mortgages, followed by student loans, auto loans, credit card debt, home equity credit and various other forms. Altogether, the total is a massive $17.5 trillion in total household debt.
But staggering as the mountain of household debt may be, at least we know how huge the problem is; after all the data is public. What is far more dangerous – because we have no clue about its size – is what Bloomberg calls “Phantom Debt“, and have repeatedly called Buy Now, Pay Later debt. How much of that kind of debt is out there is largely a guess.
But while it is easy to ensnare young, incomeless Americans into the net of installment debt where they will rot as the next generation of debt slaves for the rest of their lives, there is an even more sinister side to this extremely popular form of debt which allows consumers to split purchases into smaller installments: as Bloomberg reports in a lengthy expose on installment debt, the major companies that provide these so called “pay in four” products, such as Affirm Holdings, Klarna Bank and Block’s Afterpay, don’t report those loans to credit agencies. That’s why Buy Now/Pay Later credit has earned a far more ominous nickname:
It’s hard enough for central bankers and Wall Street traders to make sense of the post-pandemic economy with the data available to them. At Wells Fargo & Co., senior economist Tim Quinlan is particularly spooked by the “phantom debt” that he can’t see.
Which is not to say that we have no idea how much “phantom debt” is out there: according to the report, it is projected to reach almost $700 billion globally by 2028, and yet, time and again, the companies that issue it have resisted calls for greater disclosure, even as the market has grown each year since at least 2020. That, as Bloomberg accurately warns, is masking a complete picture of the financial health of American households, which is crucial for everyone from global central banks to US regional lenders and multinational businesses.
In fact, the recent explosion in installment debt may explain why the US consumer remains so resilient even when most conventional economic metrics suggest consumers should be struggling: “Consumer spending in the world’s largest economy has been so resilient in the face of stubbornly high inflation that economists and traders have had to repeatedly rip up their forecasts for slowing growth and interest-rate cuts.”
Still, cracks are starting to form. First it was Americans falling behind on auto loans. Then credit-card delinquency rates reached the highest since at least 2012, with the share of debts 30, 60 and 90 days late all on the upswing.
And now, there are also signs that consumers are struggling to afford their BNPL debt, too. A recent survey conducted for Bloomberg News by Harris Poll found that 43% of those who owe money to BNPL services said they were behind on payments, while 28% said they were delinquent on other debt because of spending on the platforms.
For Quinlan, a major concern is that economic experts are being “lulled into complacency about where consumers are.”
“People need to be more awake to the risk of BNPL,” he said in an interview.
Well, those who care, are awake – we have written dozens of articles on the danger it poses; the problem is that those who are enabled by this latest mountain of debt – such as the Biden administration which can claim a victory for Bidenomics because the economy is so “strong”, phantom debt be damned – are actively motivated to ignore it.
So why is this latest debt bubble called a “phantom”?
Well, BNPL is a black box largely because of a longstanding blame game among BNPL providers and the three major credit bureaus: TransUnion, Experian and Equifax. The BNPL companies don’t provide data on their installment loans that are split into four payments, which were used by online shoppers to spend an estimated $19.2 billion in the first quarter, according to Adobe Analytics, up 12.3% compared with the same period last year.
The BNPL giants say credit agencies can’t handle their information — and that releasing it could harm customers’ credit scores, which are key to securing mortgages and other loans. The big three bureaus say they’re ready, while two of the major credit scoring firms, VantageScore Solutions and Fair Isaac Corp. (FICO), say they’re equipped to test how the products will affect their figures. Meanwhile, regulation is looming over the industry, but this stalemate has left the status quo mostly in place.
In other words, not only do we not know just how big the BNPL problem is, it is actively masked by credit agencies which can’t accurately calculate the FICO score of tens of millions of Americans, and as a result their credit capacity is artificially boosted with far more debt than they can handle… and that’s why the US consumer has been so “strong” in recent years, defying all conventional credit metrics.
The good news is that despite the tacit pushback of the administration, there has been some signs of progress. Apple earlier this year became the first major BNPL provider to furnish transaction and payment data to Experian. As of now, it provides a snapshot of consumers’ overall debt load from Apple Pay Later transactions, but the information won’t be used for consumer credit scores. In separate statements to Bloomberg, Klarna, Affirm and Block said they want assurance that consumers’ credit scores and their data would be protected before reporting customer information. Representatives for TransUnion, Experian and Equifax said they’ve updated their structures and the data would be secure.
Still, the lack of transparency has researchers at the Federal Reserve Bank of New York, which publishes a comprehensive quarterly report on the $17.5 trillion in US household debt, convinced they’re missing some of what’s happening in the economy.
“They’ve reached a certain scale that they could impact economists’ assumptions about their economic outlooks,” said Simon Khalaf, Chief Executive Officer of Marqeta Inc., a firm that helps BNPL providers process their payments.
Meanwhile, the pernicious effects of BNPL credit are piling up: the Harris Poll survey conducted last month, provides some crucial clues about how Americans use BNPL. For one, splitting payments into smaller chunks encourages more spending, obviously.
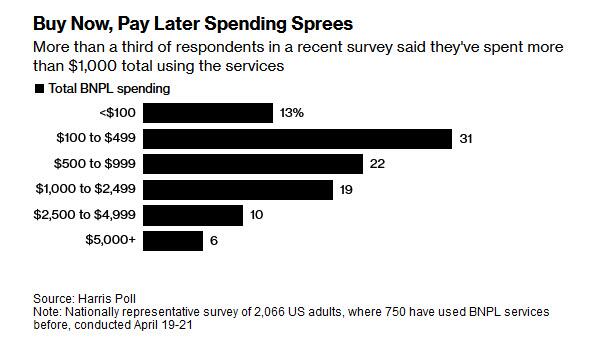
More than half of respondents who use BNPL said it allowed them to purchase more than they could afford, while nearly a quarter agreed with the statement that their BNPL spending was “out of control.” Harris also found that 23% of users said they couldn’t afford the majority of what they bought without splitting payments, while more than a third turned to the services after maxing out credit cards.
The findings also show that the spending, which for more than a third of users has exceeded $1,000, isn’t entirely on big-ticket items. Almost half of those using BNPL say they’ve started, or have considered, using it to pay bills or buy essential items, including groceries.
Translation: Americans are no longer even charging everyday purchases they traditionally used cash and savings to pay for; now they are using installment plans to pay for bread!
It’s not just the lower classes that are abusing BNPL credit: while whatever small pockets of consumer distress have emerged so far in the US, have been chalked up to a bifurcated economy where working class Americans struggle to make ends meet, the survey found that middle-class households are relying on BNPL, too. The shocking punchline: about 42% of those with household income of more than $100,000 report being behind or delinquent on BNPL payments!
“BNPL essentially lets people dig a deeper and deeper hole of credit, which will be harder and harder to climb out of,” said Ed deHaan, a professor of accounting at Stanford Graduate School of Business, adding that it happens “more easily when there’s no transparency.”
Of course, installment debt is nothing new: the option to pay in installments using short-term loans has been around for a ong time, but it exploded in popularity during the pandemic, especially with younger, digitally savvy consumers who gravitated to the services as an alternative to credit cards. The pioneering BNPL companies, including Afterpay, Klarna and Affirm, launched with trendy retailers, partnered with social media influencers and became a common option on apps and online checkouts.
BNPL offers quick credit approvals and lets consumers pay in installments. The first is usually due right away, and the others are often collected once every two weeks for the popular “pay in four” loans. There’s typically no interest or fees, as long as payments are made on time. Like credit card companies, BNPL firms make money on fees from merchants — and some have steep penalties for missed payments.
While normally larger banks would avoid this kind of “new and much more dangerous subprime”, this time is different: the rapid adoption of the products has enticed major financial institutions to offer the option to split payments, even as regulators warn them of the risks. That includes PayPal, U.S. Bancorp and Citizens Financial. Even big banks like Citigroup and JPMorgan have similar capabilities on their credit cards.
The industry has branded itself a financial equalizer. They argue that “soft-credit checks” — when a lender runs a consumer’s credit history without affecting their score — expand credit access to those underserved by traditional lenders, while zero-interest provides a better deal than many cards.
Affirm said its customers have an average outstanding balance of $641, while Afterpay and Klarna put the figure at $250 and $150, respectively. Unfortunately, there is no way to check these numbers. And while the average credit card balance was $6,501 in the third quarter of 2023, according to Experian data, the BNPL balances mean that most Americans can’t even afford a weekly outing to their grocery store without putting it on an installment plan, a truly terrifying scenario.
Critics naturally argue that BNPL is particularly attractive to the financially vulnerable. The Consumer Financial Protection Bureau has flagged risks to consumers, including surprise late fees and “hidden interest” — or when BNPL purchases are made with credit cards charging high interest rates. The CFPB has also expressed concern about “loan stacking,” when individuals take out several BNPL loans at once with different providers, which is most of them.
Some BNPL services, including Afterpay and Klarna, require borrowers to agree to “mandatory autopayment,” meaning the companies can automatically charge the credit card or bank account on file when a payment is due. Those who link the latter are potentially vulnerable to overdraft fees.
Meanwhile, as rates remains sky high, even Wall Street’s perpetually cheerful analysts are wondering where is all the consumption coming from?
Robust consumer spending and low unemployment rates have many economists convinced the US consumer remains strong, making Wall Street bullish on the economy. But lately, stubbornly persistent inflation has dialed back expectations for imminent interest-rate relief.
That’s set to ramp up pressure on households that are already stretched thin by higher prices for everything from gas and food to rent and apparel. As of the end of December, almost 3.5% of credit-card balances were at least 30 days past due, according to the Philadelphia Fed, the most since the data began in 2012. Nominal card balances also set a new high.
For those who are falling behind, BNPL offers what appears to be a no-brainer decision: space out payments… at least until this last credit buffer fills up and bankruptcy is the only possible outcome.
That was the thinking of Hayden Waschak, a 23-year-old in Pittsburgh. Even though he said it felt “dystopian” to use BNPL to pay for food, he began using Klarna in February to spread out payments on a grocery delivery app. It helped his finances — at first. After he lost his job as a documents processing specialist at University of Pittsburgh Medical Center in March, he relied more heavily on the service. And without any income, he became delinquent on payments and started racking up late charges. He eventually paid off the nearly $200 balance, but he said his credit score dropped.
“Unexpected life events caused me to lose income,” Waschak said. “I ended up paying more than if I had paid for it all at once.”
Meanwhile, the fact that BNPL balances do not count against your credit rating, means users get little upside when it comes to their credit — paying on time won’t help them build up their score. On the other hand, the downside is still there for falling behind: not only can they get charged late fees, but delinquent BNPL loans can be turned over to debt collectors.
The latter is what Fabrizio Lopez said happened to him. He used Affirm to split up a $500 online payment for used-car parts in 2019. The Long Island-based mechanic, who doesn’t have a traditional credit card, said that while he received the items a week later, he never got a bill. That is, until debt collection letters started pouring in from across the US.
Lopez said he primarily relied on cash before that purchase, so the unpaid loan stands out on his credit profile. Now 30, he worries that a the BNPL purchase has created “invisible barriers” to the financial system.
“They hook you with the idea of no interest rates,” he said. “I thought that I would be able to build my credit if I paid it back — I was so wrong.”
He is not the only one who is “so wrong”: just as wrong are all those Panglossian economists at the Fed and Wall Street who believe that the US economy is growing at what the Atlanta Fed today laughably “calculated” was a 4.2% GDP, even as the DOE found that the most accurate indicator of overall economic strength, diesel demand, was the lowest since covid, an glaring paradox… yet glaring to all except those who refuse to see just how rotten the core of the US economy has become, and will be “absolutely shocked” when the next credit crisis destroys tens of millions of Americans drowning in what is now best known as “phantom debt.”
Biden and Bidenomics is disastrous for the middle class and low wage workers. Food and housing prices through the roof, and now we have mortgage purchase demand declining -57% under Biden.
Mortgage applications increased 2.6 percent from one week earlier, according to data from the Mortgage Bankers Association’s (MBA) Weekly Mortgage Applications Survey for the week ending May 3, 2024.
The Market Composite Index, a measure of mortgage loan application volume, increased 2.6 percent on a seasonally adjusted basis from one week earlier. On an unadjusted basis, the Index increased 3 percent compared with the previous week. The seasonally adjusted Purchase Index increased 2 percent from one week earlier. The unadjusted Purchase Index increased 2 percent compared with the previous week and was 17 percent lower than the same week one year ago.
In fact, Mortgage Purchase demand (applications) are down -57% under Biden and Bidenomics.
The Refinance Index increased 5 percent from the previous week and was 6 percent lower than the same week one year ago.
One year after regional banks crashed and burned due to the combination of tumbling debt/treasury prices coupled with cratering commercial real estate loans, fears about the current state of Commercial Real Estate – where most offices still see tenants at best 3 to 4 days a week and are literally burning through rents – appear long forgotten. Is that sensible?
For one answer, we turned to the latest report from Goldman’s REIT/CRE expert Chandhi Luthra who has published a visual assessment of the state of CRE in 2024 in terms of loan maturities, 2023 extensions, and property and lender groups. She also looks at the latest transaction and leasing volumes, and shares several key takeaways.
There are ~$4.7tn of outstanding commercial/multifamily mortgages outstanding, according to the Mortgage Bankers Association’s 2023 Commercial Real Estate Survey of Loan Maturity Volumes.
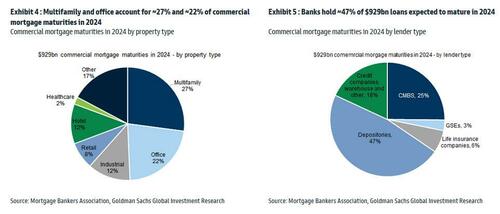
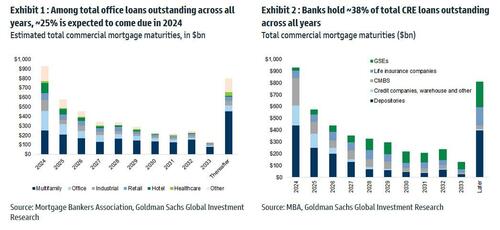
More specifically in 2024, $929bn of CRE mortgages are expected to mature, ~20% of ~$4.7tn total commercial mortgages outstanding. In terms of property type, multifamily and office account for ~27% and ~22% of commercial mortgage maturities in 2024 respectively. In terms of lender type, banks hold ~47% of debt maturing in 2024, followed by CMBS at ~25%.
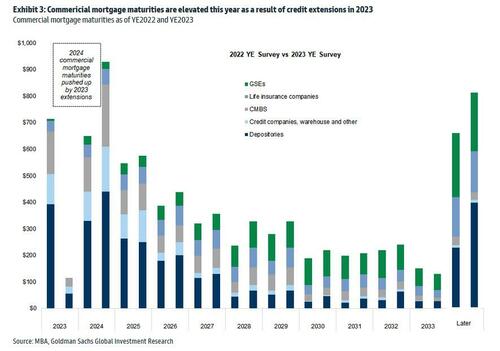
It is worth noting that 2024 commercial mortgage maturities are pushed up by 2023 extensions. As shown in Exhibit 3, among the CRE loans scheduled to mature in 2023, ~$610bn were refinanced, with ~$300bn pushed into 2024 and the remainder into future years. As a result, the total CRE refinancing volume is expected to be ~$929bn in 2024.
Of course, it does not end there, and since there has been no fundamental improvement, it is certain that extension volumes in 2024 will be high as well. However, as interest rates are expected to come down, demand for refinancing in 2024 may outpace that in 2023 according to the Goldman analyst (rates are still far, far higher than where they were when most of the loans were originated several years ago). At the same time, for loans that have already been extended in the past, it is also likely that future extensions could be harder.
Among the loans backed by office properties overall, ~25% is expected to come due in 2024. In terms of lender type, banks (primarily small, regional banks) hold ~38% of total CRE loan outstanding across all years, followed by the GSEs at 20%.
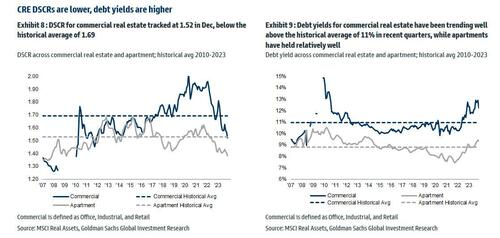
Looking at different debt metrics, DSCR for commercial real estate (office, industrial and retail combined) tracked at 1.52 in Dec, below the historical average of 1.69; debt yields for commercial real estate have been trending well above the historical average of ~11% in recent quarters, while apartments have held relatively well.
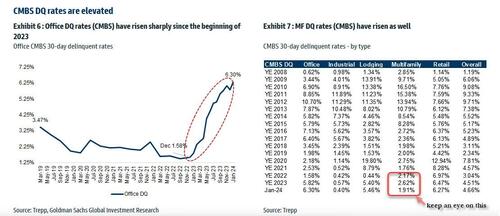
Office CMBS DQs have risen significantly, with Jan tracking at 6.3%, up significantly from 1.58% in Dec 2022. And while everyone knows the Office canary in the coalmine is dead and buried, keep an eye on Multifamily CMBS DQs which tracked at 1.91% vs 2.62% in December, with the sequential decline associated with a large San Francisco apartment loan that was recently disposed. The overall DQ rate tracked at 4.66% in January.
The Goldman strategist concludes with a word about CRE transaction and leasing: U.S. CRE transaction market continues to be muted, primarily driven by elevated interest rates, limited sources of capital, and the pricing gap between buyers and sellers. January volume was down -11% yoy, driven by easier compares in Jan 2023 (down -55%). In terms of leasing, Jan preliminary trends indicate weakness in activities, with office down -25% yoy and industrial down -28% yoy.
Here, Goldman trader Sara Cha chimes in (her report is also available to pro subs) and notes that we can see from the transaction data “why sentiment in CRE brokers is a bit more mixed of late – thought yesterday’s JLL print had mixed reception – while you’ve seen some signs of life in capital markets space broadly to start the year, not seeing that as much on the CRE front (remember those 3Q-4Q greenshoots?).“
Multifamily CRE
The commercial real estate sector continues to experience elevated stress . The latest crack to emerge is the increasing number of delinquencies on multifamily mortgages.
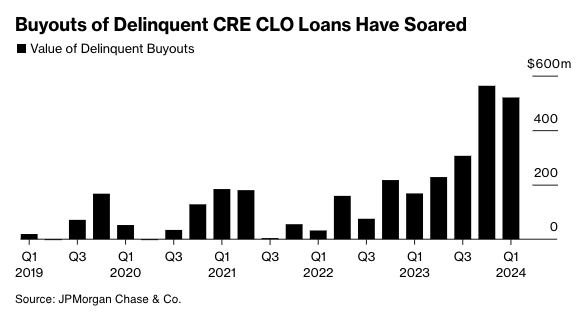
In April, about 8.6% of commercial real estate loans bundled into collateralized loan obligations were distressed, reaching the record high set in January, according to Bloomberg, citing new data from analytics firm CRED iQ.
The loans bundled into CRE CLOs were merged with funds from individual investors to acquire multifamily housing during the Covid era. After that, borrowing rates surged, catching many off guard. A significant portion of the deteriorating loans had floating-rate interest rates, putting massive pressure on landlords’ cash flows, diminishing the market worth of the properties, and obliterating equity in a large number of investments.
According to data provider Trepp, $78.5 billion of CRE CLO loans are outstanding. This means many CRE CLO issuers are racing to find ways to prevent a tsunami of bad loans from defaulting or risk losing the fees they collect on the securities.
Recent estimates from JPMorgan show lenders purchased $520 million of delinquent loans in the first quarter of this year. Lenders have been ramping up the number of buyouts over the last four quarters because of mounting bad loans in a period of elevated rates.
Source: Bloomberg
JPMorgan strategist Chong Sin said he’s surprised by lenders’ ability to obtain warehouse lines to purchase bad debt, given tightening credit conditions.
“The reason these managers are engaged in buyouts is to limit delinquencies,” Sin said, adding, “The wild card here is, how long will financing costs remain low enough for them to do that?”
Anuj Jain, an analyst at Barclays Plc, expects buyouts to continue as distress increases across the CRE CLO space.
“If the outlook for the Fed shifts materially to hikes or no rate cuts for a while, that might lead to a sharp increase in delinquencies, which can stifle issuers’ ability to buy out loans,” Jain said.
Bloomberg explains much of the CLO space derives from multifamily bridge loans originated around 2021-2022:
CRE CLO issuance surged to $45 billion in 2021, a 137% increase from two years earlier, when buyers of apartment blocks sought to profit from the wave of workers moving to the Sun Belt from big cities. Three-year loans would give them time to complete upgrades and refinance, the thinking went.
Fast forward to today and the debt underpinning many of the bonds is coming due for repayment at a time when there’s less appetite for real estate lending, insurance costs have skyrocketed and monetary policy remains tight. Hedges against borrowing cost increases are also expiring and cost significantly more to purchase now.
Those blows helped increase multifamily assets classed as distressed to almost $10 billion at the end of March, a 33% rise since the end of September, according to data compiled by MSCI Real Assets.
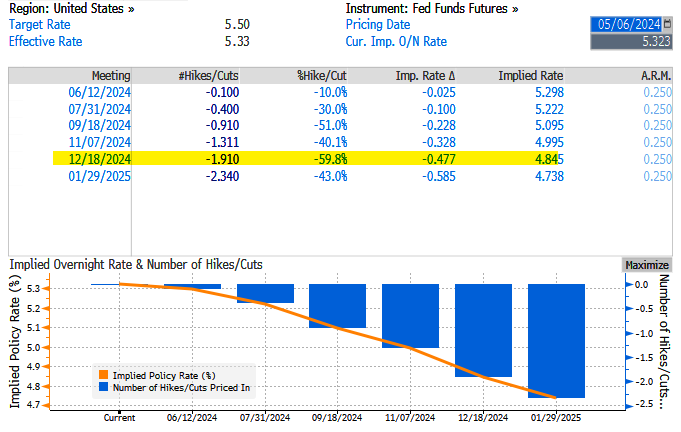
Last Wednesday, the Fed left interest rates unchanged at around 550bps as inflation data reaccelerates and economic growth tilts to the downside, stoking stagflation fears.
Fed swaps are pricing in just under two cuts – this is down from nearly seven earlier this year and about 1.14 before last week’s FOMC.
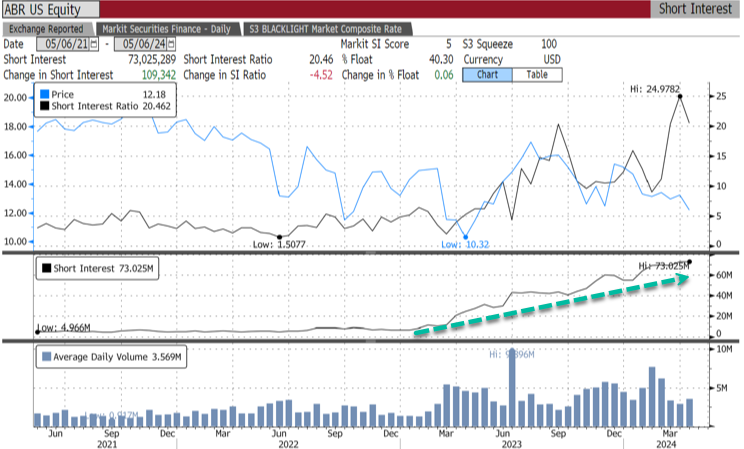
Meanwhile, bears are piling in on CRE CLO issuer Arbor Realty Trust Inc., with 40.3% of the float short, equivalent to 73 million shares short.
“The multifamily CRE CLO market was not prepared for rate volatility,” said Fraser Perring, the founder of Viceroy Research, which has placed bear bets against Arbor, adding, “The result is significant distress.”
The longer the Fed delays rate cuts, the worse the CRE mess will get.


You must be logged in to post a comment.