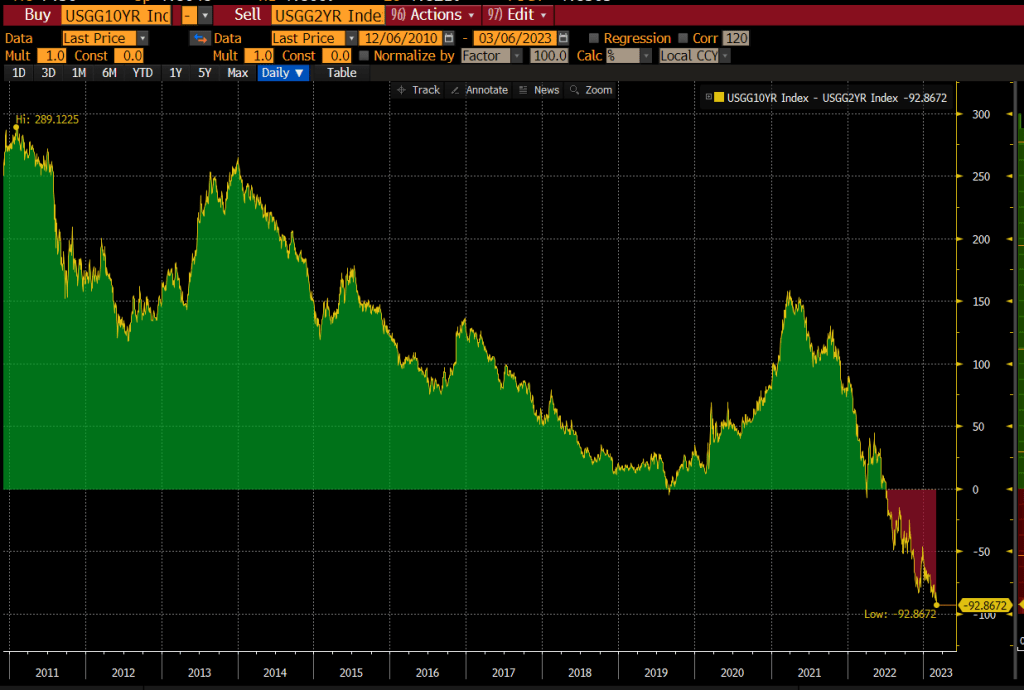
As inflation remains persist (thanks to endless Fed stimulus and endless Federal spending splurges), we are seeing The Federal Reserve finally withdrawing the monetary stimulus (tightening the monetary noose). And with it, the US Treasury yield curve (10Y-2Y) goes down with it.
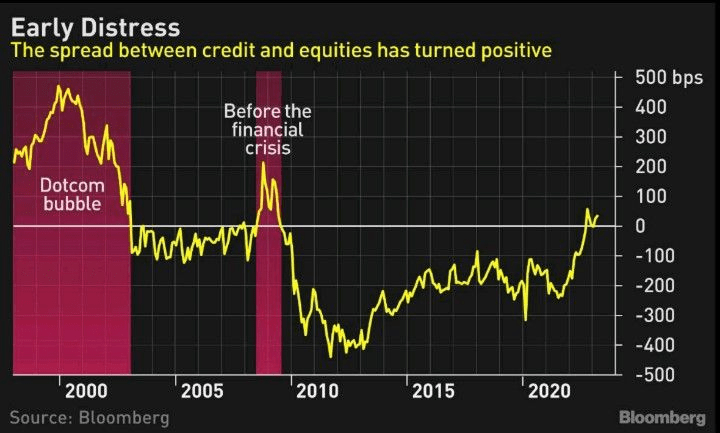
Another sign of distress is the spread between credit and equities which has turned positive as it does in times of crisis.
UPDATE! Recession predictor the US Treasury yield curve just went “red alert”, inverting to -100 basis points.
The last US debt crisis occured in 2013 when Congress finally raised the debt ceiling … and kept on borrowing and spending, But if you thought that a debt crisis would scare Congress (and the Administration) into balancing the Federal budget, you would be wrong. In fact, since the 2013 debt crisis, Federal debt is up 88% (+$14.7 TRILLION over the last 10 years).
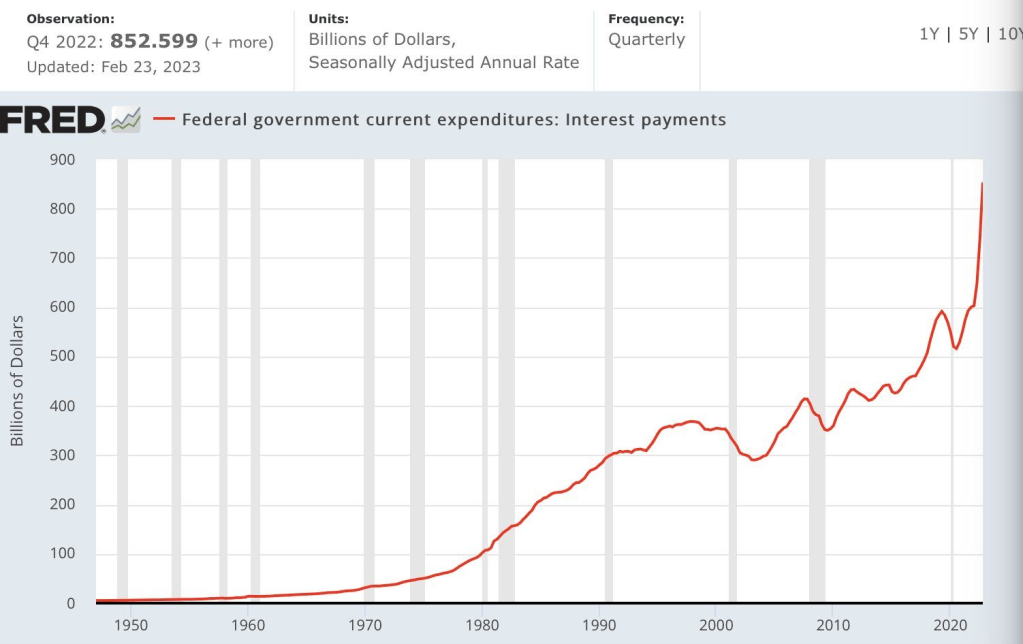
And with the massive growth in Federal debt under Obama, Trump and Biden has resulted in an explosion in interest payments on the Federal debt.
Interest rates are an important driver of the economy and financial markets. And what has happened to the S&P 500 index since The Federal Reserve started raising their target rate on May 4, 2023 to fight surging inflation?
Since that fatal day, the S&P 500 index has fallen -6% and equity REITs (commercial real estate) has fallen -16%.
What about returns on US Treasuries and Mortgage-backed Securities (MBS)? Same thing. PAIN!
Although The Fed has pledged to keep raising rates to fight inflation (and further decimate retirement accounts), investors are pointing to a peak (terminal) Fed rate of 5.44% at the September 2023 FOMC meeting. Then rate cuts following the September 2023 meeting.
Of course, much of the blame belongs to former Fed Chair Ben (QE) Bernanke and current Treasury Secretary Janet “Too Low For Too Long” Yellen who never met a Fed rate hike that she liked. But Yellen LOVES giving away US taxpayer dollars … to Ukraine.
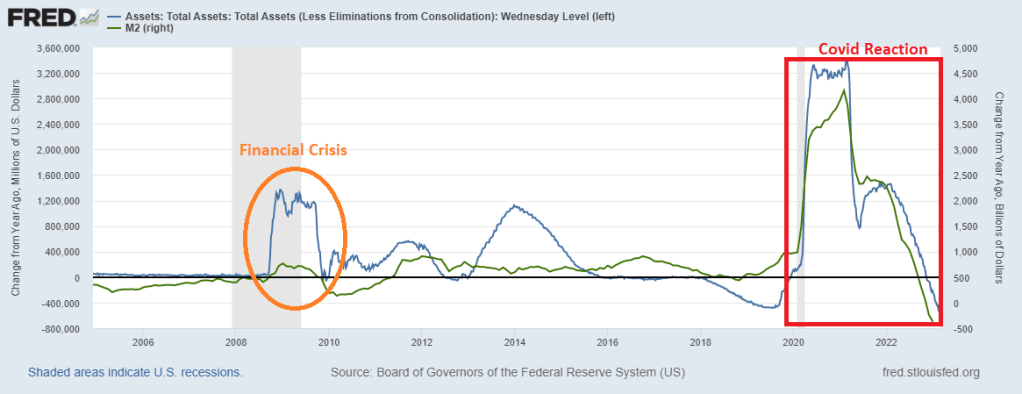
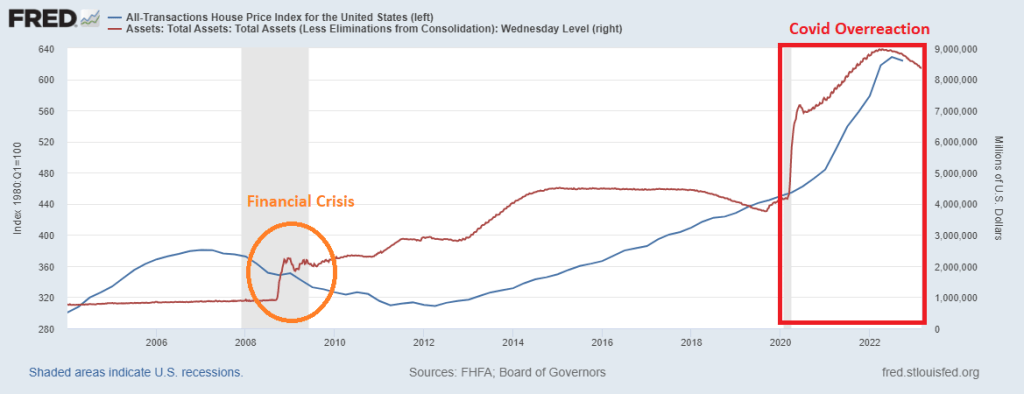
But despite how bad the financial crisis of 2008/2009 was, the growth of Fed assets on it balance sheet (orange oval) paled in comparison to The Fed’s overreaction to the Covid outbreak of 2020. And the government shutdowns and mask mandates.
The good news? The rate of growth YoY of both The Fed’s balance sheet and M2 Money is negative. But it is still startling to see the comparison of Fed reactions to crises.
Give The Fed three steps to catch up to the mayhem they created. Particularly in inflation home prices.
Yesterday’s inflation report (in the form on skyrocketing labor costs) helped lead Bankrate’s 30-year mortgage rate to over 7% … again.
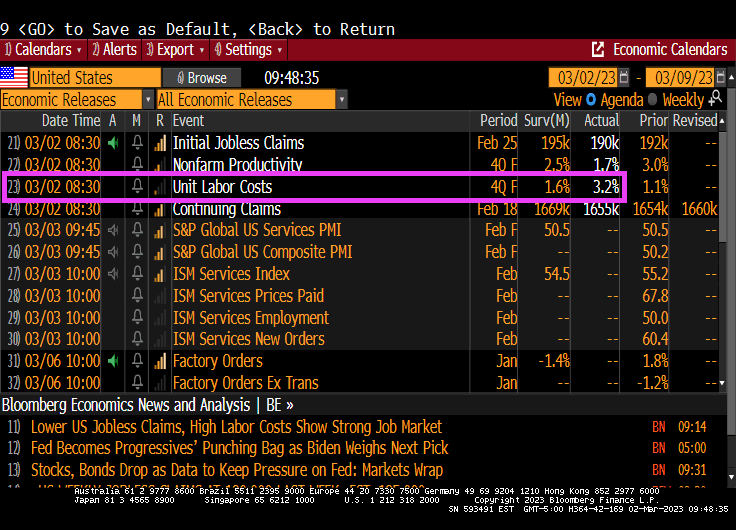
Here is yesterday’s horrible unit labor costs YoY chart showing the fastest growth in labor costs since 1982 and Fed Chair Paul Volcker. Jerome Powell, the current Fed Chair is trying to reduce the Bernanke/Yellen/Powell monetary stimulypto (with an extra dose of “sugar” from the Covid outbreak).
The good news is that the 10-year Treasury yield is down -7.3 basis points this morning.
Despite Treasury Secretary Janet Yellen claiming that inflation was only transitory and likely to disappear, we are seeing continued inflation. Now we see that Unit Labor Costs are up 3.2% QoQ for Q4 2022.
Even worse, US unit labor costs rose 6.5% on a year-over-year (YoY) basis, the WORST since 1982.
And yes, Q4 2022 unit labor costs are up 2x the expectations.
In normal times, The Federal Reserve would raise rates to cool down the economy. The Taylor Rule suggests a Fed target rate of 10.59% versus the current Fed rate of 4.75%. A long way to go!!
What a mess in Washington DC. While House Republicans are at lagerheads with Senate Democrats and Resident Biden over Federal spending cuts, the price of insuring against a debt default just rose to 76.75.
How bad it that? Put it this way. Millions are fleeing Mexico and Guatemala and coming to the US. But Mexico has a lower cost of insuring against a debt default than the USA. And Guatemala is almost as expensive as the USA.
It will all be over soon, according to CDS prices.
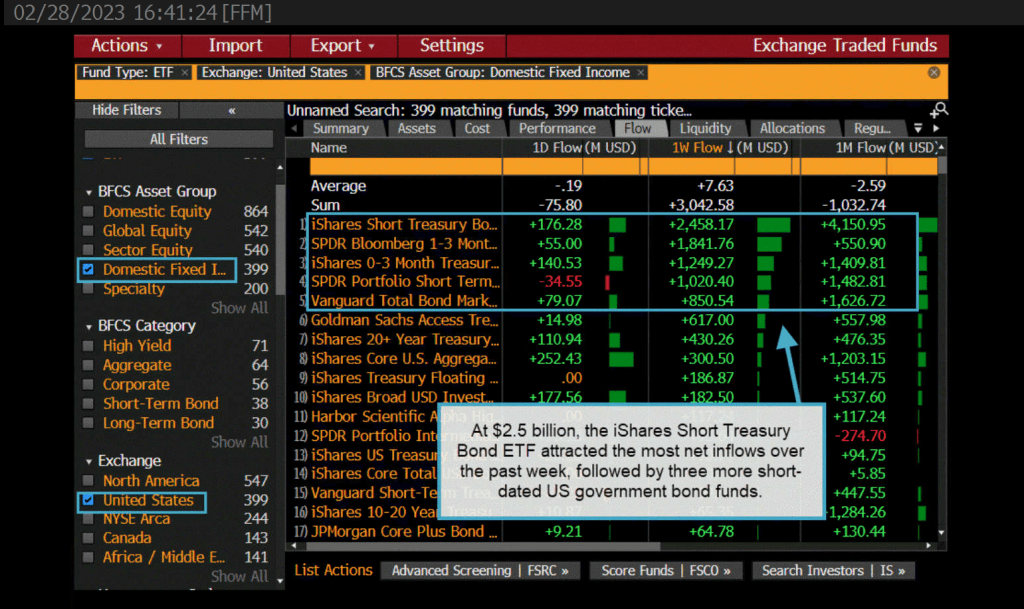
As The Federal Reserve reaffirms their draining of the monetary punch bowl, we are seeing investors flock towards the bond market. Particularly the iShares Short Treasury ETF. $2.5 BILLION to be exact.
Meanwhile, credit ETFs are hammered by record outflows of almost $12 Billion.
The reason why? Inflation remains elevated which is leading The Fed to keep their foot on the monetary brake pedal.
Today’s mortgage application (demand) numbers from the Mortgage Bankers Association was disappointing to say the least. Mortgage purchase demand just sank to it lowest level since 1995.
Typically, mortgage purchase applications peak in May or June of each year before beginning their annual lemmings drive downwards. But this year is seeing a early turn for the worse.
The unadjusted Purchase Index decreased 3 percent compared with the previous week and was 44 percent lower than the same week one year ago. The Refinance Index decreased 6 percent from the previous week and was 74 percent lower than the same week one year ago.
The Fed is hell bent on removing the punch bowl to fight inflation. Looks like Biden’s economic plan is turning the punch bowl into a dust bowl.


You must be logged in to post a comment.