Biden and Bidenomics is disastrous for the middle class and low wage workers. Food and housing prices through the roof, and now we have mortgage purchase demand declining -57% under Biden.
Mortgage applications increased 2.6 percent from one week earlier, according to data from the Mortgage Bankers Association’s (MBA) Weekly Mortgage Applications Survey for the week ending May 3, 2024.
The Market Composite Index, a measure of mortgage loan application volume, increased 2.6 percent on a seasonally adjusted basis from one week earlier. On an unadjusted basis, the Index increased 3 percent compared with the previous week. The seasonally adjusted Purchase Index increased 2 percent from one week earlier. The unadjusted Purchase Index increased 2 percent compared with the previous week and was 17 percent lower than the same week one year ago.
In fact, Mortgage Purchase demand (applications) are down -57% under Biden and Bidenomics.
The Refinance Index increased 5 percent from the previous week and was 6 percent lower than the same week one year ago.
One year after regional banks crashed and burned due to the combination of tumbling debt/treasury prices coupled with cratering commercial real estate loans, fears about the current state of Commercial Real Estate – where most offices still see tenants at best 3 to 4 days a week and are literally burning through rents – appear long forgotten. Is that sensible?
For one answer, we turned to the latest report from Goldman’s REIT/CRE expert Chandhi Luthra who has published a visual assessment of the state of CRE in 2024 in terms of loan maturities, 2023 extensions, and property and lender groups. She also looks at the latest transaction and leasing volumes, and shares several key takeaways.
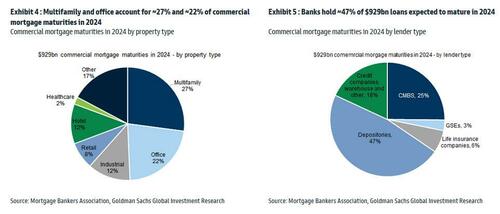
There are ~$4.7tn of outstanding commercial/multifamily mortgages outstanding, according to the Mortgage Bankers Association’s 2023 Commercial Real Estate Survey of Loan Maturity Volumes.
More specifically in 2024, $929bn of CRE mortgages are expected to mature, ~20% of ~$4.7tn total commercial mortgages outstanding. In terms of property type, multifamily and office account for ~27% and ~22% of commercial mortgage maturities in 2024 respectively. In terms of lender type, banks hold ~47% of debt maturing in 2024, followed by CMBS at ~25%.
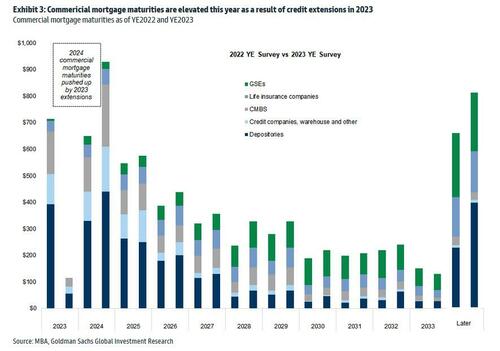
It is worth noting that 2024 commercial mortgage maturities are pushed up by 2023 extensions. As shown in Exhibit 3, among the CRE loans scheduled to mature in 2023, ~$610bn were refinanced, with ~$300bn pushed into 2024 and the remainder into future years. As a result, the total CRE refinancing volume is expected to be ~$929bn in 2024.
Of course, it does not end there, and since there has been no fundamental improvement, it is certain that extension volumes in 2024 will be high as well. However, as interest rates are expected to come down, demand for refinancing in 2024 may outpace that in 2023 according to the Goldman analyst (rates are still far, far higher than where they were when most of the loans were originated several years ago). At the same time, for loans that have already been extended in the past, it is also likely that future extensions could be harder.
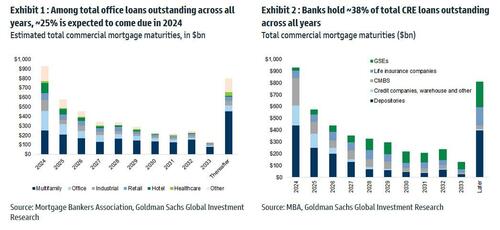
Among the loans backed by office properties overall, ~25% is expected to come due in 2024. In terms of lender type, banks (primarily small, regional banks) hold ~38% of total CRE loan outstanding across all years, followed by the GSEs at 20%.
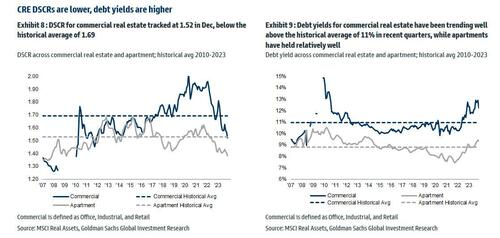
Looking at different debt metrics, DSCR for commercial real estate (office, industrial and retail combined) tracked at 1.52 in Dec, below the historical average of 1.69; debt yields for commercial real estate have been trending well above the historical average of ~11% in recent quarters, while apartments have held relatively well.
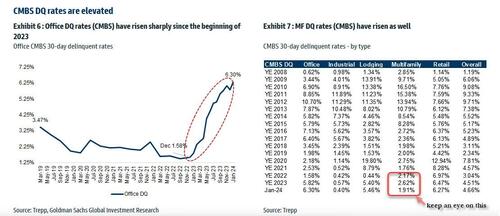
Office CMBS DQs have risen significantly, with Jan tracking at 6.3%, up significantly from 1.58% in Dec 2022. And while everyone knows the Office canary in the coalmine is dead and buried, keep an eye on Multifamily CMBS DQs which tracked at 1.91% vs 2.62% in December, with the sequential decline associated with a large San Francisco apartment loan that was recently disposed. The overall DQ rate tracked at 4.66% in January.
The Goldman strategist concludes with a word about CRE transaction and leasing: U.S. CRE transaction market continues to be muted, primarily driven by elevated interest rates, limited sources of capital, and the pricing gap between buyers and sellers. January volume was down -11% yoy, driven by easier compares in Jan 2023 (down -55%). In terms of leasing, Jan preliminary trends indicate weakness in activities, with office down -25% yoy and industrial down -28% yoy.
Here, Goldman trader Sara Cha chimes in (her report is also available to pro subs) and notes that we can see from the transaction data “why sentiment in CRE brokers is a bit more mixed of late – thought yesterday’s JLL print had mixed reception – while you’ve seen some signs of life in capital markets space broadly to start the year, not seeing that as much on the CRE front (remember those 3Q-4Q greenshoots?).“
Multifamily CRE
The commercial real estate sector continues to experience elevated stress . The latest crack to emerge is the increasing number of delinquencies on multifamily mortgages.
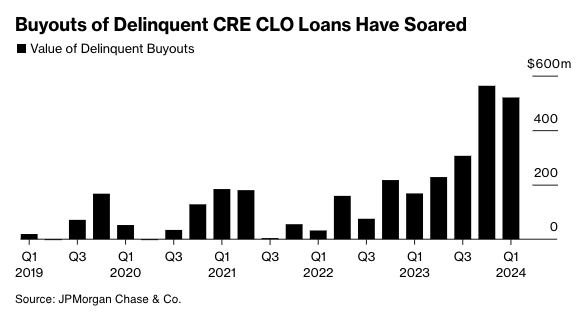
In April, about 8.6% of commercial real estate loans bundled into collateralized loan obligations were distressed, reaching the record high set in January, according to Bloomberg, citing new data from analytics firm CRED iQ.
The loans bundled into CRE CLOs were merged with funds from individual investors to acquire multifamily housing during the Covid era. After that, borrowing rates surged, catching many off guard. A significant portion of the deteriorating loans had floating-rate interest rates, putting massive pressure on landlords’ cash flows, diminishing the market worth of the properties, and obliterating equity in a large number of investments.
According to data provider Trepp, $78.5 billion of CRE CLO loans are outstanding. This means many CRE CLO issuers are racing to find ways to prevent a tsunami of bad loans from defaulting or risk losing the fees they collect on the securities.
Recent estimates from JPMorgan show lenders purchased $520 million of delinquent loans in the first quarter of this year. Lenders have been ramping up the number of buyouts over the last four quarters because of mounting bad loans in a period of elevated rates.
Source: Bloomberg
JPMorgan strategist Chong Sin said he’s surprised by lenders’ ability to obtain warehouse lines to purchase bad debt, given tightening credit conditions.
“The reason these managers are engaged in buyouts is to limit delinquencies,” Sin said, adding, “The wild card here is, how long will financing costs remain low enough for them to do that?”
Anuj Jain, an analyst at Barclays Plc, expects buyouts to continue as distress increases across the CRE CLO space.
“If the outlook for the Fed shifts materially to hikes or no rate cuts for a while, that might lead to a sharp increase in delinquencies, which can stifle issuers’ ability to buy out loans,” Jain said.
Bloomberg explains much of the CLO space derives from multifamily bridge loans originated around 2021-2022:
CRE CLO issuance surged to $45 billion in 2021, a 137% increase from two years earlier, when buyers of apartment blocks sought to profit from the wave of workers moving to the Sun Belt from big cities. Three-year loans would give them time to complete upgrades and refinance, the thinking went.
Fast forward to today and the debt underpinning many of the bonds is coming due for repayment at a time when there’s less appetite for real estate lending, insurance costs have skyrocketed and monetary policy remains tight. Hedges against borrowing cost increases are also expiring and cost significantly more to purchase now.
Those blows helped increase multifamily assets classed as distressed to almost $10 billion at the end of March, a 33% rise since the end of September, according to data compiled by MSCI Real Assets.
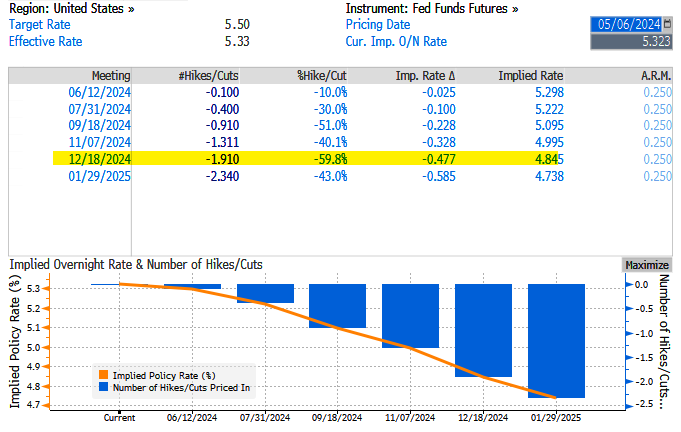
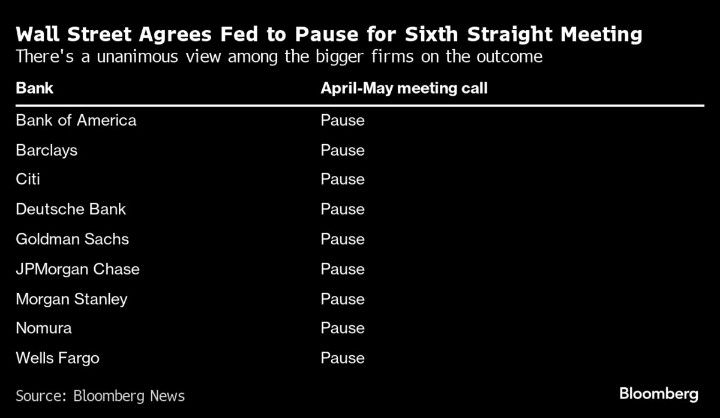
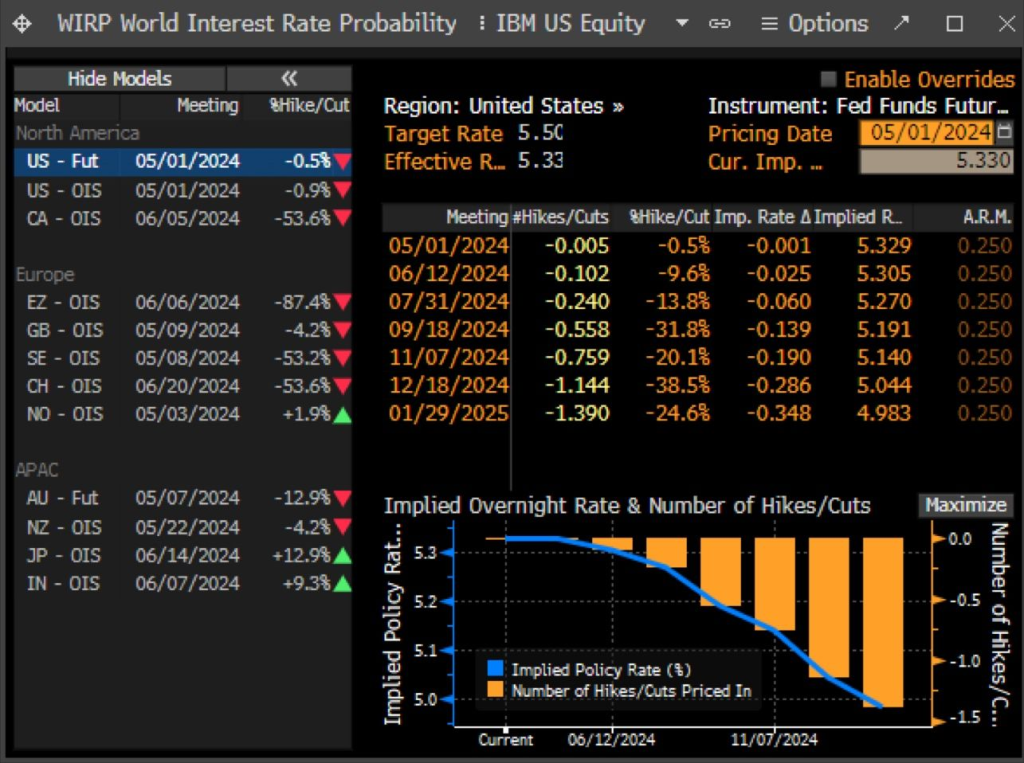
Last Wednesday, the Fed left interest rates unchanged at around 550bps as inflation data reaccelerates and economic growth tilts to the downside, stoking stagflation fears.
Fed swaps are pricing in just under two cuts – this is down from nearly seven earlier this year and about 1.14 before last week’s FOMC.
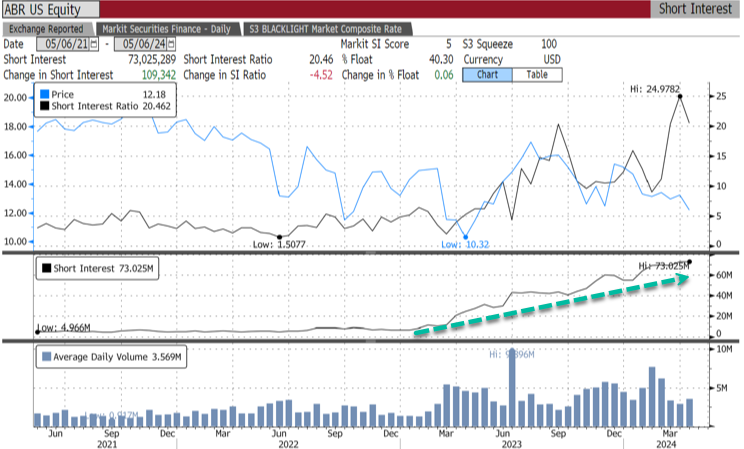
Meanwhile, bears are piling in on CRE CLO issuer Arbor Realty Trust Inc., with 40.3% of the float short, equivalent to 73 million shares short.
“The multifamily CRE CLO market was not prepared for rate volatility,” said Fraser Perring, the founder of Viceroy Research, which has placed bear bets against Arbor, adding, “The result is significant distress.”
The longer the Fed delays rate cuts, the worse the CRE mess will get.
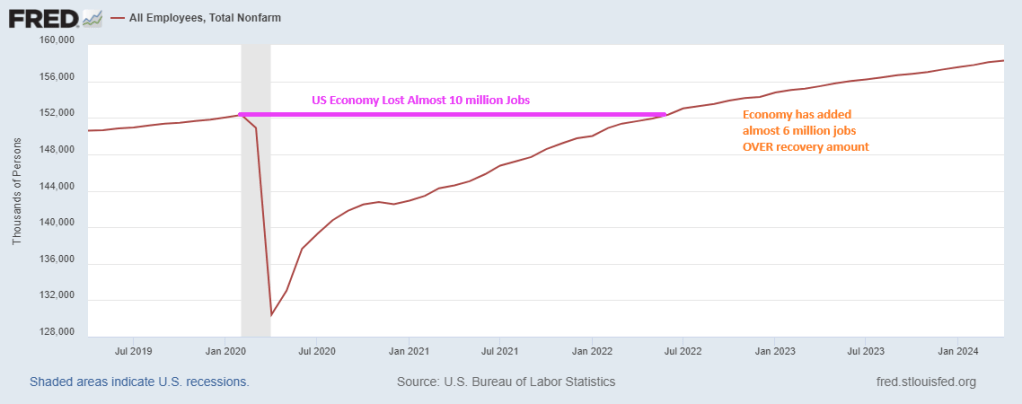
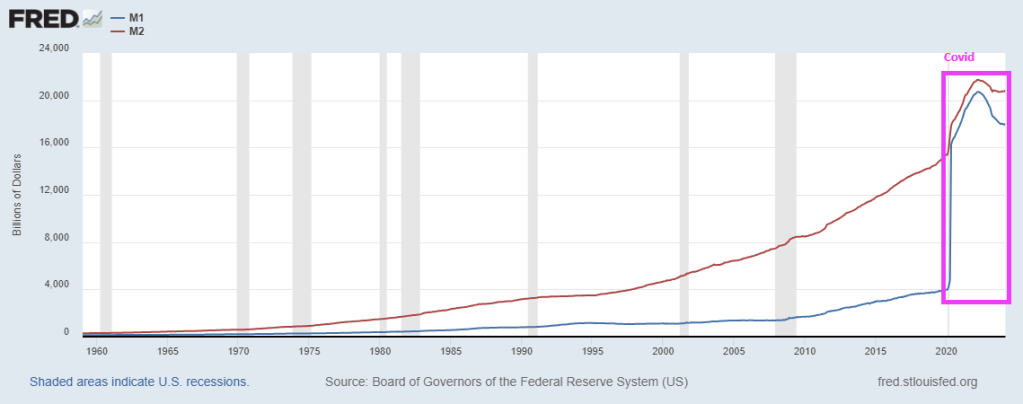
Perhaps Fed Chair Jerome Powell was listening to Prince’s “Let’s Go Crazy!” Because The Fed went crazy with money printing to counteract the shutdown of the US economy in 2020.
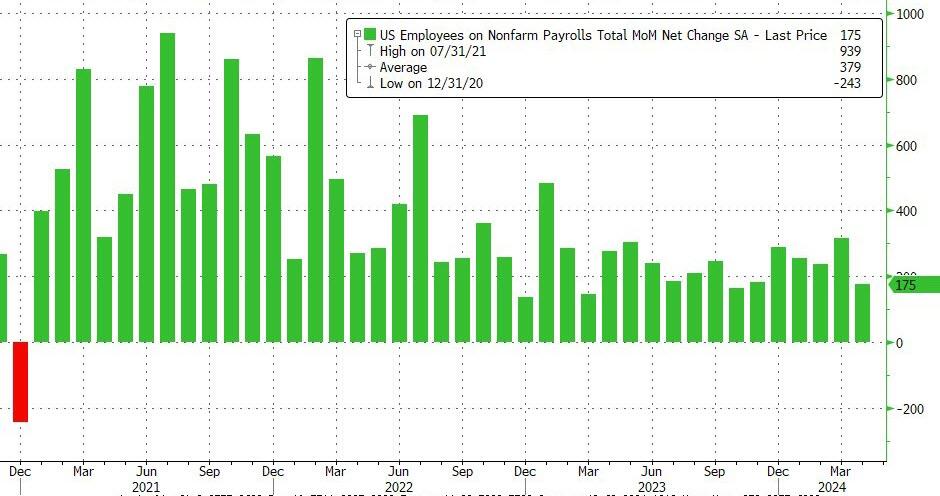
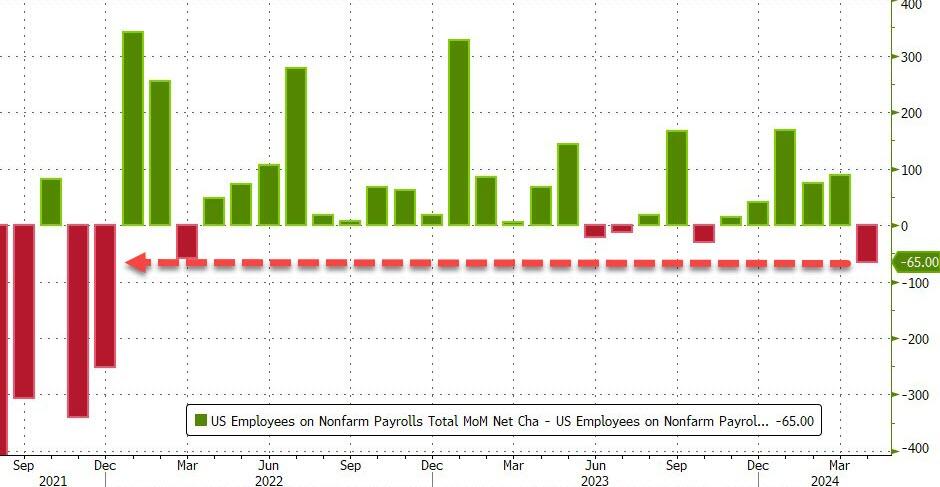
The US jobs market peaked in February 2020 under Trump at 152,309,000. Then COVID struck in March 2020 and the US economy lost almost 10 million jobs by December 2020. But when the fear ebbed and the economy opened back up, it took until June 2022 to recover the lost jobs. But since June 2022, the US economy has added almost 6 million jobs (many are part-time jobs and taken by foreign-born workers).
In terms of money printing, The Fed went crazy printing.
In fact, M1 Money year-over-year (YoY) rose a staggering 360% in February 2021. M2 Money, a broader measure of money, grew at a rate of 26.75% YoY in February 2021. Remember, Biden was sworn in as President in January 2021.
Yes, Biden’s purported jobs miracle is actually a part-time jobs recovery. Good luck buying a home on a part-time job.
Despite the staggering increase in money printing, TreasSec Yellen and Jared Bernstein still can’t explain why inflation isn’t transitory.
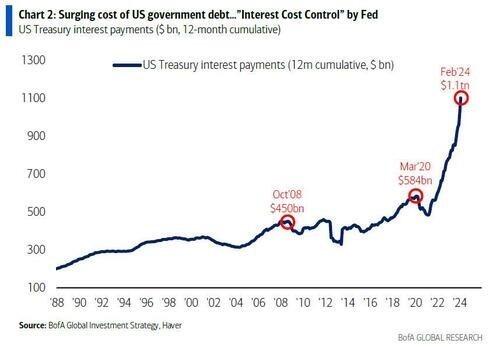
We are talking about the nation’s unhinged monetary politburo domiciled in the Eccles Building (The Federal Reserve), of course. It is bad enough that their relentless inflation of financial assets has showered the 1% with untold trillions of windfall gains, but their ultimate crime is that they lured the nation’s elected politician into a veritable fiscal trance. Consequently, future generations will be lugging the service costs on insuperable public debts for years to come.
For more than two decades these foolish PhDs and monetary apparatchiks drove the entire Treasury yield curve to rock bottom, even as public debt erupted skyward. In this context, the single biggest chunk of the Treasury debt lies in the 90-day T-bill sector, but between December 2007 and June 2023 the inflation-adjusted yield on this workhorse debt security was negative 95% of the time.
That’s right. During that 187-month span, the interest rate exceeded the running (LTM) inflation rate during only nine months, as depicted by the purple area picking above the zero bound in the chart, and even then by just a tad. All the rest of the time, Uncle Sam was happily taxing the inflationary rise in nominal incomes, even as his debt service payments were dramatically lagging the 78% rise of CPI during that period.
Inflation-Adjusted Yield On 90-Day T-bills, 2007 to 2022
The above was the fiscal equivalent of Novocain. It enabled the elected politicians to merrily jig up and down Pennsylvania Avenue and stroll the K-Street corridors dispensing bountiful goodies left and right, while experiencing nary a moment of pain from the massive debt burden they were piling on the main street economy.
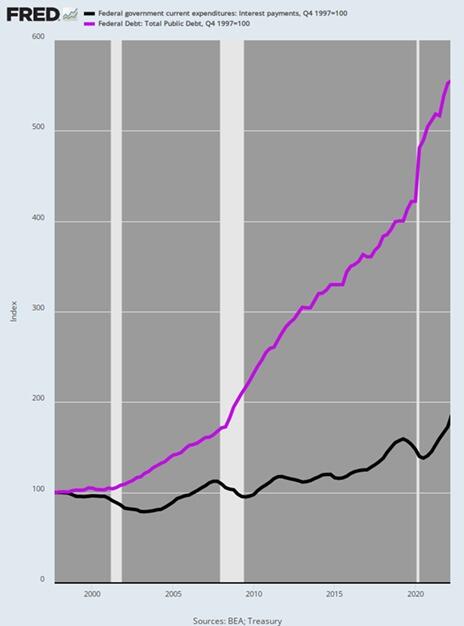
Accordingly, during the quarter-century between Q4 1997 and Q1 2022 the public debt soared from $5.5 trillion to $30.4 trillion or by 453%. In any rational world a commensurate rise in Federal interest expense would have surely awakened at least some of the revilers.
But not in Fed World. As it happened, Uncle Sam’s interest expense only increased by 73%, rising from $368 billion to $635 billion per year during the same period. By contrast, had interest rates remained at the not unreasonable levels posted in late 1997, the interest expense level by Q1 2022, when the Fed finally awakened to the inflationary monster it had fostered, would have been $2.03 trillion per annum.
In short, the Fed reckless and relentless repression of interest rates during that quarter century fostered an elephant in the room that was one for the ages. Annualized Federal interest expense was fully $1.3 trillion lower than would have been the case at the yield curve in place in Q4 1997.
Alas, the missing interest expense amounted to the equivalent of the entire social security budget!
So, we’d guess the politicians might have been aroused from their slumber had interest expense reflected market rates. Instead, they were actually getting dreadfully wrong price signals and the present fiscal catastrophe is the consequence.
Index Of Public Debt Versus Federal Interest Expense, Q4 1997-Q1 2022
Needless to say, the US economy was not wallowing in failure or under-performance at the rates which prevailed in 1997. In fact, during that year real GDP growth was +4.5%, inflation posted at just 1.7%, real median family income rose by 3.2%, job growth was 2.8% and the real interest rates on the 10-year UST was +4.0%
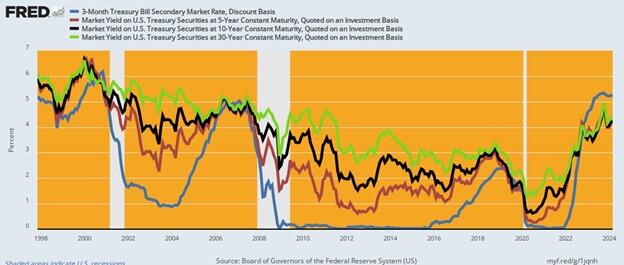
In short, 1997 generated one of the strongest macroeconomic performances in recent decades—even with inflation-adjusted yields on the 10-year UST of +4.0%. So there was no compelling reason for a massive compression of interest rates, but that is exactly what the Fed engineered over the next two decades. As shown in the graph below, rates were systematically pushed lower by 300 to 500 basis points across the curve by the bottom in 2020-2021.
Current yields are higher by 300 to 400 basis points from this recent bottom, but here’s the thing: They are only back to nominal levels prevalent at the beginning of the period in 1997, even as inflation is running at 3-4% Y/Y increases, or double the levels of 1997.
US Treasury Yields, 1997 to 2024
Unfortunately, even as the Fed has tepidly moved toward normalization of yields as shown in the graph above, Wall Street is bringing unrelenting pressure for a new round of rates cuts, which would result in yet another spree of the deep interest rate repression and distortion that has fueled Washington’s fiscal binge since the turn of the century.
As it is, the public debt is already growing at an accelerating clip, even before the US economy succumbs to the recession that is now gathering force. And we do mean accelerating. The public debt has recently been increasing by $1 trillion every 100 days. That’s $10 billion per day, $416 million per hour.
In fact, Uncle Sam’s debt has risen by $470 billion in the first two months of this year to $34.5 trillion and is on pace to surpass $35 trillion in a little over a month, $37 trillion well before year’s end, and $40 trillion some time in 2025. That’s about two years ahead of the current CBO (Congressional Budget Office) forecast.
On the current path, moreover, the public debt will reach $60 trillion by the end of the 10-year budget window. But even that depends upon the CBO’s latest iteration of Rosy Scenario, which envisions no recession ever again, just 2% inflation as far as the eye can see and real interest rates of barely 1%. And that’s to say nothing of the trillions in phony spending cuts and out-year tax increases that are built into the CBO baseline but which Congress will never actually allow to materialize.
What is worse, even with partial normalization of rates, a veritable tsunami of Federal interest expense is now gathering steam. That is because the ultra-low yields of 2007 to 2022 are now rolling over into the current market rates shown above—at the same time that the amount of public debt outstanding is heading skyward. As a result, the annualized run rate of Federal interest expense hit $1.1 trillion in February and is heading for $1.6 trillion by the end of the current fiscal year in September.
Finally, even as the run-rate of interest expense has been soaring, the bureaucrats at the US Treasury have been drastically shortening the maturity of the outstanding debt, as it rolls over. Accordingly, more than $21 trillion of Treasury paper has been refinanced in the under one-year T-bill market, thereby lowering the weighted-average maturity of the public debt to less than five- years.
The apparent bet is that the Fed will be cutting rates soon. As is becoming more apparent by the day, however, that’s just not in the cards: No matter how you slice it, the running level of inflation has remained exceedingly sticky and shows no signs of dropping below its current 3-4% range any time soon.
What is also becoming more apparent by the day is that the money-printers at the Fed have led Washington into a massive fiscal calamity. It is only a matter of time, therefore, until the excrement hits the fan like never before.
And with Bidenomics killing off household excess savings, we won’t be going down to the nightclub anymore.
Surprise! Just in time for the November election, this is a negative surprise that Biden doesn’t want to hear.
The Citi Economic Surprise index crashed to -7.30, the lowest since January 2023.
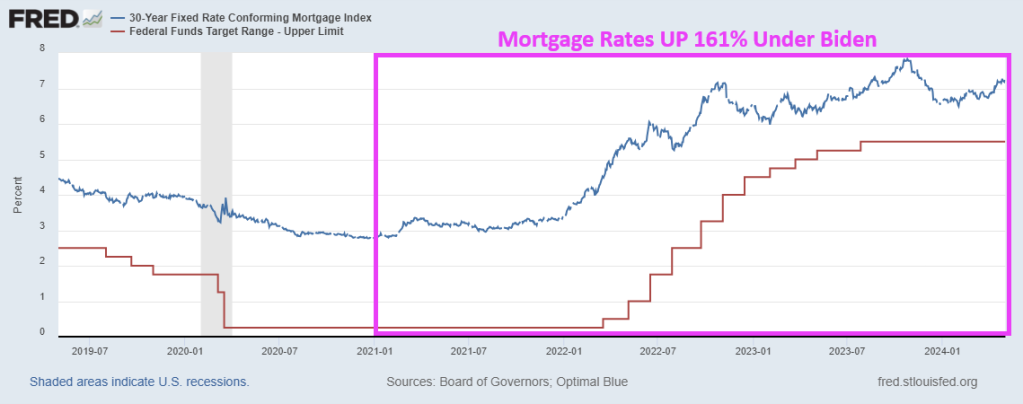
Under Biden’s leadership (hell, he and his family already own several mansions … on a Senator’s pay), home prices are up 32% under Biden and mortgage rates are up a staggering 160%.
Getting young households who rent to buy a home in this environment will require magic.
There are TWO taxes that are hitting people making under $400,000 per year. First, the INFLATION tax coming from Biden’s/Congresses spending binge, The Fed printing gobs of money, and insane regulations.
Biden and his mouthpieces like Karine Jean Pierre (KJP) claim that Biden inherited inflation from Trump. FALSE. Inflation was only 1.3% YoY in December 2020. Inflation was 3.5% YoY in March 2024, an increase of 166% over Trump’s final month in office. THAT is one heck of an inflation tax.
In House testimony, Treasury Secretary Janet Yellen (falsely) claimed that Biden’s massive tax increase won’t hit middle class households. That is a plain lie. the Tax Foundation said that someone who’s married, two kids, making $85,000 would pay $1,700 more in taxes. A married couple with two children making $165,000 annually would pay $2,450.50 more than in the previous year, while a family with three kids pulling in $200,000 per year will shell out almost $7,500 more per year.
So much for Biden’s “No one making under $400,000 will pay and additional penny of tax.” Between the inflation tax and Biden letting Trump’s Tax Cuts and Jobs Act’s (TCJA) expire, people making under $400,000 per year will get scalded. All so Biden/Congress can keep spending on Ukraine, fund endless wars, and buy countries cooperation with the US.
.. and a huge miss to estimates of 240K… in fact, as shown below, this was the biggest miss since Dec 2021
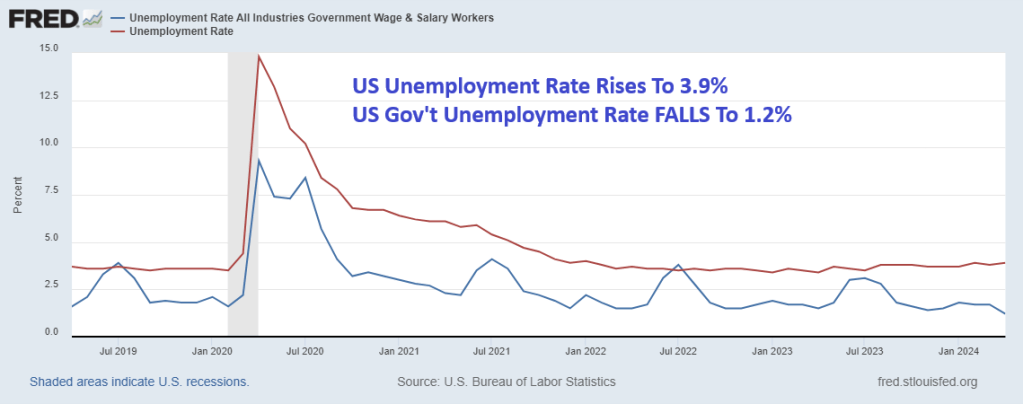
The weakness was pervasive, and while payrolls were a huge miss, the unemployment rate also rose more than expected, from 3.8% to 3.9%, vs estimates of an unchanged print.
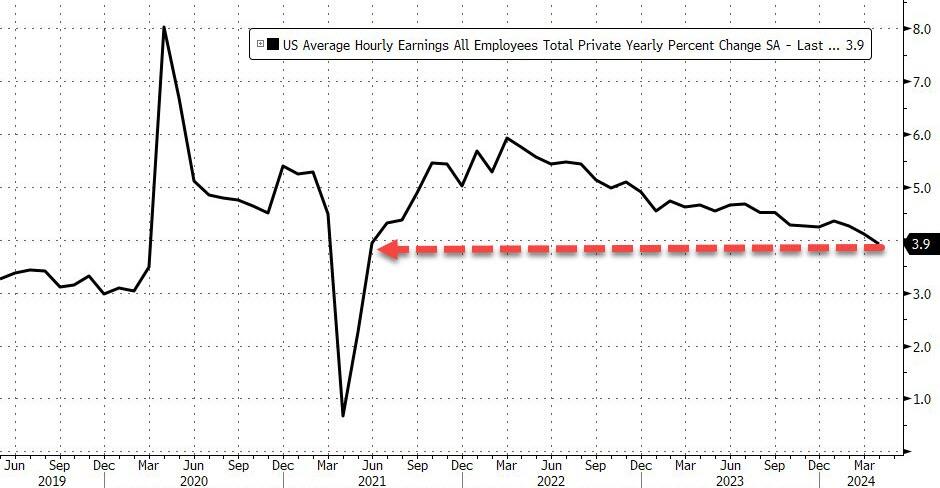
Wages also eased back with average hourly earnings rising 0.2% MoM, below the expected 0.3% increase and down from last month’s 0.3% print. On an annual basis, earnings rose 3.9%, down from 4.1% last month and below the 4.0% estimate.
Yellen: Mortgage rates have been so low for so long that it’s created a lock-in effect where people don’t want to sell their homes to buy new ones for fear of losing their attractive rates.
That’s made it “almost impossible” for first-time homebuyers to enter the housing market, U.S. Treasury Secretary Janet Yellen said during her testimony before the House Ways and Means Committee.
Now hold on a minute, Janet. YOU were the one that kept rates too low for too long as Federal Reserve Chair.
What was her record on mortgage rates? Yellen kept the Fed target rate (upper bound) at 25 basis points under Obama/Biden until December 2015, so only one rate hike under Obama/Biden. Then came the election of Donald Trump in November 2016. Then Yellen raised The Fed target rate 4 times after Trump was elected.
Mortgage rates fell to 3.78% by November 2017, so Yellen helped keep mortgage rates low. But mortgage rates soared after Trump’s election to 4.22% by the end of her term.
There are other reasons why first-time homeownership is so difficult, like local NIMBY (not in my back yard) policies and the absolutely lousy labor market.
She added that Biden’s massive tax increase won’t hit middle class households (other than the massive INFLATION tax that was levied by Biden). That is a plain lie. the Tax Foundation says that someone who’s married, two kids, making $85,000 would pay $1,700 more in taxes. A married couple with two children making $165,000 annually would pay $2,450.50 more than in the previous year, while a family with three kids pulling in $200,000 per year will shell out almost $7,500 more per year.
So much for Biden’s “No one making under $400,000 will pay and additional penny of tax.”
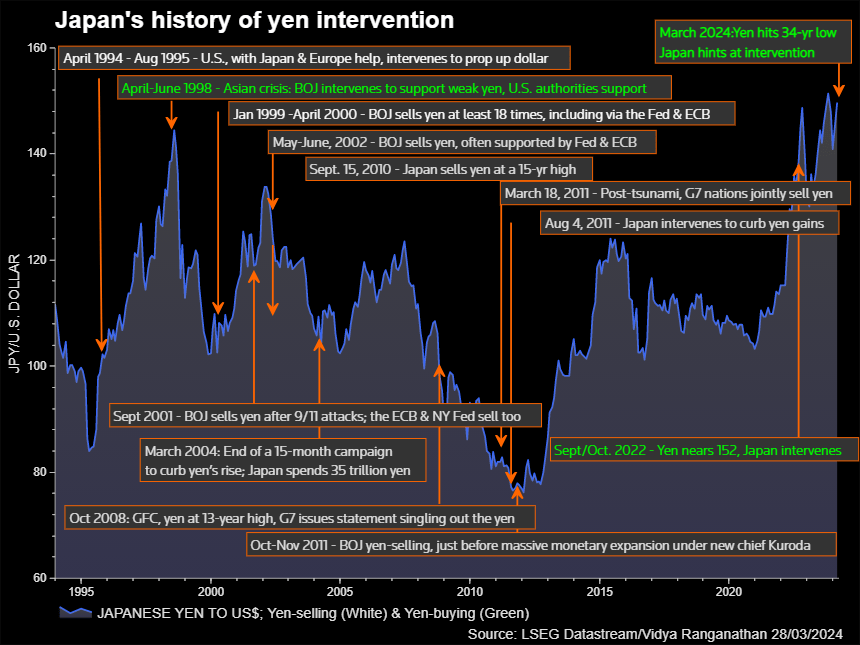
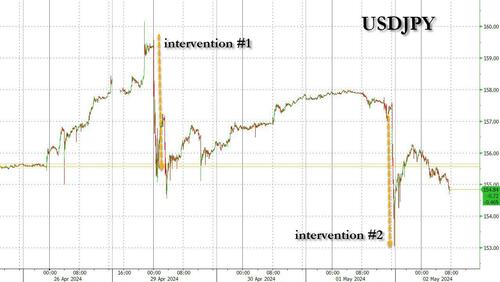
Tokyo’s latest entry into the market was likely around ¥3.5 trillion ($22.5 billion), based on a comparison of Bank of Japan accounts and money broker forecasts.
The BOJ reported Thursday that its current account will probably fall ¥4.36 trillion due to fiscal factors on the next business day of Tuesday. That compares with the ¥833 billion average forecast by money brokers of what the number would be without intervention.
The figures, released less than a day after the yen jumped sharply during US trading hours, indicate that Japanese authorities made the unusual move of stepping into the market shortly after a Federal Reserve meeting when investors were still digesting the announcement. That would signal the finance ministry is taking an increasingly aggressive stance in what could become a prolonged fight to support the yen.
“With Japanese holidays and US jobs data coming up, it was a very good time for the authorities to tackle speculators,” said Yuya Kikkawa, an economist at Meiji Yasuda Research Institute. “This will have a great impact on the market. I sense a strong determination by the authorities to defend the 160-yen-per-dollar line.”
The latest swing in the yen follows a similarly sudden jump on Monday. Central bank accounts suggested Monday’s move was likely an intervention by Tokyo worth around ¥5.5 trillion, close to the daily record of ¥5.6 trillion set in October 2022.
Ahead of the move late Wednesday in New York and early Thursday in Tokyo, Central Tanshi Co. and Totan Research Co. had forecast a ¥700 billion decline in the BOJ’s current account balance due to fiscal factors including government bond issuance and tax payments. Ueda Yagi Tanshi projected the balance to drop by ¥1.1 trillion.
The calculations based on a comparison of those estimates and the central bank accounts offer only ballpark figures rather than specific amounts. Similar analysis proved accurate in showing that a jump in the yen in jittery markets in October 2023 was not the result of Japan stepping in to buy the currency.
The calculations also estimated the size of intervention on Oct. 21, 2022 at around ¥5.5 trillion, closely matching the actual amount.
An official monthly figure for the size of intervention will come out on May 31. Traders will need to wait until August or later to see daily operation data.
Japan’s top currency official Masato Kanda declined Thursday to comment on whether the finance ministry had intervened two hours earlier in Tokyo, when the yen strengthened sharply against the dollar. Japan’s currency briefly touched 153.04 from around the 157.50 mark.
Kanda oversaw the previous cycle of interventions in 2022. The ministry bought the yen around 30 minutes after the BOJ’s governor press conference ended in September that year. Another round of moves came a month later with back-to-back business day interventions.
The pattern of Japanese officials declining to comment is aimed at keeping market participants in the dark. A lack of immediate clarity may help keep traders more on edge and less willing to bet against the yen even if the ministry hasn’t actually taken action.
“By acting right after the Fed decision and outside of Japan hours, they dished out a warning that they are in a position to intervene 24 hours a day,” said Hirofumi Suzuki, chief FX strategist at Sumitomo Mitsui Banking Corp.
“We are still waiting for US employment figures during the Golden Week holidays and depending on the outcome of that data, there is a risk of further intervention,” he said.
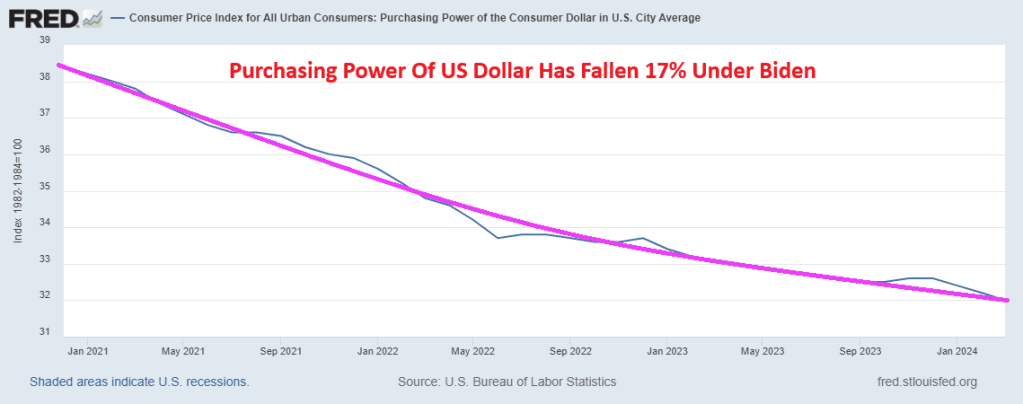
The US is having its own currency problems under Biden with its own bad fiscal and monetary polcies. The Purchasing Power of the US Dollars has fallen 17% under Biden.


You must be logged in to post a comment.