President Obama selected Slow Joe Biden as his Vice President because 1) he was white and 2) an alleged foreign policy wizard in The Senate. Between Afghanistan, Ukraine, Israel, Taiwan and every other foreign policy disaster under his leadership, I am beginning to doubt Biden’s foreign policy acumen. For example …
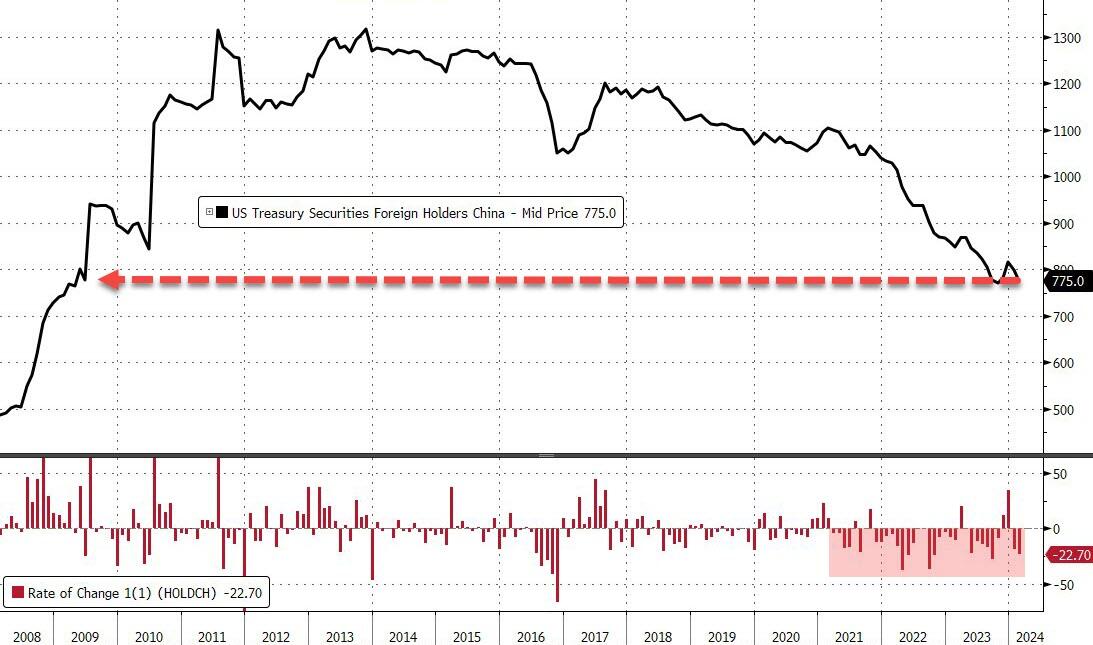
For the 9th month of the last 11, China’s Treasury holdings declined in February (the latest TIC data), dropping by $22.7BN. Additionally, it has now been 24 of the last 28 months that China’s Treasury holdings have declined, now back at practically its lowest level since June 2009…

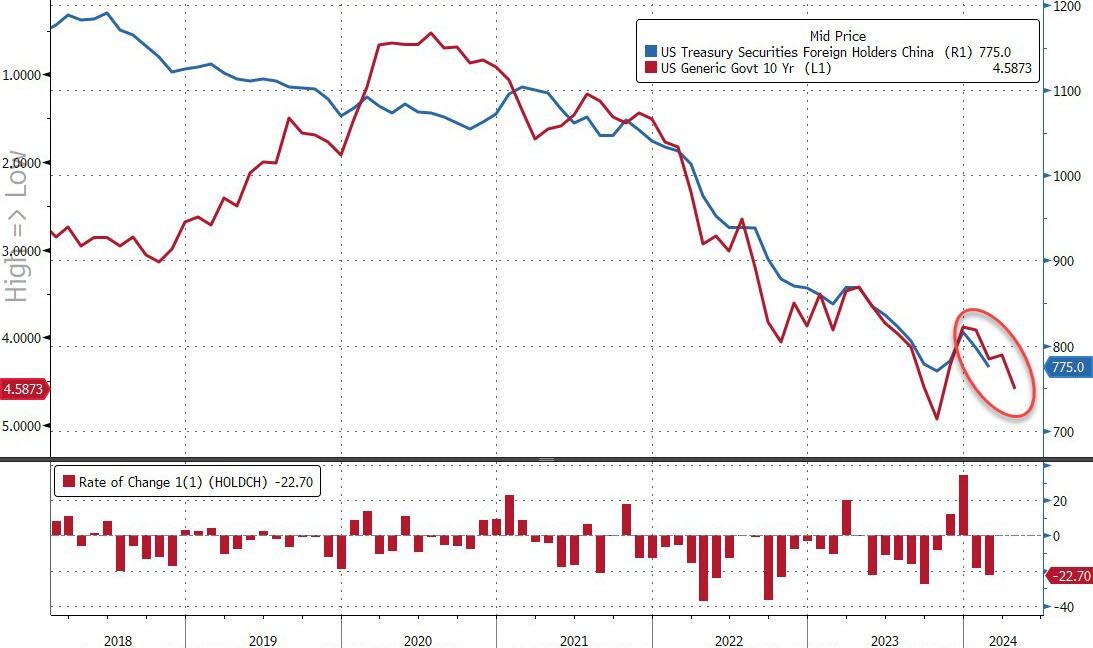
While we are acutely aware of the fact that ‘correlation is not causation’, one would find it hard to argue that the practically perfect concomitance of China’s Treasury holdings and the yield of the US 10Y Treasury note over the past three years makes us wonder (in our out-loud voices), if – away from The QT, The FedSpeak, the macro-economy, the geopolitical crises, the AI-hype, the growth scares – if it’s not just all a well-managed (slow and steady) liquidation of China’s (still massive) US Treasury holdings…

It’s hard to argue they don’t have an incentive to a) de-dollarize, and b) not liquidate it all at once, shooting themselves in the face.
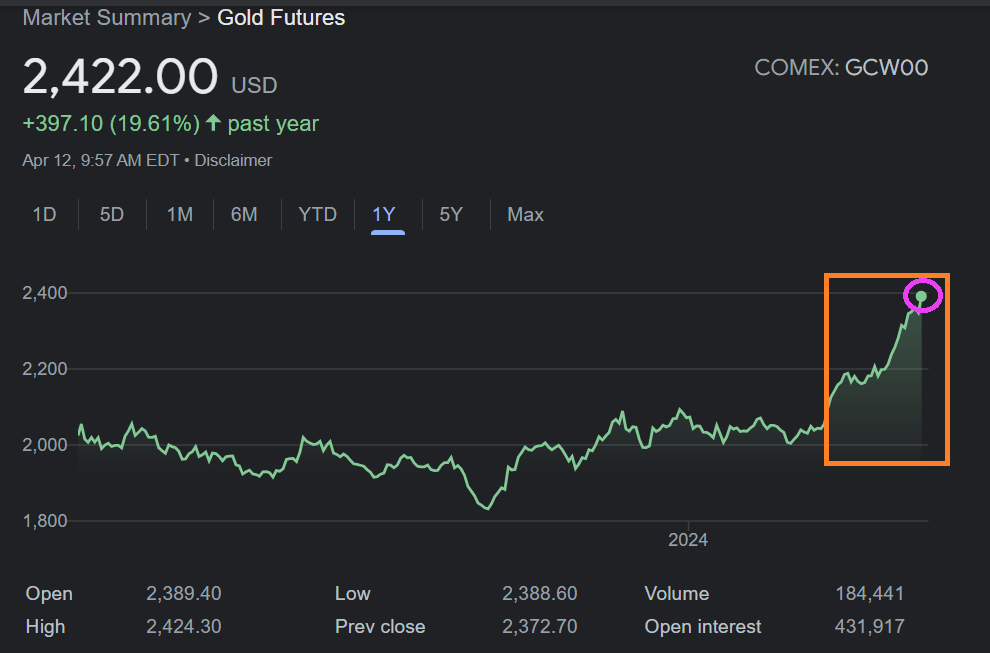
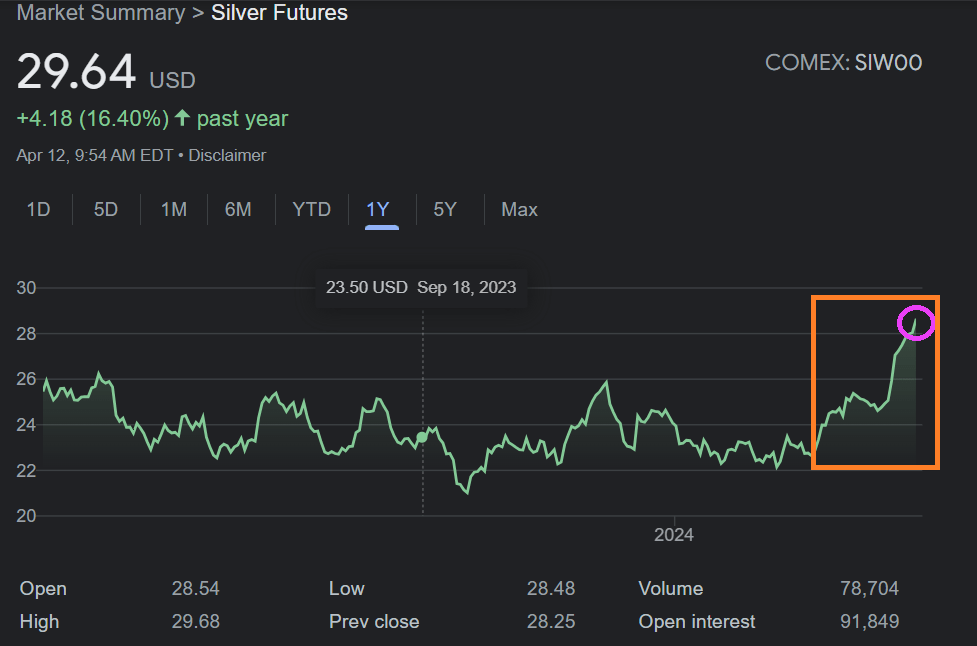
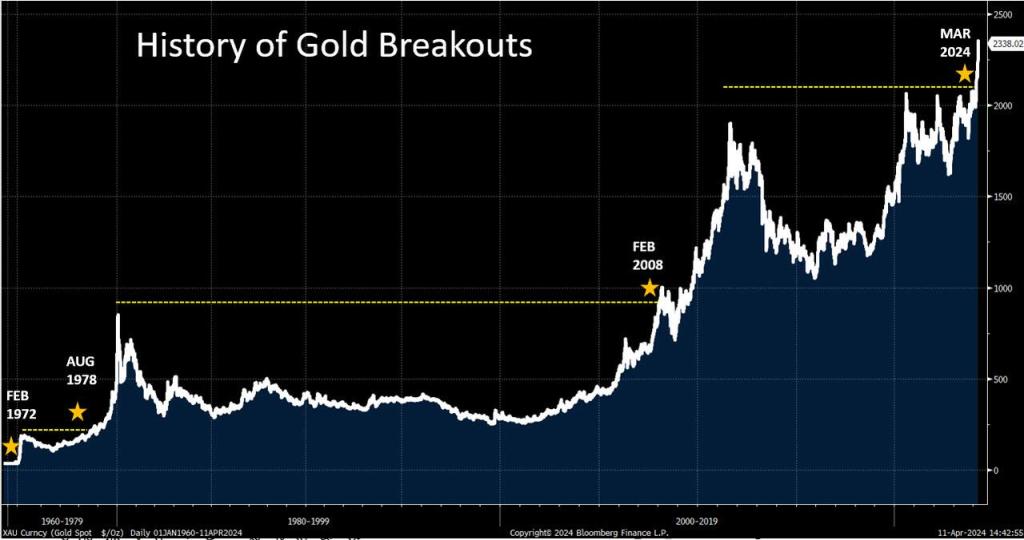
While the de-dollarizing has been steady in Treasury-land (enabled by a vast sea of liquid other players), things have been a little more ‘obvious’ in the alternative currency space – i.e gold.
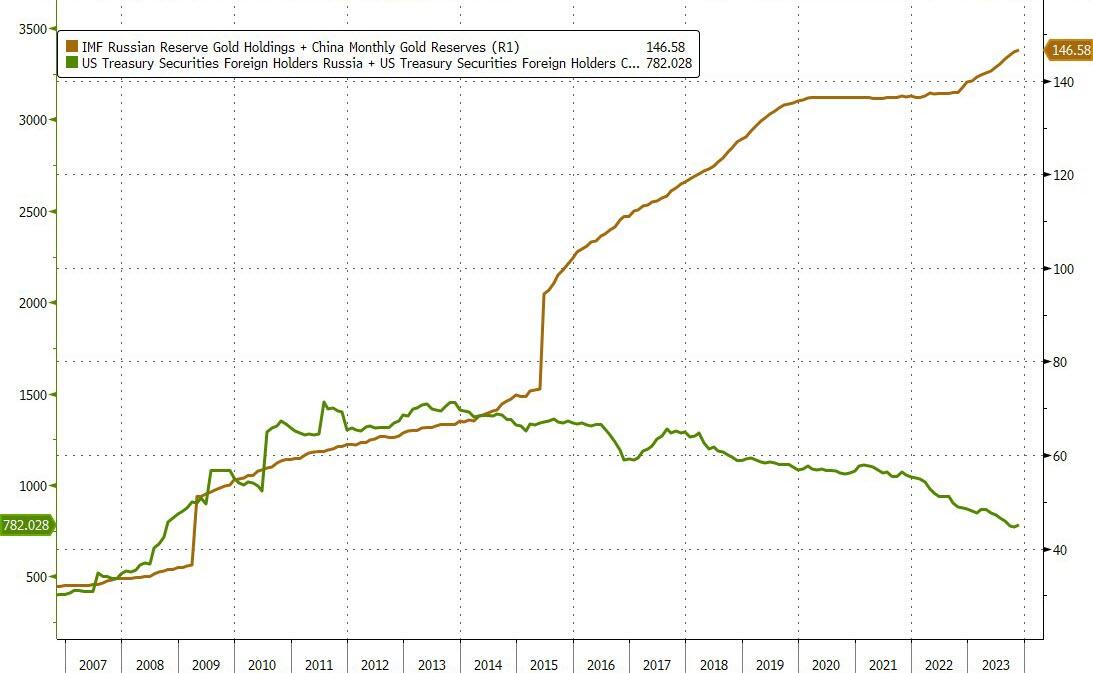
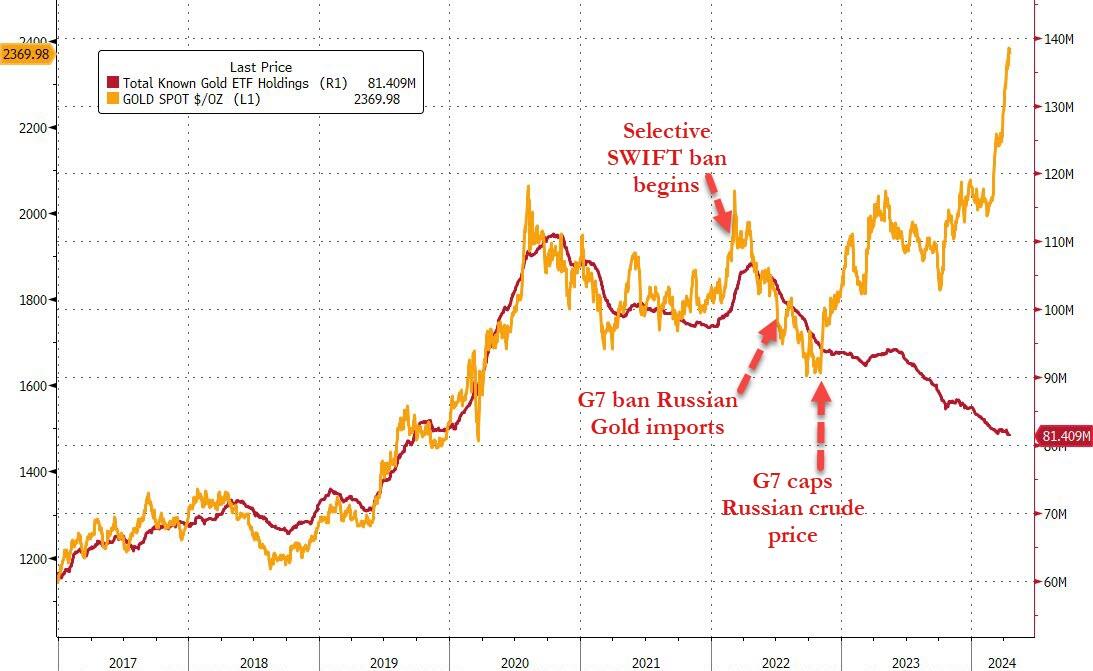
The 2015 jump in the chart below was when China suddenly admitted to its gold holdings (well some of them we assume) after no disclosure since 2009. Since then both China and Russia (the gold line below), have been hoarding the precious metal while dumping Treasuries…
And in case you wondered, it’s not just China and Russia, world reserve Treasury holdings are ‘relatively’ flat (based on Fed’s custody data) while according to The IMF, the world’s sovereign nations have been buying gold with both hands and feet…
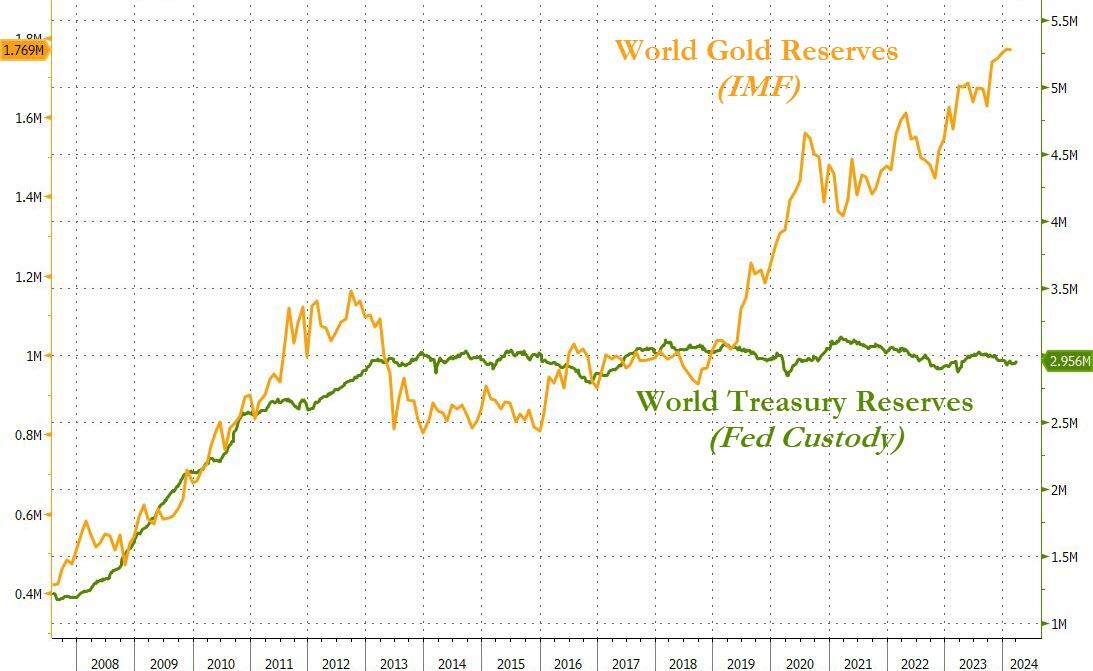
…happy to take whatever retail-ETF-sellers are offering into their physical vaults…

Finally, as we note in the chart, this all started to ‘escalate quickly’ when Washington really started to weaponize the dollar.
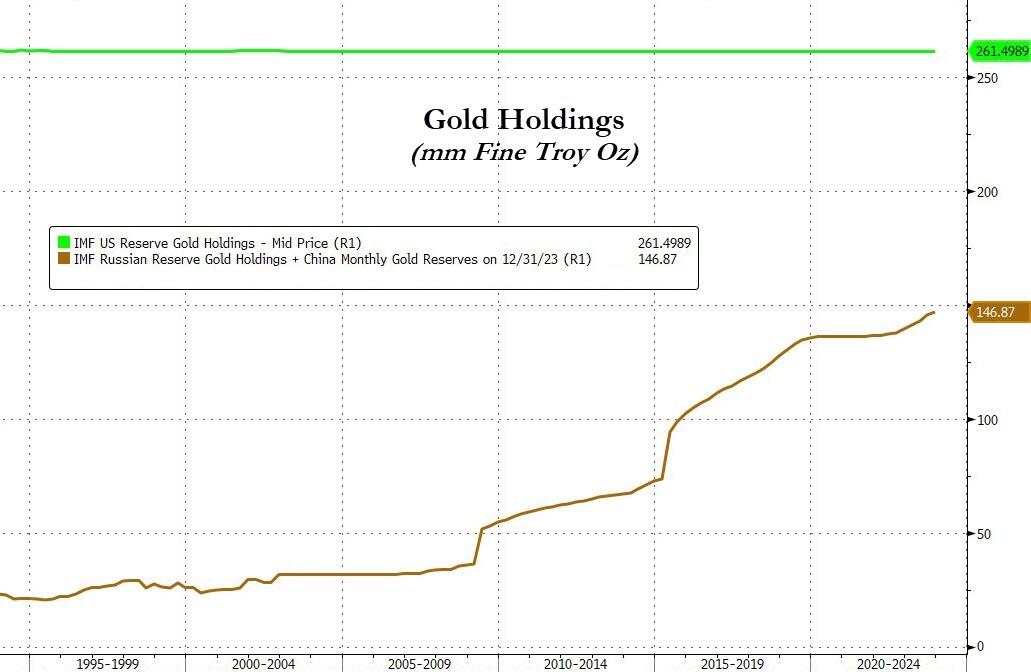
Assuming that all the US gold is still in Fort Knox (and assuming that China and Russia are honest about their holdings), the world’s ‘other superpowers’ are rapidly catching up to the US’ holdings…
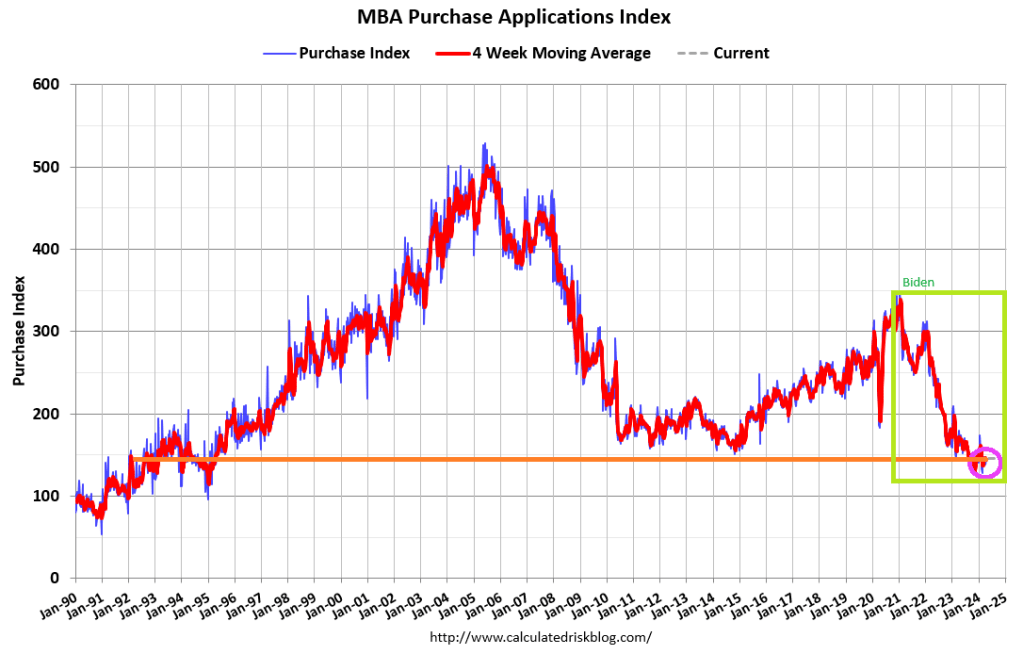
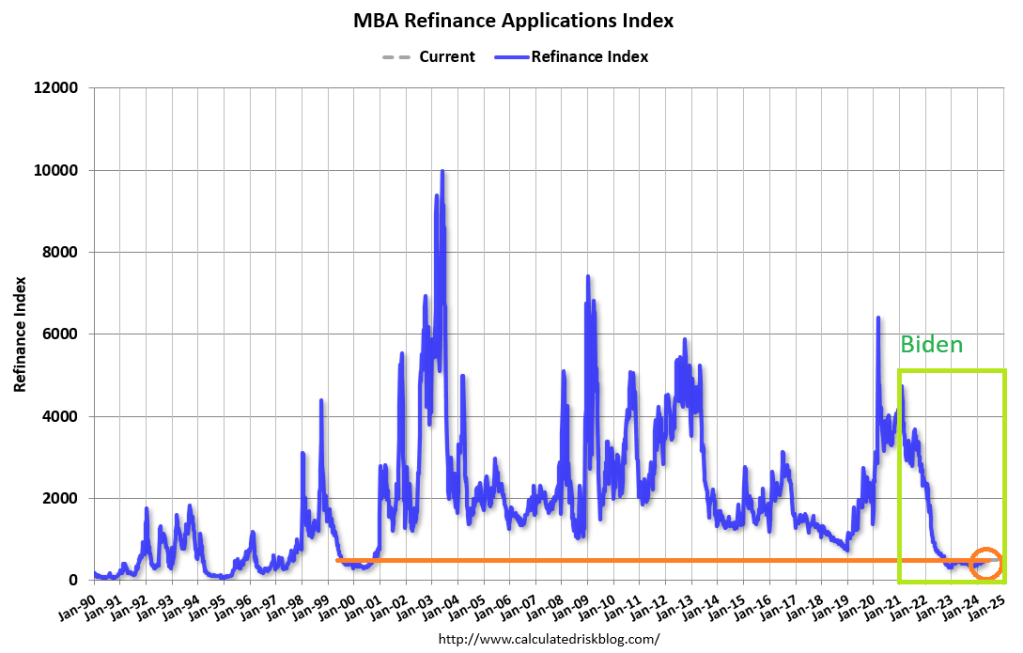
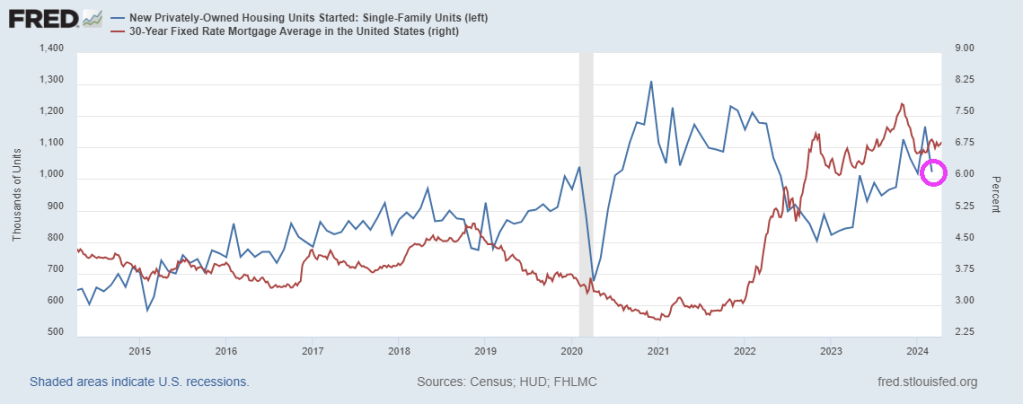
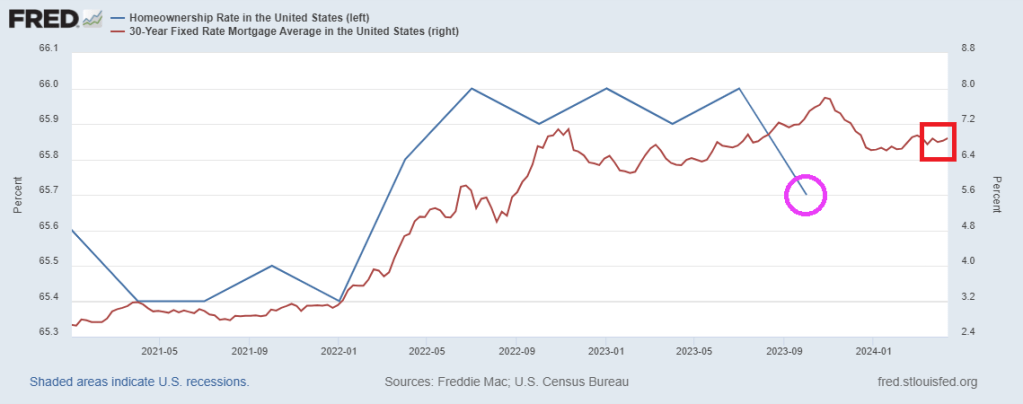
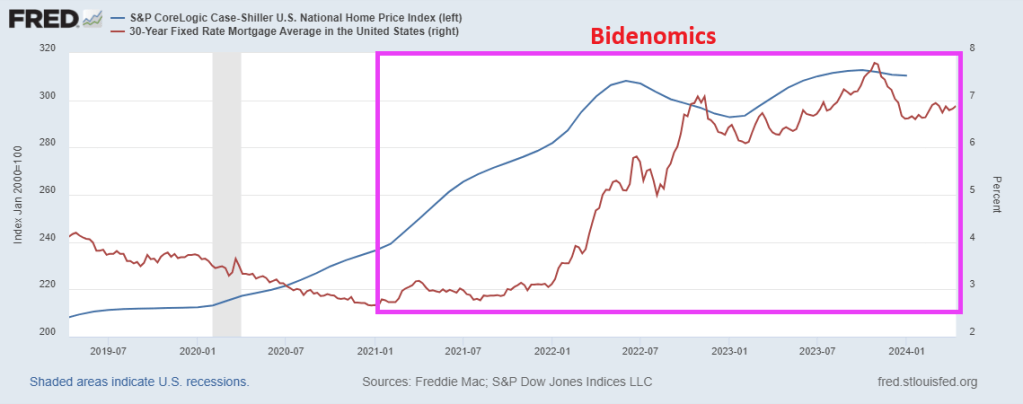
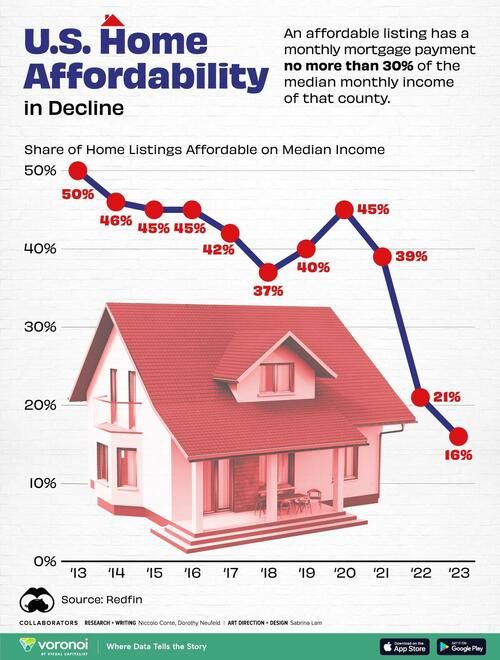
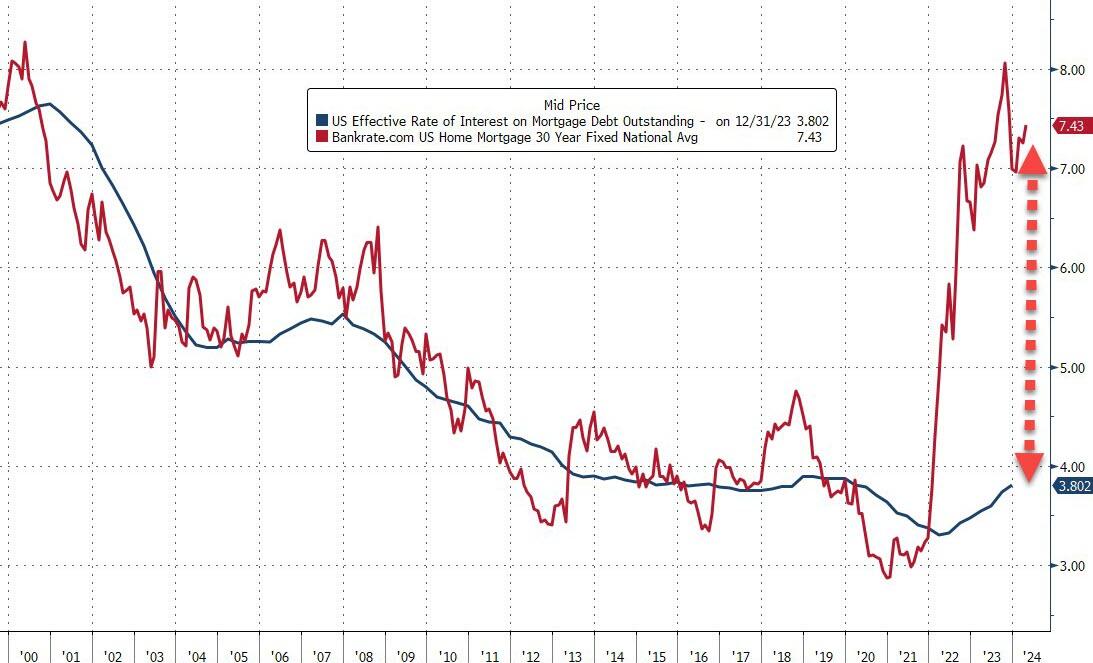
Who could have seen that coming? With mortgage rates hitting 7.5%, the home price to median household income ratio just hit an all-time high.

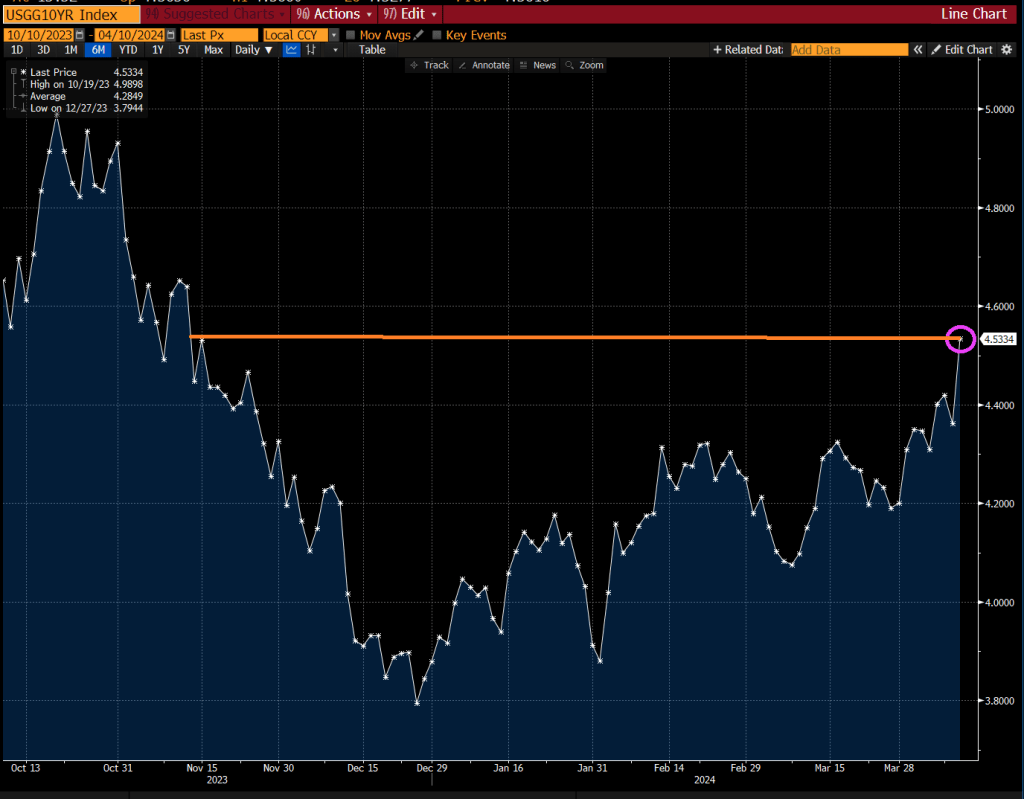
The 10Y Treasury yield just hit 4.519%.

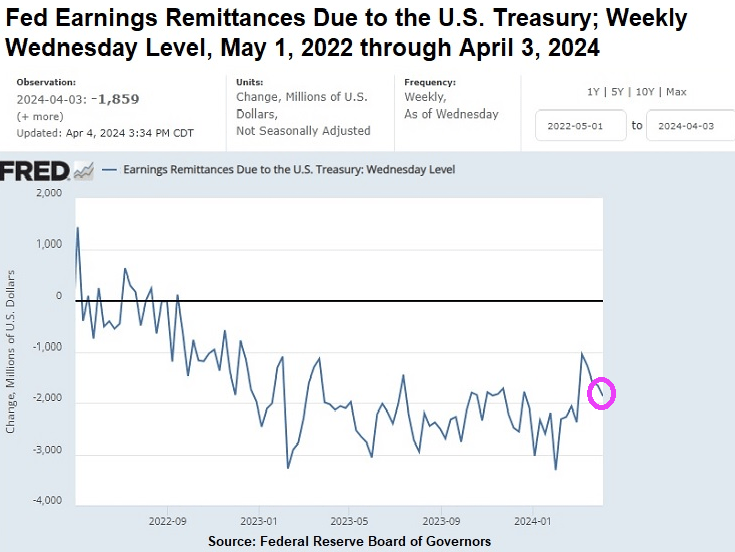
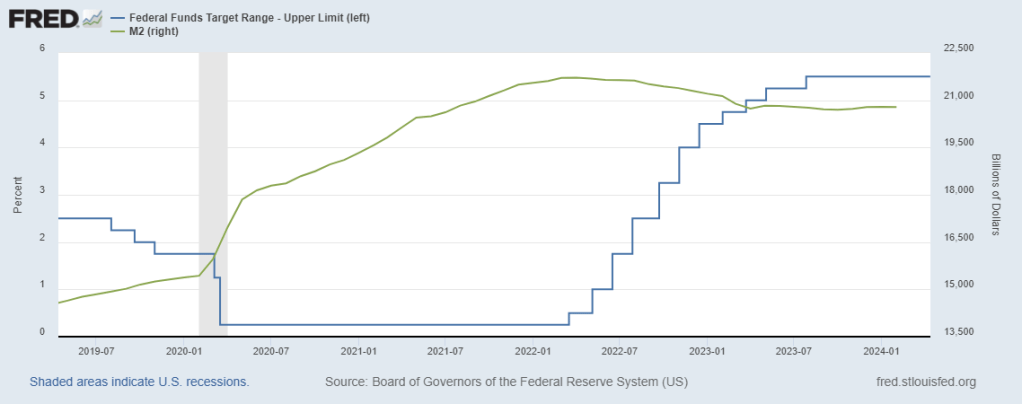
And we have The Federal Reserve posting record losses.

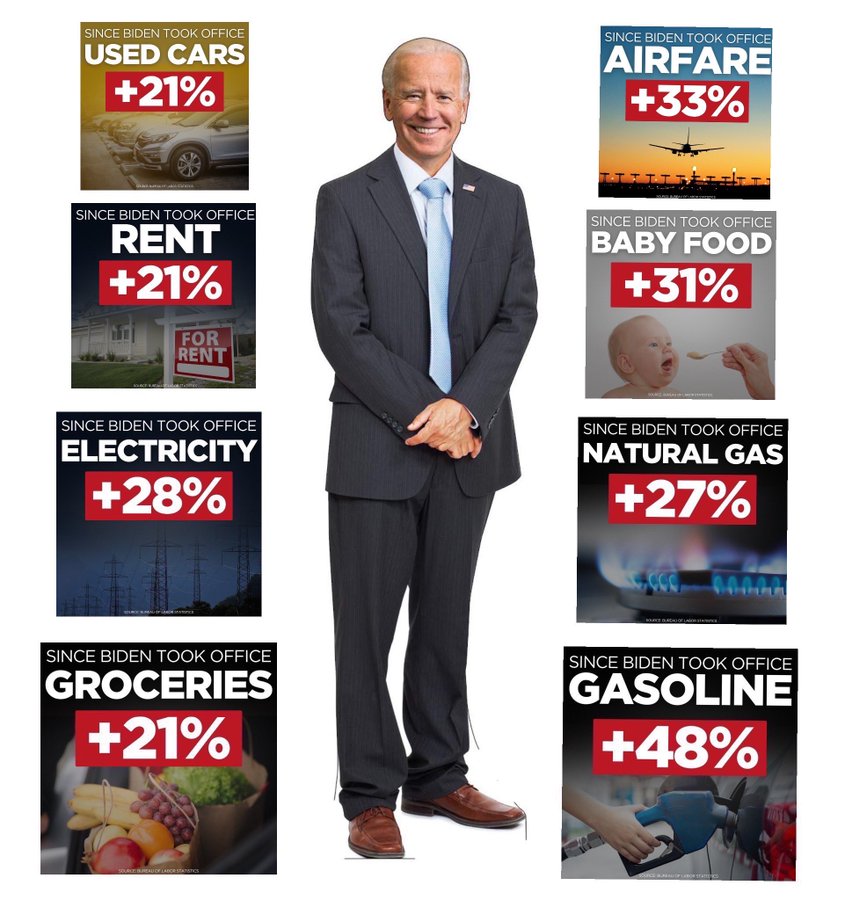
Did we REALLY elect this fool Biden as President??


You must be logged in to post a comment.