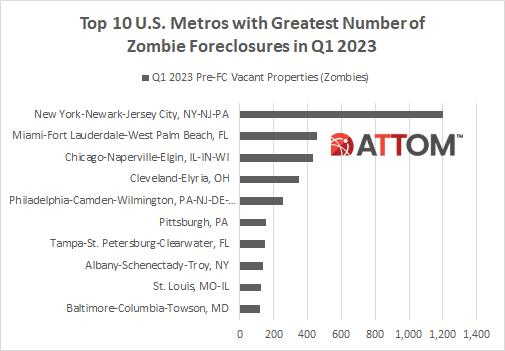
Yesterday’s inflation report (in the form on skyrocketing labor costs) helped lead Bankrate’s 30-year mortgage rate to over 7% … again.
Here is yesterday’s horrible unit labor costs YoY chart showing the fastest growth in labor costs since 1982 and Fed Chair Paul Volcker. Jerome Powell, the current Fed Chair is trying to reduce the Bernanke/Yellen/Powell monetary stimulypto (with an extra dose of “sugar” from the Covid outbreak).
The good news is that the 10-year Treasury yield is down -7.3 basis points this morning.
Despite Treasury Secretary Janet Yellen claiming that inflation was only transitory and likely to disappear, we are seeing continued inflation. Now we see that Unit Labor Costs are up 3.2% QoQ for Q4 2022.
Even worse, US unit labor costs rose 6.5% on a year-over-year (YoY) basis, the WORST since 1982.
And yes, Q4 2022 unit labor costs are up 2x the expectations.
In normal times, The Federal Reserve would raise rates to cool down the economy. The Taylor Rule suggests a Fed target rate of 10.59% versus the current Fed rate of 4.75%. A long way to go!!
Only Seattle and San Francisco experienced negative growth in home prices on a year-over-year basis. All of the top twenty metro areas experience negative month-over-month price declines from November to December.
Another sign of a not healthy economy is housing. New Home Sales collapsed -19.4% from January 2022 (aka, year-over-year or YoY).
If I were Joe Biden, I would be touting the month-over-month numbers, up 7.20% from December to January. But the reality is that year-over-year new home sales are down -19.4%.
Also, on the “Alarm!” front, US banks are expecting higher delinquencies, including on residential mortgages.
University of Michgan consumer sentiment for housing is rising, but still woefully below the 100 benchmark.
Not really a surprise, but January’s personal spending numbers came in hot at 1.8% MoM. Also, Personal Consumption Expenditures PRICE index (aka, inflation) rose to 5.4% YoY.
Here comes The Fed! The 2-year Treasury yield rose 10 basis points this morning.
The US Federal government reminds me of the Peggy Lee song “Is That All There Is?” Since the outbreak of Covid in 2020 and the absurb spending spree by Pelosi and Schumer, the Federal government has increased their debt by 36% to help pay for the Federal spending spree. That amounts to $54.8 TRILLION in additional Federal debt since January 2020.
What did the US economy get for all that Federal spending? In Q4 2022, Real GDP rose by … 0.91% YoY. Seriously? Is that all there is from $54.8 TRILLION in additional Federal debt?
Another bit of lousy news. Look at the trend in S&P 500 Earnings Surprise (5 year).
On the housing front, the US housing market was hit with the biggest six-month wipeout since 2008.
At least US Transportation Secretary “Pothole Pete” Buttigieg FINALLY showed up (three weeks after that East Palestine Ohio train disaster). Here is Buttigieg practising for his press conference.
Bull steepenings in the yield curve are generally seen as a precursor to a recession, but they are often preceded by bear steepenings. The 3m30y curve is currently bear steepening, indicating a recession could begin as early as the summer. In fact, the 3m30y curve is now inverted at -94.628 basis points pointing to a recession in summer 2023.
This is happening as the US house payment to income ratio near all-time highs.
The terminal Fed Funds target rates is now 5.363% for the July FOMC (Fed Open Market Committee) meeting in 2023.
This comes as US Q4 GDP was revised lower on weaker consumer spending, revised downward to 1.4%
With the revision of Personal Consumption, real GDP was revised downward to 2.7% annualized QoQ.
The Taylor Rule estimate for The Fed Funds Target rate is 10.15%. The Fed is only at 4.75%, so there is a long way to go! Except that The Fed doesn’t follow any useful rule like the Taylor Rule. Just the “seat of the pants” rule.
The value of the US housing market shrunk by the most since the 2008 as the pandemic boom (and M2 Money growth) fizzled out.
After peaking at $47.7 trillion in June, the total value of US homes declined by $2.3 trillion, or 4.9%, in the second half of 2022, according to real estate brokerage Redfin. That’s the largest drop in percentage terms since the 2008 housing crisis, when home values slumped by 5.8% from June to December.
Homebuyers, already facing record-high prices, took an additional hit from mortgage rates that more than doubled last year. With less competition in the market, the median US home sale price was $383,249 last month, down from a peak of $433,133 in May.
To be sure, home prices are not collapsing. In December, the total value of US houses was still 6.5% higher than it was a year earlier.
Florida Gains
How much homeowners lost depends on where they bought. The biggest declines were in pricey cities like San Francisco and New York, while buyers who moved to pandemic boomtowns are still seeing the returns on their investment, particularly in Florida.
That was especially true in Miami, where the total value of homes ballooned 20% year-over-year to $468.5 billion in December, the largest annual percentage increase among the top metro areas. While the overall US housing market is down, Miami’s market has about the same value as when it peaked at $472 billion in July. Meanwhile, homeowners in North Port-Sarasota, Florida, Knoxville, Tennessee, and Charleston, South Carolina, all saw annual gains above 17% in 2022.
On the corporate side, US bankruptcies in 2023 had the worst start to a year since 2010 and the financial crisis.
On the personal finance side of the ledger, the delinqueny rate on credit cards is growing at the faster rate since 2010.
Throw in 22 straight months of negative REAL wage growth, and have a scary situation facing middle America.
And the shate of outstanding subprime auto debt (30 days or more delinquent) is up to the highest rate since … well, you know when. The financial crisis of 2009-2010.
You must be logged in to post a comment.