US Jobs Surge! BIG Fed Policy Error Or Gov’t Election Manipiulation? (785,000 Gov’t Workers Added In September)

It turns out that Powell’s “emergency” 50bps rate cut was – drumroll – another major policy mistake by the Fed. Or it is Presidential election interference by The Biden/Harris Administration giving Cacklin’ Kamala as talking point?

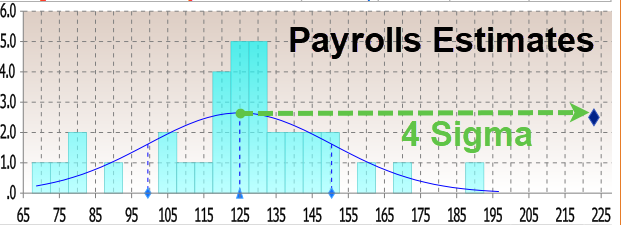
Moments ago, the BLS reported that at a time when prevailing consensus was for jobs to continue their recent downward slide sparked by the near-record annual jobs revision and several months of downbeat jobs reports, in September the US unexpectedly added a whopping 254K jobs, the biggest monthly increase since March…

… and above the highest estimate (which as noted last night was from Jefferies at 220K). In fact, the number was a 4-sigma beat to the median estimate!

There’s more: unlike previous months where we saw repeat downward job revisions, the BLS said that both prior months were revised up, to wit: the change in total nonfarm payroll employment for July was revised up by 55,000, from +89,000 to +144,000, and the change for August was revised up by 17,000, from +142,000 to +159,000. With these revisions, employment in July and August combined is 72,000 higher than previously reported.

Some context: as UBS notes, the moving six-month average on nonfarm payrolls is 167k. The estimate is that 150k is about consistent with a return of the economy to trend growth. Which means that inflation is about to come back with a vengeance, just as the Fed launches its easing cycle.

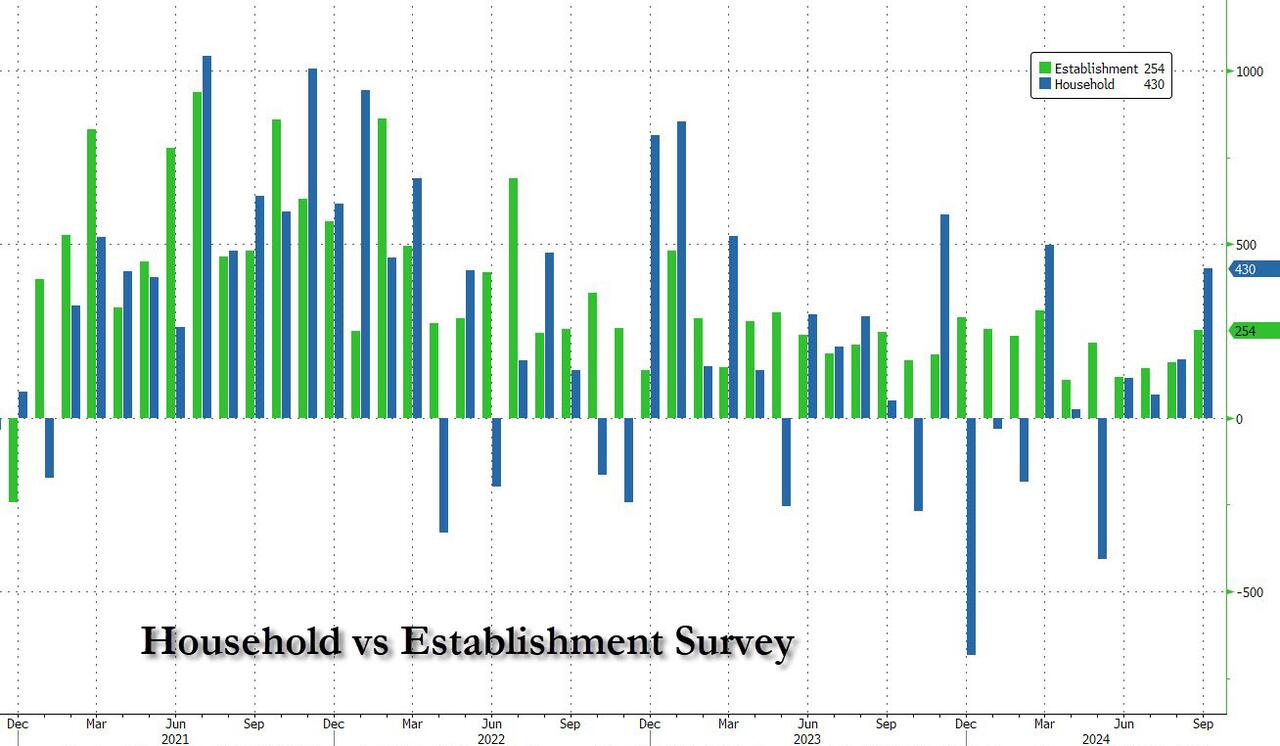
Remarkably, while payrolls jumped by the most in half a year, the number of employed people also surged, rising by a whopping 430K, also the biggest one-month jump since March.

It wasn’t just the payrolls, however, which came in far stronger than estimates: the unemployment rate also came in stronger than expected, and thanks to the jump in employed workers coupled with the decline in unemployed workers (from 7.115MM to 6.834MM), it dropped from 4.2% to 4.1% (and down from 4.3% two months ago which spared the entire recession panic).

Among the major worker groups, the unemployment rate for adult men (3.7 percent) decreased in September. The jobless rates for adult women (3.6 percent), teenagers (14.3 percent), Whites (3.6 percent), Blacks (5.7 percent), Asians (4.1 percent), and Hispanics (5.1 percent) showed little or no change over the month.

And here is the rub, because in a vacuum the super strong jobs numbers would have been fantastic, the only issue is that the September blowout comes as the Fed launches an easing cycle and as wages are once again rising as we have warned for the past 3 months. Indeed, in September, the average hourly earnings rose 0.4% sequentially, beating the estimate of 0.3%, while on an annual basis, wage growth was 4.0%, up from an upward revised 3.9% and beating the 3.8% estimate.

One note here: the average workweek for all employees edged down by 0.1 hour to 34.2 hours in September, which means the hourly earnings increase is not “pure” but rather a function of denominator adjustments. In manufacturing, the average workweek was unchanged at 40.0 hours, and overtime edged down by 0.1 hour to 2.9 hours. The average workweek for production and nonsupervisory employees on private nonfarm payrolls remained at 33.7 hours.

What sector had the biggest growth? UNPRODUCTIVE government workers! A record 785,000 government workers were added in September, pushing total govt workers also to a new record high.

The Biden/Harris Administration has given away billions of dollars to foreign nations (like Ukraine) and illegal immigrants so far this year,

– $24,400,000,000 to Ukraine.

– $11,300,000,000 to Israel.

– $1,950,000,000 to Ethiopia.

– $1,600,000,000 to Jordan.

– $1,400,000,000 to Egypt.

– $1,100,000,000 to Afghanistan.

– $1,100,000,000 to Somalia.

– $1,000,000,000 to Yemen.

– $987,000,000 to Congo.

– $896,000,000 to Syria.

– $9,000 per illegal immigrant that has entered the U.S.

And claim that FEMA has no money left for Hurricane Helene victims who have received only $750 per person. So I have plenty of reasons to have no trust or confidence in the Biden/Harris Mal-administration.

Slippin’ Into Darkness! Unrealized Losses On Banks’ Investment Securities Increase For 11th Straight Quarter (66 Banks On FDIC’s Problem Bank List)

The US is slippin’ into darkness under Biden/Harris.

Q2 marks the 11th STRAIGHT quarter of unrealized losses on investment securities for banks, a streak never seen before. The number of banks on the FDIC Problem Bank List increased to 66 and represents 1.5% of total.

This is in addition to price Increases over last 4 years…
CPI Medical Care: +7.8%
CPI Apparel: +12.7%
CPI Used Cars: +18.3%
CPI New Cars: +20.5%
CPI Food at home: +21.4%
CPI Shelter: +23.4%
CPI Food away from home: +25.4%
CPI Electricity: +29.8%
CPI Gas Utilities: +34.9%
CPI Transportation: +38.8%
US Home Prices: +48.0%
CPI Auto Insurance: +52.4%
CPI Gasoline: +53.5%
CPI Fuel Oil: +54.9%

Don’t spill the wine, its too expensive under Biden/Harris/Powell.

Economic Surprise Index Falls To -0.126 As Buying Conditions For Housing Remains Negative For Most Of Biden’s Presidency (US Debt Servicing Costs 12% Of Government Spending)

I saw former President Obama criticizing former President Trump for not passing “transformative” changes. That is, Trump didn’t sign any Obama-like transformative changes (like Obamacare). Truimp did try to slow down the damage done by Obama and his transformative agenda (e.g., open borders, wealth redistritution, green energy) that Biden has attempted to continue.

As we approach the party conventions and Presidential election of 2024, we saw the Economic Surprise Index (ESI) in May decline to -0.126.

Coupled with Biden’s negative buying conditions for housing (higher mortgage rates and soaring house prices), Obama’s Jacobian transformative economic fantasty is on thin ice.

Speaking of higher interest rates, US debt servicing costs currently make up 12% of government spending. Jacobin revolution = Cloward-Piven.

Let’s hope the Obama/Biden Jacobin revolution doesn’t get to this point!

Mortgages Wasting Away In Bidenville! Mortgage Demand (Applications) Down 14% Since Last Year

The economy under Biden has been a disaster for the mortgage industry. But for the top 1%, it’s been a party! (Bidenville Saturday Night!)

Mortgage applications increased 0.5 percent from one week earlier, according to data from the Mortgage Bankers Association’s (MBA) Weekly Mortgage Applications Survey for the week ending May 10, 2024.

The Market Composite Index, a measure of mortgage loan application volume, increased 0.5 percent on a seasonally adjusted basis from one week earlier. On an unadjusted basis, the Index increased 0.3 percent compared with the previous week.  The seasonally adjusted Purchase Index decreased 2 percent from one week earlier. The unadjusted Purchase Index decreased 2 percent compared with the previous week and was 14 percent lower than the same week one year ago.

The Refinance Index increased 5 percent from the previous week and was 7 percent higher than the same week one year ago.

“13 will get you 20” … unless you are a Biden,

Surprise! Citi Economic Surprise Index Crashes To -7.30 (Home Prices UP 32% Under Biden, Mortgage Rates UP 160%)

Surprise! Just in time for the November election, this is a negative surprise that Biden doesn’t want to hear.

The Citi Economic Surprise index crashed to -7.30, the lowest since January 2023.

Under Biden’s leadership (hell, he and his family already own several mansions … on a Senator’s pay), home prices are up 32% under Biden and mortgage rates are up a staggering 160%.

Getting young households who rent to buy a home in this environment will require magic.

My Kuroda! Japan Conducted Its Second Currency Intervention This Week (The Peril Of Bad Fiscal And Monetary Policies)

In the time (dis)honored tradition of Haruhiko Kuroda, the former governor of the Bank of Japan, Japan likely conducted its second currency intervention this week, current account figures from the central bank suggest, in another sign of the government’s intensified battle to prop up the yen.

Tokyo’s latest entry into the market was likely around ¥3.5 trillion ($22.5 billion), based on a comparison of Bank of Japan accounts and money broker forecasts.

The BOJ reported Thursday that its current account will probably fall ¥4.36 trillion due to fiscal factors on the next business day of Tuesday. That compares with the ¥833 billion average forecast by money brokers of what the number would be without intervention.

The figures, released less than a day after the yen jumped sharply during US trading hours, indicate that Japanese authorities made the unusual move of stepping into the market shortly after a Federal Reserve meeting when investors were still digesting the announcement. That would signal the finance ministry is taking an increasingly aggressive stance in what could become a prolonged fight to support the yen.

“With Japanese holidays and US jobs data coming up, it was a very good time for the authorities to tackle speculators,” said Yuya Kikkawa, an economist at Meiji Yasuda Research Institute. “This will have a great impact on the market. I sense a strong determination by the authorities to defend the 160-yen-per-dollar line.”

The latest swing in the yen follows a similarly sudden jump on Monday. Central bank accounts suggested Monday’s move was likely an intervention by Tokyo worth around ¥5.5 trillion, close to the daily record of ¥5.6 trillion set in October 2022.

Ahead of the move late Wednesday in New York and early Thursday in Tokyo, Central Tanshi Co. and Totan Research Co. had forecast a ¥700 billion decline in the BOJ’s current account balance due to fiscal factors including government bond issuance and tax payments. Ueda Yagi Tanshi projected the balance to drop by ¥1.1 trillion.

The calculations based on a comparison of those estimates and the central bank accounts offer only ballpark figures rather than specific amounts. Similar analysis proved accurate in showing that a jump in the yen in jittery markets in October 2023 was not the result of Japan stepping in to buy the currency.

The calculations also estimated the size of intervention on Oct. 21, 2022 at around ¥5.5 trillion, closely matching the actual amount.

An official monthly figure for the size of intervention will come out on May 31. Traders will need to wait until August or later to see daily operation data.

Japan’s top currency official Masato Kanda declined Thursday to comment on whether the finance ministry had intervened two hours earlier in Tokyo, when the yen strengthened sharply against the dollar. Japan’s currency briefly touched 153.04 from around the 157.50 mark.

Kanda oversaw the previous cycle of interventions in 2022. The ministry bought the yen around 30 minutes after the BOJ’s governor press conference ended in September that year. Another round of moves came a month later with back-to-back business day interventions.

The pattern of Japanese officials declining to comment is aimed at keeping market participants in the dark. A lack of immediate clarity may help keep traders more on edge and less willing to bet against the yen even if the ministry hasn’t actually taken action.

“By acting right after the Fed decision and outside of Japan hours, they dished out a warning that they are in a position to intervene 24 hours a day,” said Hirofumi Suzuki, chief FX strategist at Sumitomo Mitsui Banking Corp.

“We are still waiting for US employment figures during the Golden Week holidays and depending on the outcome of that data, there is a risk of further intervention,” he said.

The US is having its own currency problems under Biden with its own bad fiscal and monetary polcies. The Purchasing Power of the US Dollars has fallen 17% under Biden.

Fed Will Likely Pause For 6th Straight Meeting (Mortgage Rates Are Already Up 161% Under Biden, MBS Returns Terrible!)

The Fed will likely pause rate cuts/increases when The Fed reveals their plans today.

Breaking: Federal Reserve officials are likely to hold interest rates steady at 5.25-5.5%—a 20-year peak—for a 6th consecutive meeting.

With inflation still high, rate cuts seem off the table for now.

Rate decision at 2pm Washington time.

The Street seems aligned.

Conforming rates are already up 161% under Biden.

According to Fed Funds Futures, no rate changes until after the Presidential election.

MBS returns have been abysmal under Biden/Powell.

Traders Now Pricing In One Rate Cut This Year, But Not Until The End Of 2024, After The Election (Home Prices UP 32.5% Under Biden, Mortgage Rates UP 160%)

The Federal Reserve is playing the song “Don’t rock the boat” ahead of the Presidential election. Despite the horrible economic news.

1) 4 months of hotter inflation (like today’s stagflationary GDP report)

2) Nearly 1.5 million full-time jobs decline with 1.9 part-time jobs created over a year

3) $2 trillion annual deficits

Leading traders to price in 1 rate cut in December 2024. AFTER THE PRESIDENTIAL ELECTION!

Under Biden, home prices are up 32.5% and conforming 30Y mortgage rates are UP 160%.

One of my colleagues at George Mason University in finance (an economics PhD) constantly quoted Lenin’s famous “You have to break a few eggs to make an omelet.” But why is it always OUR eggs that have to be cracked, never the wealthy elite.

Stagflation Alert? Bidenomics Is REALLY COVID-Related Spending (Q1 Real GDP Was 2.97% YoY, 1.6% QoQ While The Federal Government Spending Was 4.21% YoY, Core PCE Price Index Rose 3.7%!)

COVID was a gift to Biden. The furious Federal spending of Q2 2020 through Q1 2021 helped keep GDP growth above recession levels.

Ignore Biden’s demented rants/lies about cutting the debt in half. Biden has claimed he cut the $34+ trillion national debt by $7 billion, $1.4 trillion, $1.7 billion, $1.7 trillion, and “in half,” depending on the day he rants. He did no such thing. He is confused and is talking about the BUDGET DEFICIT (don’t look to Snopes to fact check “Trucker Joe”, they really only fact check Trump).

Not surprisingly, the Federal deficit spiked with the Covid lockdowns. But when the economy reopened, the budget deficit shrunk because … the economy was open and Federal tax receipts soared. But we are back to rising deficits again.

Today, Q1 GDP numbers were released and it looks great. Real GDP year-over-year was 2.97% while Federal government expenditures YoY were 4.21%. But the US is still processing the tidal wave of COVID-related spending out of Washington DC (red line). The YoY growth in Federal spending was 86.4% in Q2 2020, 48.9% in Q3 2020, 22.4% in Q4 2020, and 67.8% in Q1 2021. Like The Titanic trying to avoid the iceberg, it takes a while for massive Federal spending to work itself through the economic system.

On a QoQ basis, US GDP increased by only 1.60%. Here are the contributions to GDP.

GDP QoQ was up 1.6% while Core PCE Price Index rose 3.7%. Yikes!

Are we entering Stagflation with the worst GDP print in 2 years as prices soar. As COVID stimulus seems to be wearing out.

The election campaign for Biden should be Lloyd Price’s “Stagger Lee.” Redone as “Stagflation Joe.”

China US Treasury Holdings Down To 2009 Levels As US Treasury Yields Climb (Why Mortgage Rates Will Continue To Rise)

President Obama selected Slow Joe Biden as his Vice President because 1) he was white and 2) an alleged foreign policy wizard in The Senate. Between Afghanistan, Ukraine, Israel, Taiwan and every other foreign policy disaster under his leadership, I am beginning to doubt Biden’s foreign policy acumen. For example …

For the 9th month of the last 11China’s Treasury holdings declined in February (the latest TIC data), dropping by $22.7BN. Additionally, it has now been 24 of the last 28 months that China’s Treasury holdings have declined, now back at practically its lowest level since June 2009…

Source: Bloomberg

While we are acutely aware of the fact that ‘correlation is not causation’, one would find it hard to argue that the practically perfect concomitance of China’s Treasury holdings and the yield of the US 10Y Treasury note over the past three years makes us wonder (in our out-loud voices), if – away from The QT, The FedSpeak, the macro-economy, the geopolitical crises, the AI-hype, the growth scares – if it’s not just all a well-managed (slow and steady) liquidation of China’s (still massive) US Treasury holdings…

Source: Bloomberg

It’s hard to argue they don’t have an incentive to a) de-dollarize, and b) not liquidate it all at once, shooting themselves in the face.

While the de-dollarizing has been steady in Treasury-land (enabled by a vast sea of liquid other players), things have been a little more ‘obvious’ in the alternative currency space – i.e gold.

The 2015 jump in the chart below was when China suddenly admitted to its gold holdings (well some of them we assume) after no disclosure since 2009. Since then both China and Russia (the gold line below), have been hoarding the precious metal while dumping Treasuries…

Source: Bloomberg

And in case you wondered, it’s not just China and Russia, world reserve Treasury holdings are ‘relatively’ flat (based on Fed’s custody data) while according to The IMF, the world’s sovereign nations have been buying gold with both hands and feet…

Source: Bloomberg

…happy to take whatever retail-ETF-sellers are offering into their physical vaults

Source: Bloomberg

Finally, as we note in the chart, this all started to ‘escalate quickly’ when Washington really started to weaponize the dollar.

Assuming that all the US gold is still in Fort Knox (and assuming that China and Russia are honest about their holdings), the world’s ‘other superpowers’ are rapidly catching up to the US’ holdings…

Source: Bloomberg

Who could have seen that coming? With mortgage rates hitting 7.5%, the home price to median household income ratio just hit an all-time high.

The 10Y Treasury yield just hit 4.519%.

And we have The Federal Reserve posting record losses.

Did we REALLY elect this fool Biden as President??