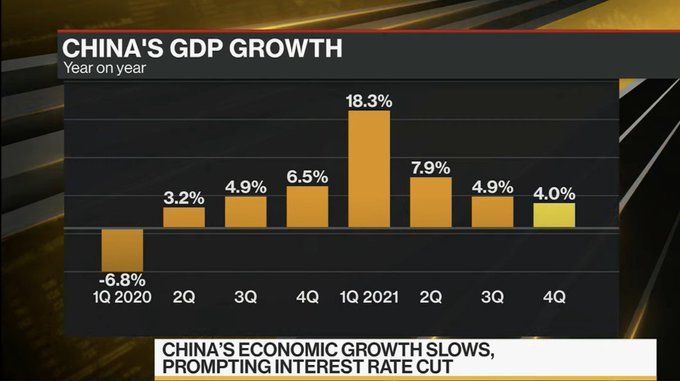
The Chinese Real Estate Developer Debacles continues to spread from Evergrande to other developers as China’s Central Bank cuts rates due to Omicron spread.
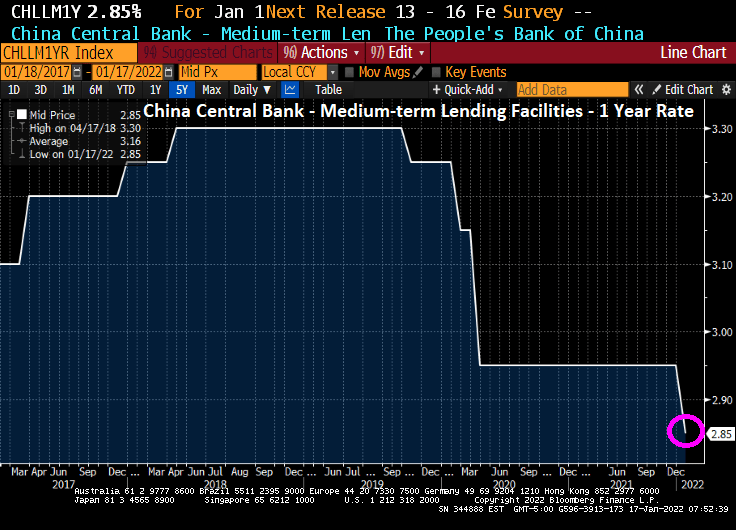
First, China’s Central Bank cut their 1 year medium-term lending rate to 2.85% from 2.95%. And the growing malaise in China’s real estate development continues.
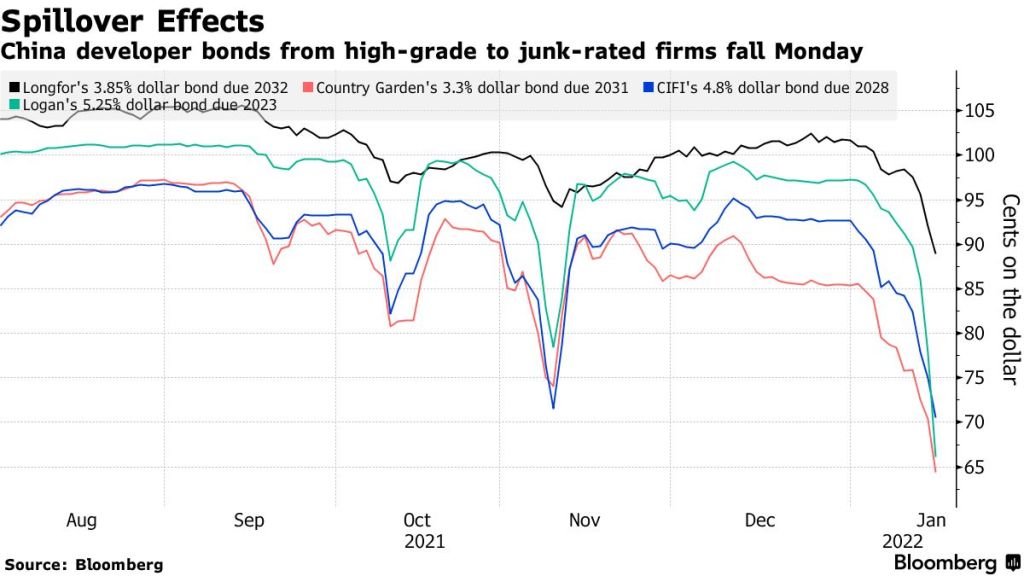
Fresh turmoil rocked Chinese property bonds on Monday on concern over the true scale of the industry’s hidden debts, deepening a selloff among higher-rated firms.
A Logan Group Co. note due 2023 sank 14.1 cents to a record low 62.9 cents after Debtwire reported the developer could be on the hook for $812 million of guarantees on outstanding obligations due through 2023. Country Garden Holdings Co.’s bond due 2024 tumbled 12.9 cents to 67.7 cents, extending last week’s selloff for the country’s biggest developer.
Let’s see if the US Federal Reserve follows through with it rates increases when China is cutting their rates.
2022 should be an interesting year as the wheels come off The Fed’s constant stimulation of markets.
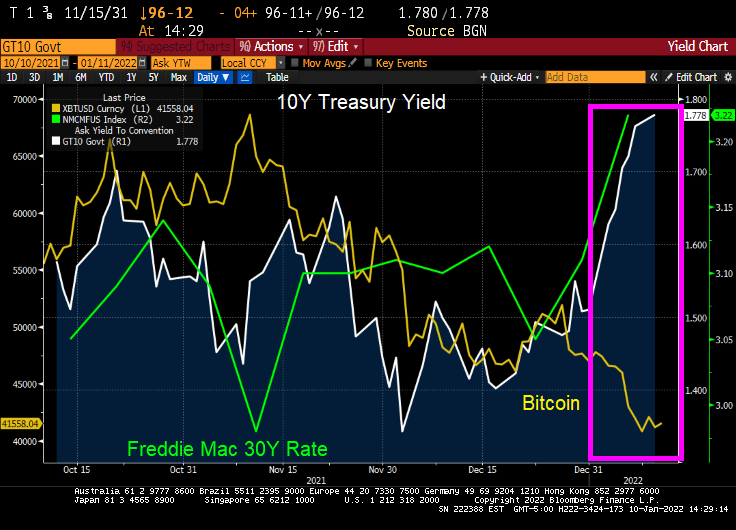
Today, we saw the 10-year Treasury Note yield almost hit 1.8% as mortgage rates rose to 3.22%.
Unfortunately for crypto investors, bitcoin is having a bad 2022. And ethereum is feeling some pain as well.
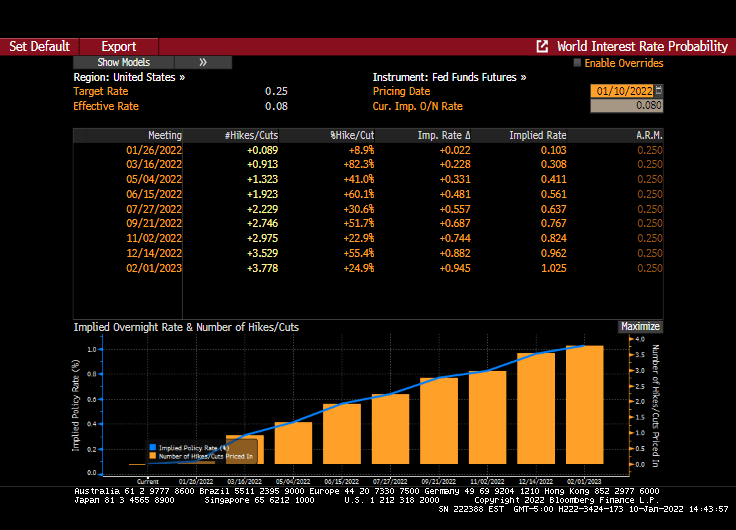
While Goldman Snakes predicted 4 rates increases in 2022, Fed Funds Futures are predicting almost 4 rates increases (3 in 2022 and 1 in Jan 2023 … almost).
So whatever is giving markets the jitters, I would follow the advice of Samuel L. Jackson from Jurassic Park: “Hold on to your butts.”
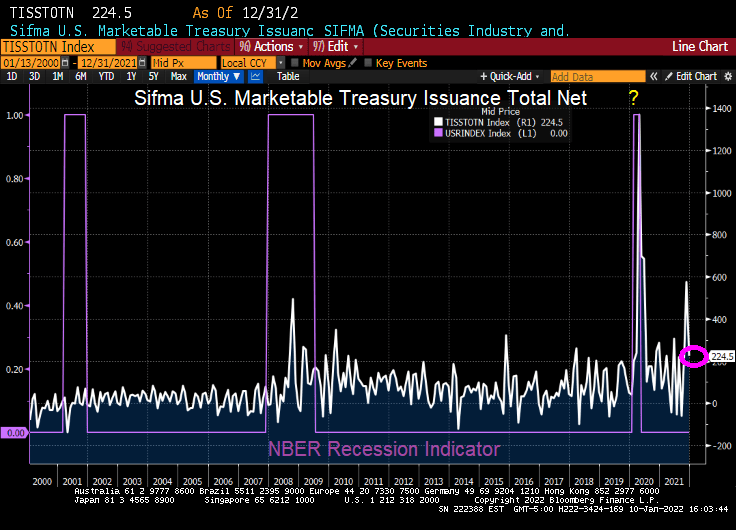
UPDATE: Did The Fed/Treasury seriously overreact due to COVID? Lool at Treasury issuance related to COVID recession versus the financial crisis (Great Recession) and the 2001 recession.
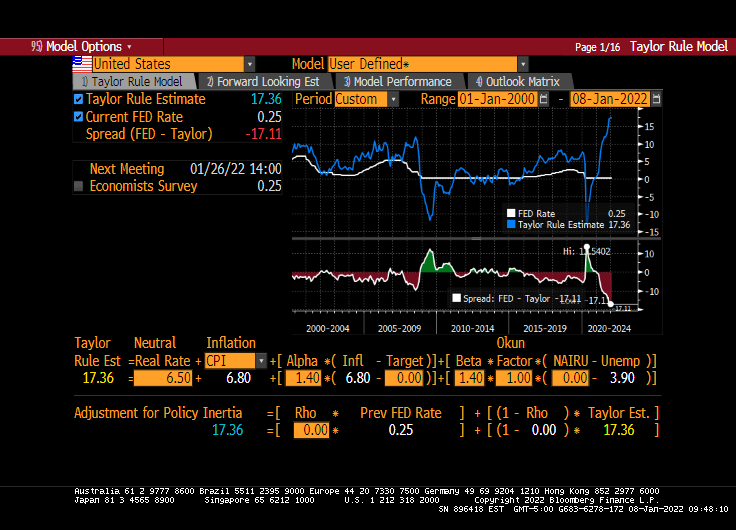
It is somewhat mystifying that markets would be soooooo sensitive to 3 rate increases from The Fed, particularly since the Taylor Rule suggests that The Fed’s target rate should be 17.36%. Even if you don’t like the Taylor Rule or disagree with its inputs, you must admit that the gap between where The Fed is (0.25%) and where they should be (17.36%) is … k-razy.
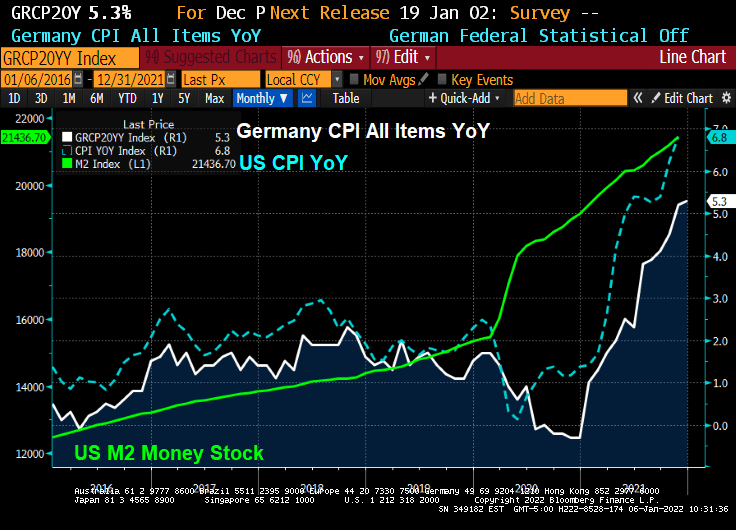
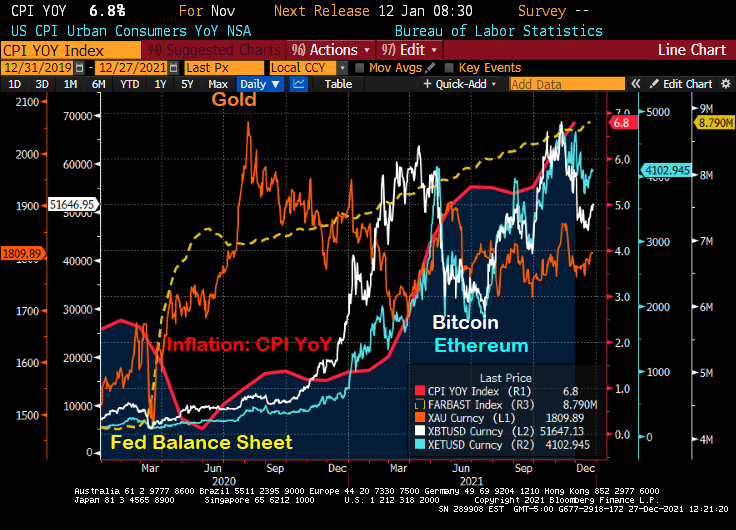
The world has become a wild and wacky place since COVID was unleashed on an unsuspecting population. Since the massive spending spree by The Federal government in the USA coupled with extraordinary monetary stimulus from The Federal Reserve, US inflation has shot up to 6.8% YoY.
German is also having an inflation moment. With their CPI YoY running at 5.3%, faster than the anticipated 5.1%.
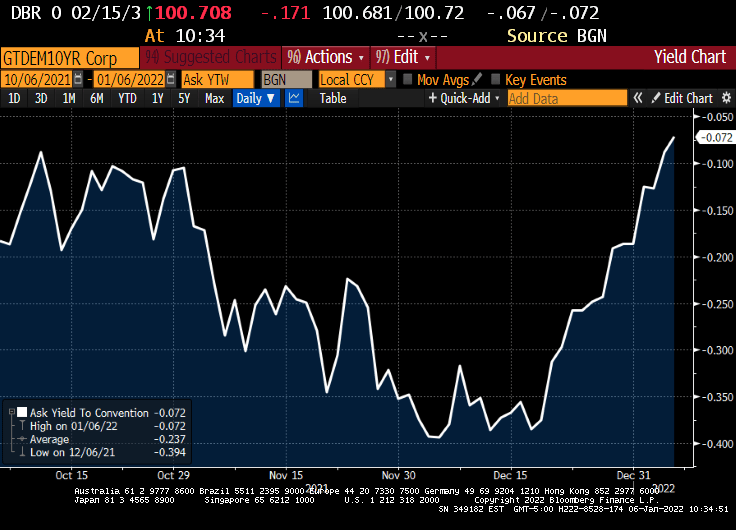
At least the German 10-year sovereign yield is ALMOST back to 0%.
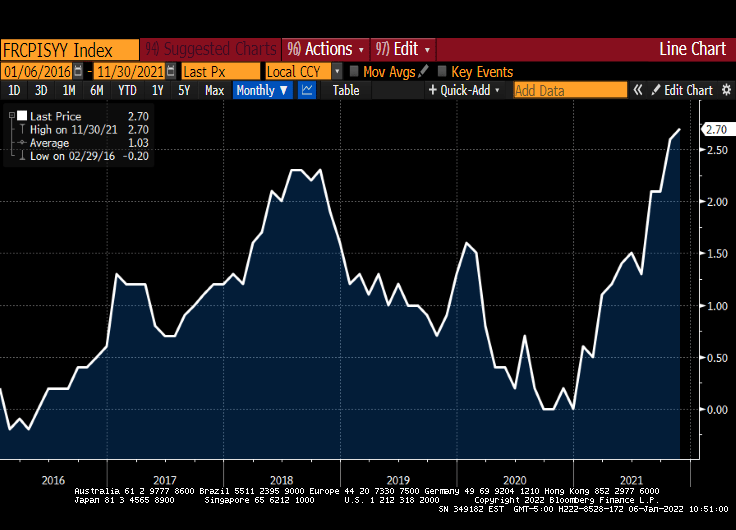
France, on the other hand, is seeing inflation rising to 2.70% YoY.
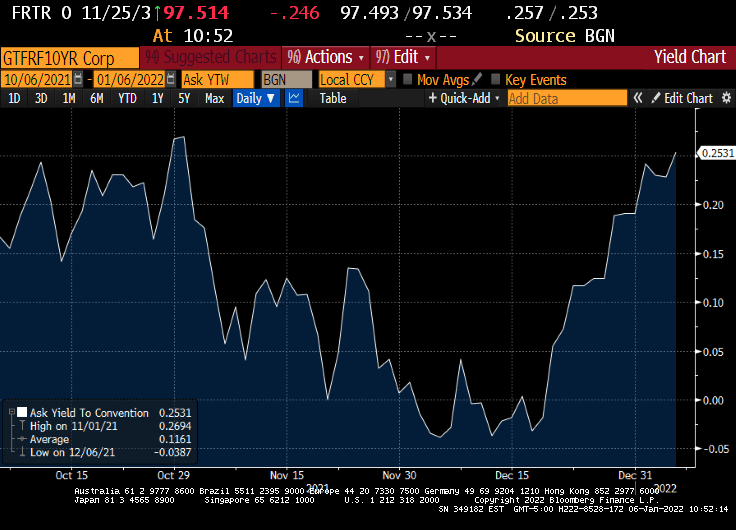
While the French 10Y sovereign yield rose to 0.2531%.
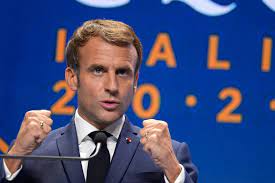
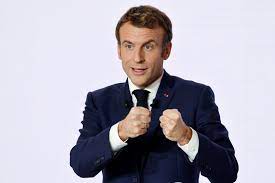
France’s Macron certainly likes to have his photo taken as if he wants to go 10 rounds with UK’s Tyson Fury.
When we look at the Buffett Indicator, we can see how The Federal Reserve’s loose monetary policies (or follycies) are driving up stocks to unsustainable levels that may not survive without The Fed’s “Do Ho Big Bubble Policies.”
How about the Shiller CAPE (Cyclically-adjusted Price/Earnings) ratio? While not up to dot.com levels yet, the Shiller CAPE ratio is climbing with the assistance of The Fed and their insane money printing.
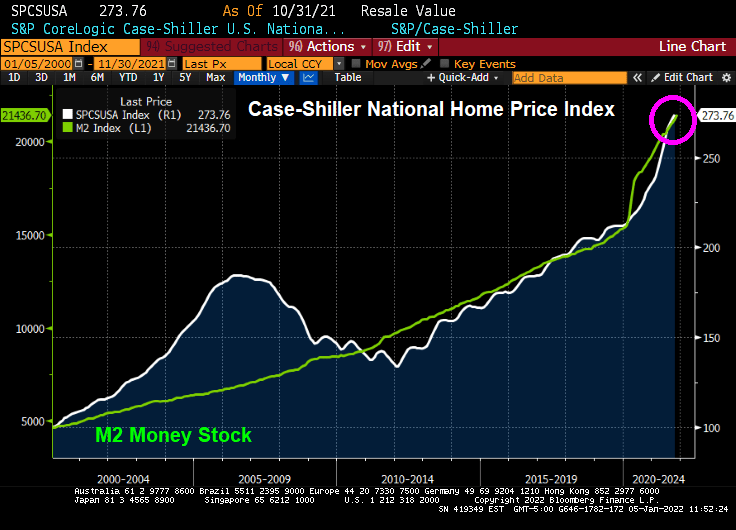
How about house prices? The Case-Shiller National home price index is far above the level last scene during the housing bubble of 2005-2007. Again, with a little help from The Federal Reserve.
I can’t wait to see how the equity market and housing market reacts IF The Fed actually follows through with reducing monetary stimulus. Probably not just adding more stimulus, just reinvesting the Treasury and MBS proceeds (aka, not shrinking the balance sheet).
Treasury yields rose a second day, with five-year rates hitting the highest since before the pandemic took hold in the U.S., amid increasing conviction that the Federal Reserve will raise rates at least three times beginning in May.
The five-year Treasury note’s yield climbed as much as 3.8 basis points to 1.392%, the highest since Feb. 20, 2020, while 30-year yields bumped up toward their 200-day moving average.
Yields across the curve are rising for a second straight day, after Monday’s selloff lifted the 10-year note’s yield by nearly 12 basis points in its worst start to a year since 2009. The two-year yield topped 0.80% for the first time since March 2020.
At the 10-year mark, we see Canada’s sovereign notes rising 18.7 basis points.
Also at the 10 year mark, we see the US 1-year breakeven inflation rate (red line) surging.
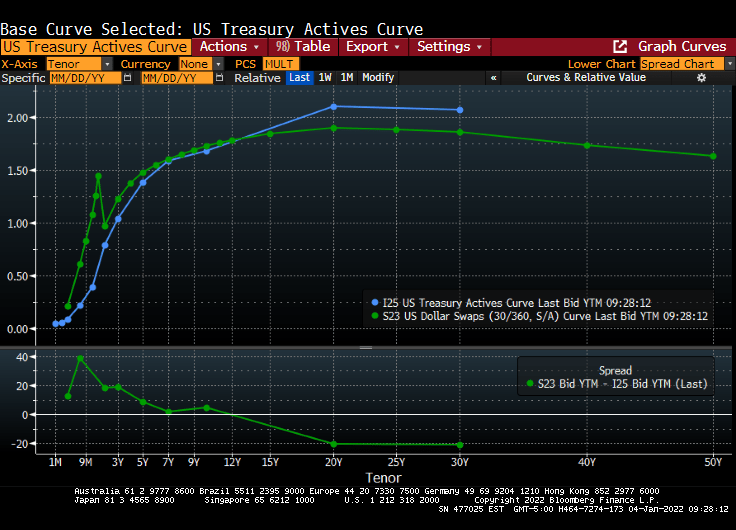
The US Treasury actives curve and Dollar Swaps curve remain steeply upward sloping.
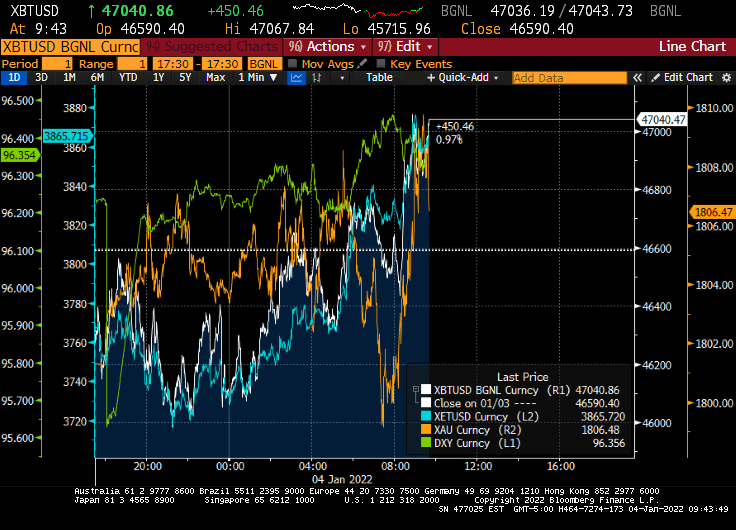
And on the crypto and gold front, gold surged this morning after tanking in the evening, while Ethereum (blue) is doing quite well along with Bitcoin.
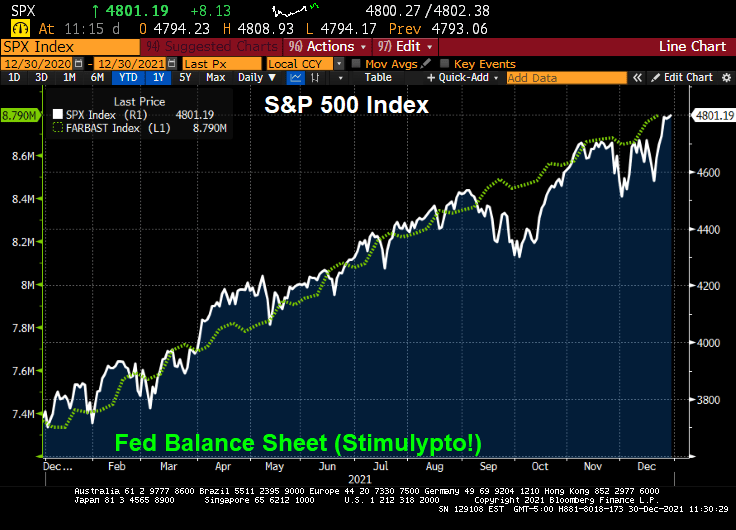
My favorite non-bond, non-alt investment chart. The S&P 500 index charted against The Fed’s M2 Money Stock.
Following my friend Jesse’s habit of posting great French food dishes, here is one from my favorite Parisian eatery, Le Duc de Richelieu. Mmmmmmm.
2021 saw the S&P 500 index generate a return of 28.7%. Much of it thanks to The Federal Reserve “stimulypto” or excessive monetary easing.
But only three hedge funds beat the S&P 500 index: Senvest, Impala and SR. Thanks to fees (trading and management), the other hedge funds underperformed the S&P 500 index. And underperformed The Fed!
Melvin Capital was the worst performing hedge fund of the ones examined.
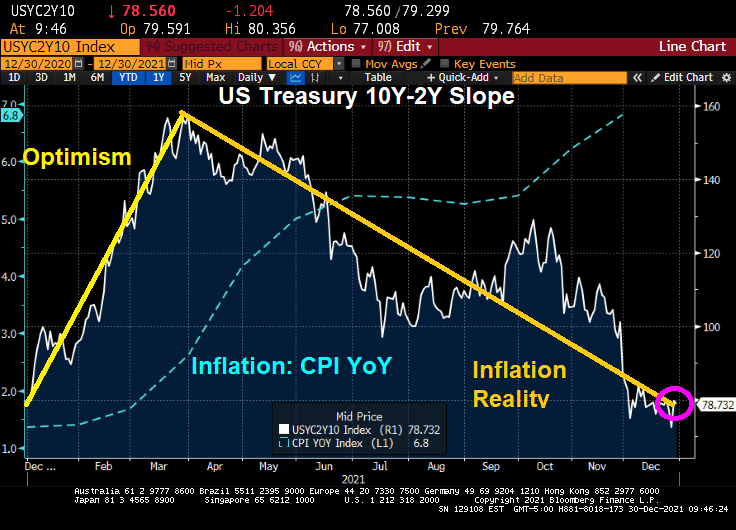
It has been almost a year since Joe Biden has been President of the United States and a Democrat majority took control of The House and Senate. And what has happened to the US Treasury yield curve slope over the past year?
The yield curve is back where it started. There was the “honeymoon effect” where the curve slope rose. After all, Biden was Obama’s Vice President for 8 years and The Democrats has promised so much in the 2020 election. But by early April, the reality of the massive Federal spending (combined with Fed Stimulypto) began showing what was feared: inflation (blue line) started to grow at a rapid rate of speed. With inflation now at 6.8% YoY,
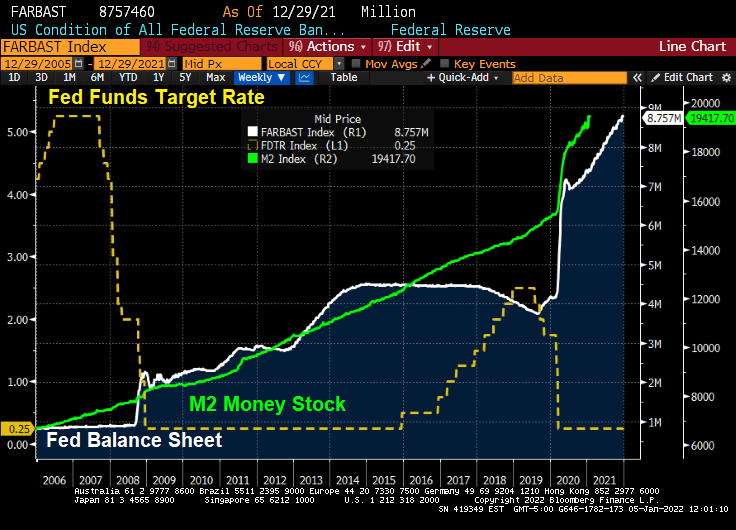
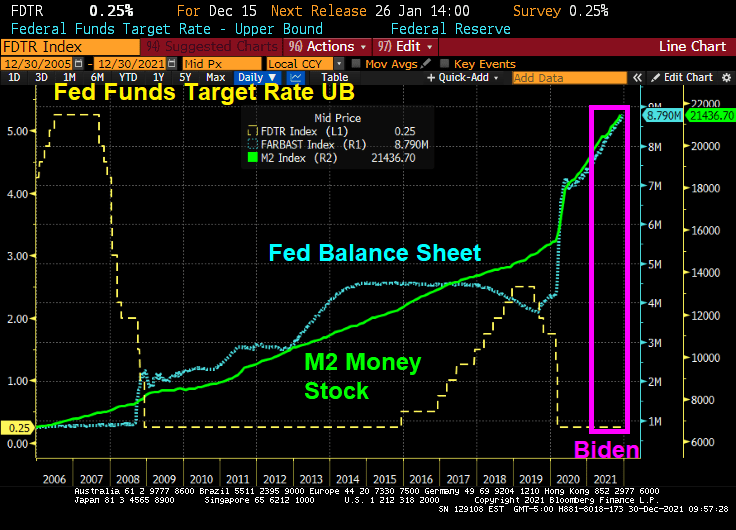
In fairness to Biden, The Federal Reserve has been overstimulating the economy since The Federal Reserve since Ben Bernanke and the Fed Open Market Committee (FOMC) dropped the hammer on The Fed Funds Target Rate once the rate hit 5.25% in September 2007. They kept cutting it reached 25 basis points (or 0.25%) in December 2008. In August 2008, Bernanke and Company began their “Quantitative Easing” or asset purchasing programs. Between The Fed’s Target Rate and QE, The Fed has continued to overstimulate markets ever since. Under Biden, The Fed Funds Target Rate remains at 0.25% and The Fed’s Balance sheet has grown to $8.79 Trillion (bigger than the entire economies of Japan and Germany put together!).
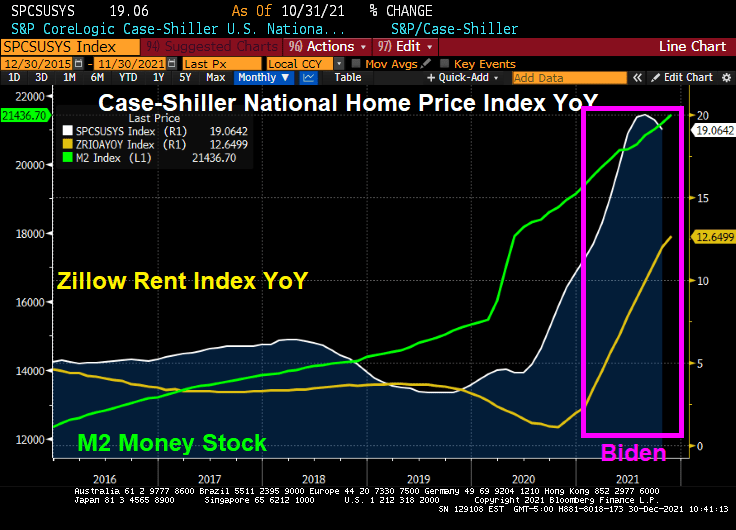
How about housing? Home prices are growing at 19% YoY while rents are growing at 12.65% YoY.
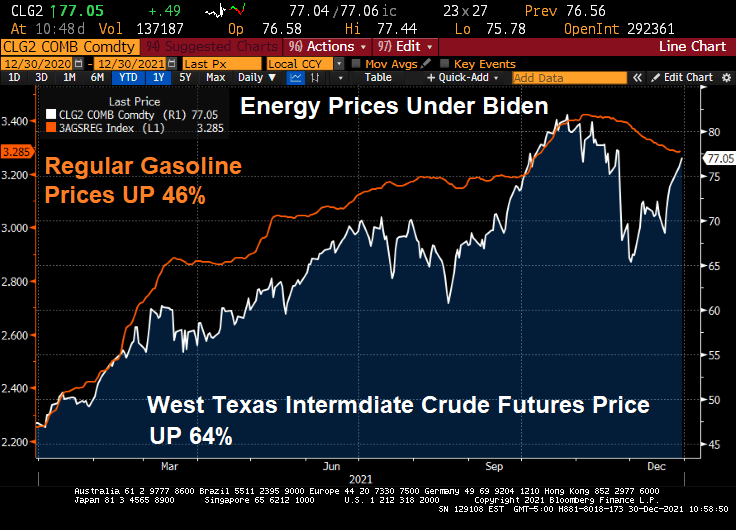
Energy prices have risen dramatically under Biden. Gasoline is up 46% despite a slight reprieve recently. WTI crude prices are up 64%.
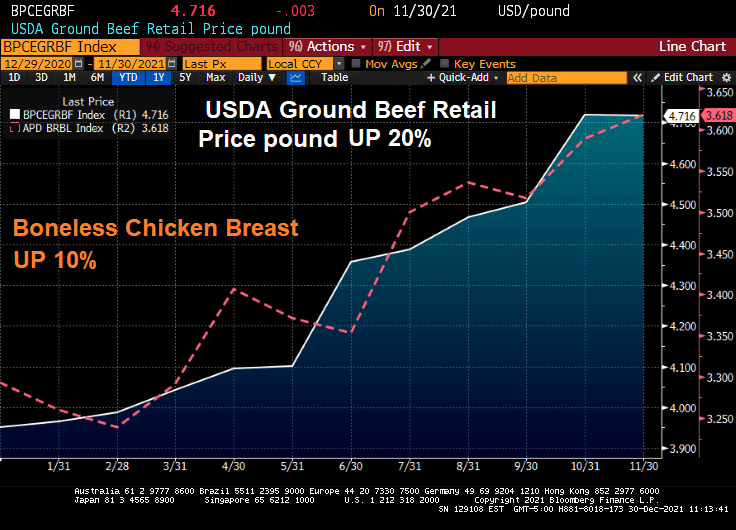
How about food? Beef prices are up 20% and chicken prices are up 10%.
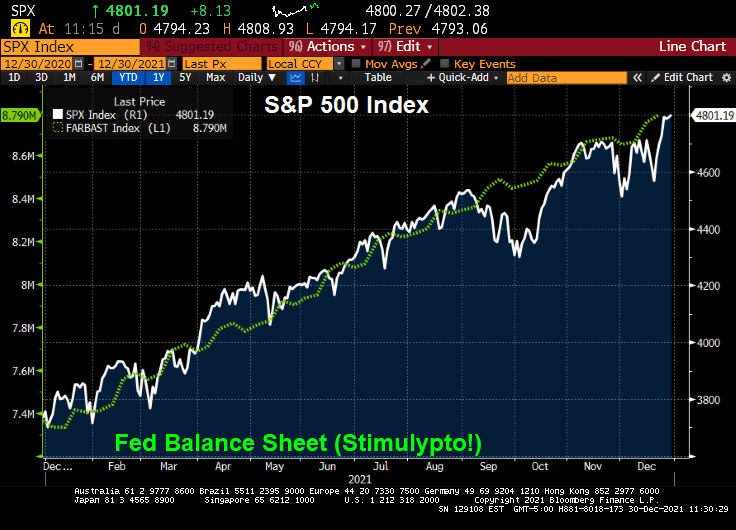
On a positive note, the S&P 500 index has soared … thanks has soared during Biden’s term thanks to Fed stimulus and Federal spending on COVID.
The Build Back Better Act if passed (in its entirety or on a piecemeal basis) will lead to even MORE inflation.
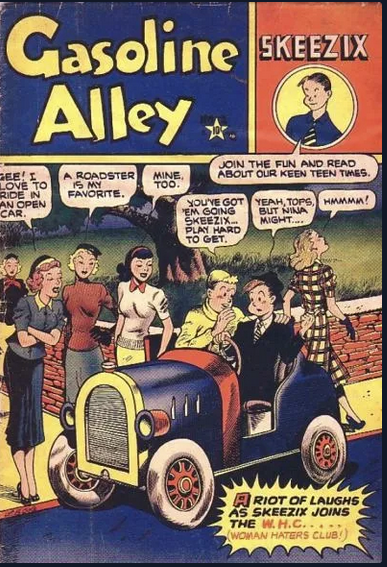
Perhaps Biden’s spokesperson Jen Psaki can recreate the Biden Administration as a lovable, hilarious family like the comic strip Gasoline Alley with old Joe Biden as Skeezix. And insider-trading star, House Speaker Nancy Pelosi as the family matriarch.
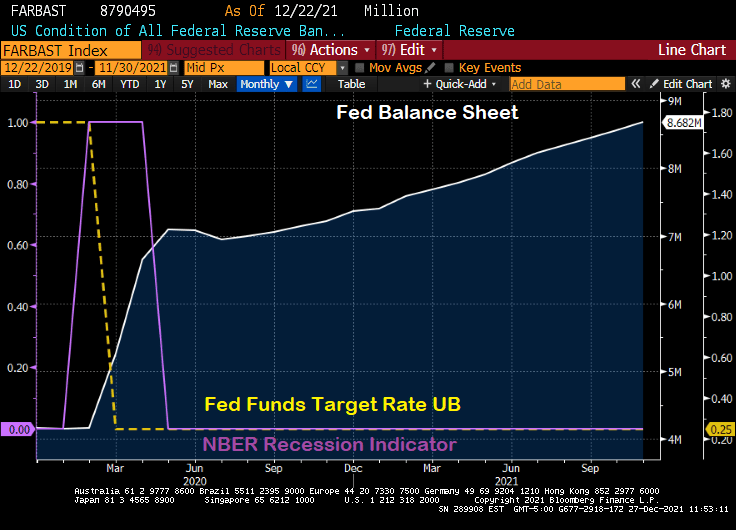
The global economy has certainly been turned on its head by the COVID outbreak in early 2020. Not so much by the virus itself, but by Central Bank hysteria in terms of rate lowering and balance sheet expansion. Which The Fed has not yet unwound.
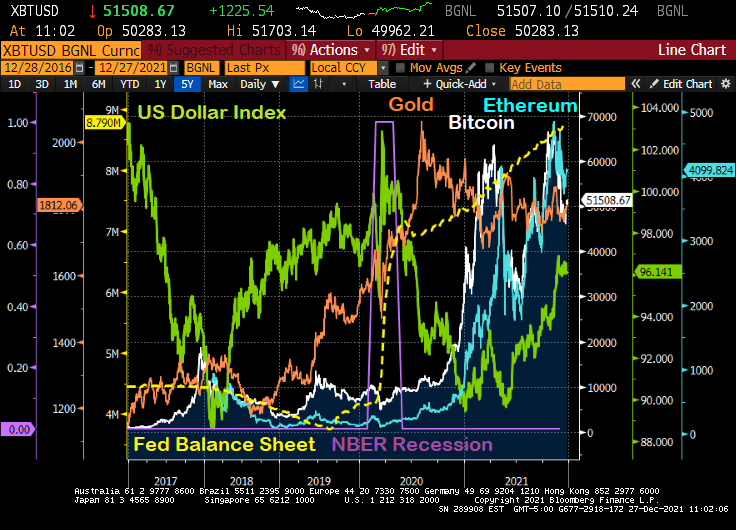
Let’s look at what has happened since the mini-recession caused by COVID in early 2020. The shortest recession in US history, a measly 2 months. The Fed expanded its balance sheet from $4.17 million in February 2020 to $8.79 million today. That is, The Fed over doubled the size of their balance sheet in reaction to the shortest recession in US history. Overreaction much?
What has happened since the mini-recession and The Fed’s massive overreaction?
First, gold (gold line) surged then calmed down. Then cryptocurrency Bitcoin (while line) surged, then calmed down, then surged again only to calm down again. Then crypto Ethereum surged, calmed, surged, calmed. Meanwhile the US Dollar Index crashed only to start rising again.
The Fed’s overreaction and failure to withdraw excessive stimulus has led to the rise of alternatives to the deflating dollar due to inflation.
When will The Fed ACTUALLY start removing the overreaction stimulus? Let’s get it started.
Perhaps only April Ludgate can kill The Fed’s overreaction stimulus.
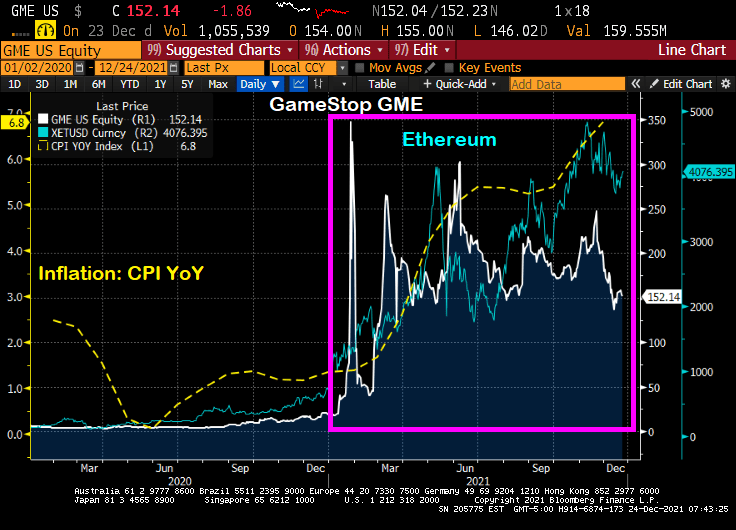
2021 has been a very weird year. Inflation has boomed (highest in 40 years) after the election of Joe Biden as President of the USA (call it Bidenflation). Then we have The Federal Reserve barely acting on the booming inflation (keeping rates at 25 basis points while withdrawing the COVID-related monetary stimulus).
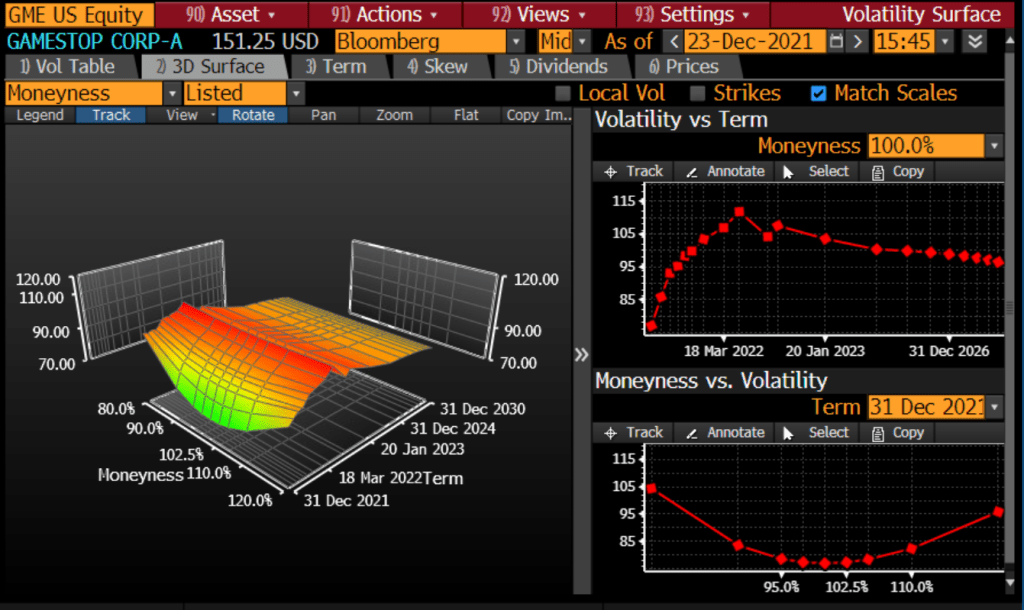
Given the volatility of GameStop (Reddit-inspired), you can see the strange shape of GameStop’s volatility surface.
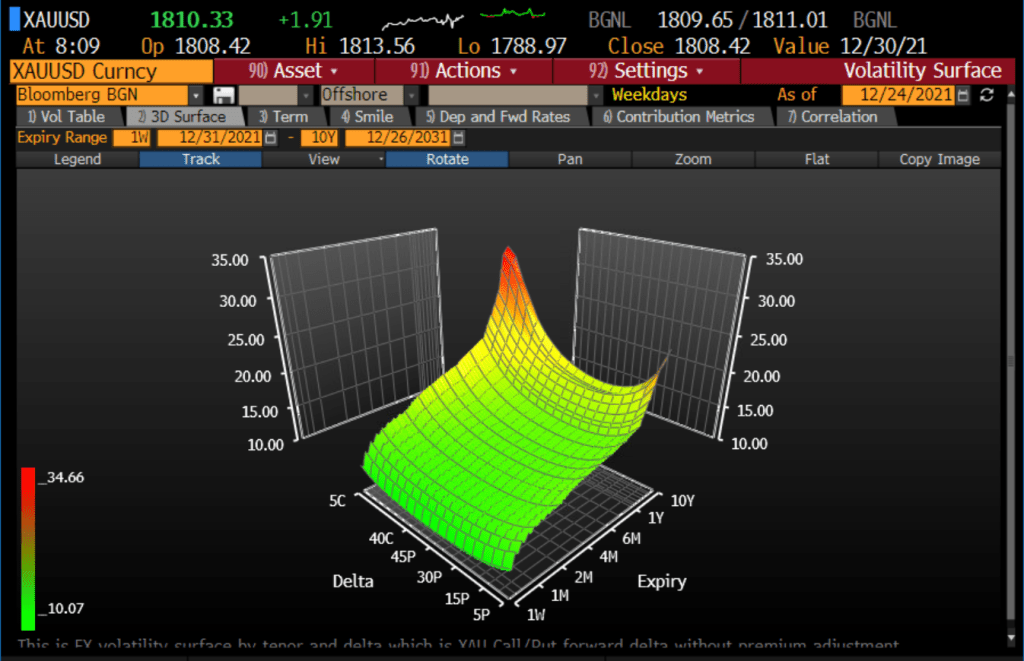
By contrast, gold is now where it was was at the beginning of 2021 and the surge of Bidenflation.
Here is volatility surface for gold.
So, there are a number of meme stocks (GameStop is just one example), gold, silver, cryptos such as Bitcoin and Ethereum. But gold seems to be placid with respect to inflation, but the meme stocks and cryptos seem to be motoring. Or is it rage against the financial machine? Or rage against Bidenflation??
The US stock and bond markets are closed today and tomorrow, Christmas day.
Have a Merry Christmas! And celebrate the “Santa Pause” as Powell refuses to raise rates to combat inflation until 2022.

















You must be logged in to post a comment.