Its the Biden Bop! As Bidenomics continues its blitzkrieg on the US economy with the Federal government massively expanding its debt while households and business cut back on debt.
The US government is the only sector to have notably borrowed on a net basis over the last five years.The market sees that as inflationary, driving yields higher.
The pandemic saw an increase in the borrowing of all sectors. But it was the government that saw the biggest rise in GDP terms, and it is the government whose debt is still considerably higher than it was before the pandemic – the debt-to-GDP ratio is up 16 percentage points over the last five years.
In contrast, the household sector’s leverage is now lower than it was pre-pandemic, while the corporate sector’s is only marginally higher. The US government has become the borrower of first as well as last resort.
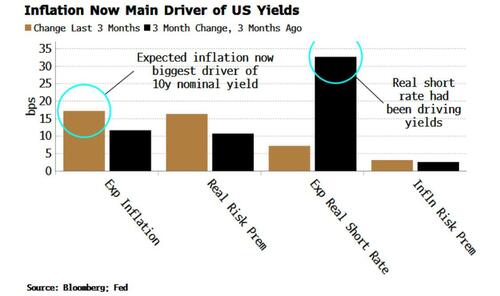
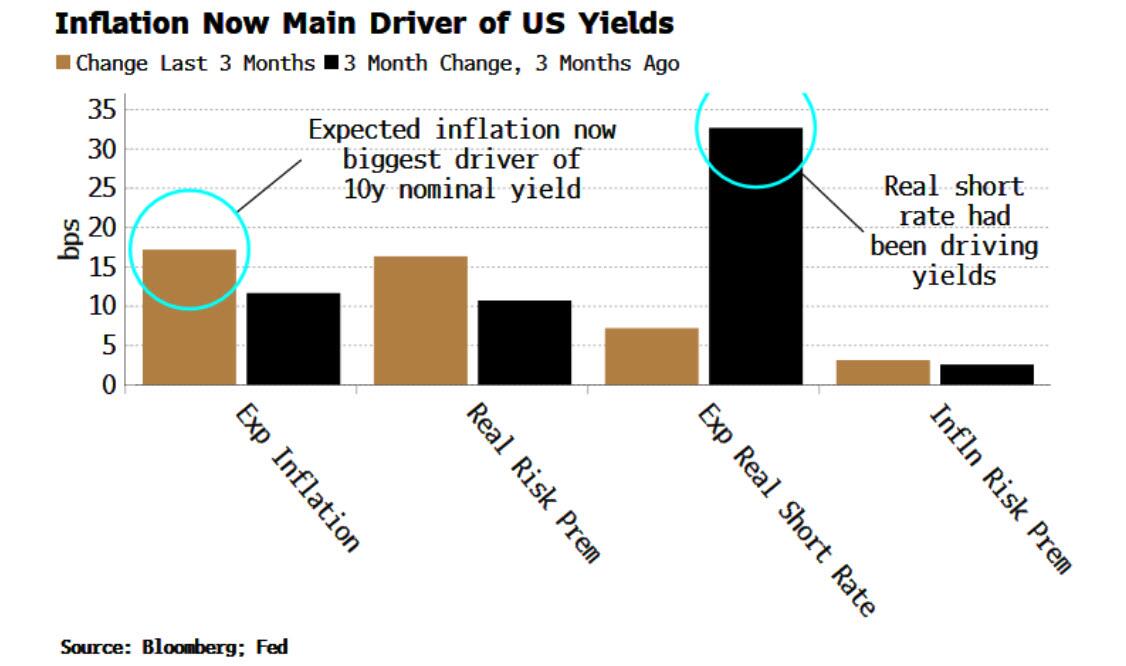
The market is picking up on this and is pricing accordingly. We can decompose nominal yields into a sum of expected short rate + real term premium + expected inflation + inflation term premium (see here for more).
Over the last three months, the main driver of rising yields in the US has been expected inflation, followed by the real risk premium. This marks a change from earlier in the year where the principal driver was the expected short rate, i.e. expectations of increases in the Federal Reserve’s policy rate.
Regressing the fiscal balance with the yield components shows that only inflation and the inflation risk premium have a negative sign, i.e. when the fiscal balance falls (greater deficit), expected inflation and the risks surrounding it increase.
Not only does increased government borrowing push up borrowing costs through greater inflation risks. When the sovereign is the only borrower, it crowds out the rest of the economy. With governments’ reputation for inefficiency, this depresses real growth.
The lost decades in Japan were primarily a result of the government stepping in to borrow as the private sector nursed its wounds from the late 1980s financial crash. But that perpetuated and entrenched the situation. With the Treasury now the sole borrower of any significance, the US risks going down a similar, yet more stagflationary path, hindering real growth, and keeping yields elevated.
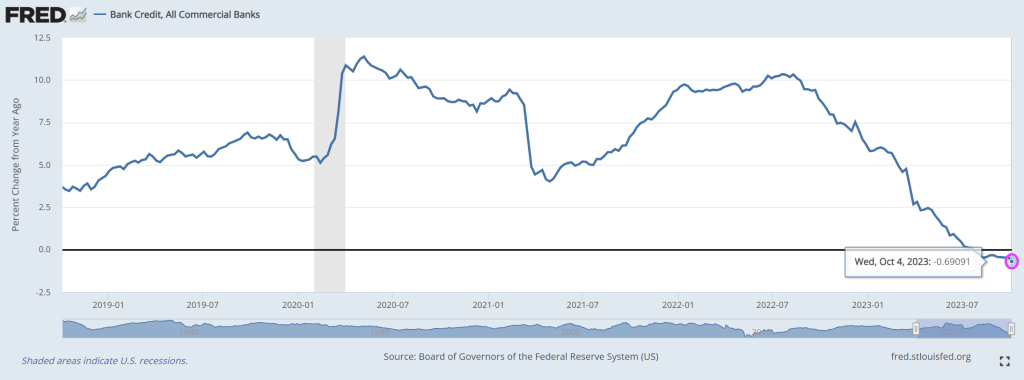
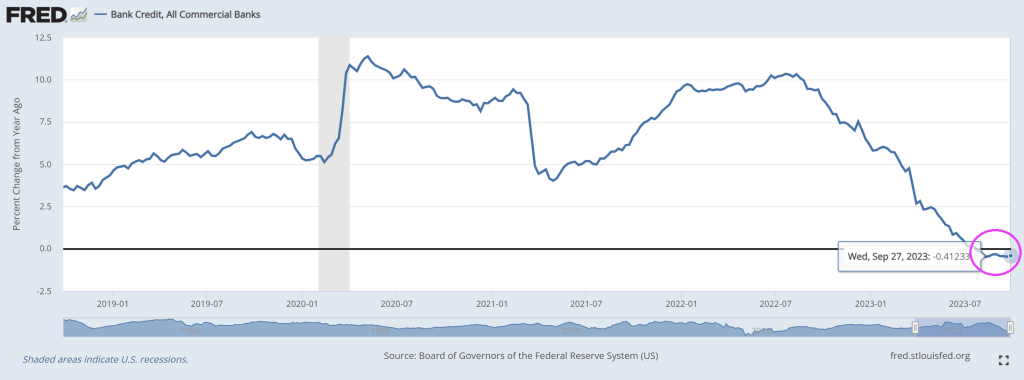
On the private sector side, bank credit fell again last week.
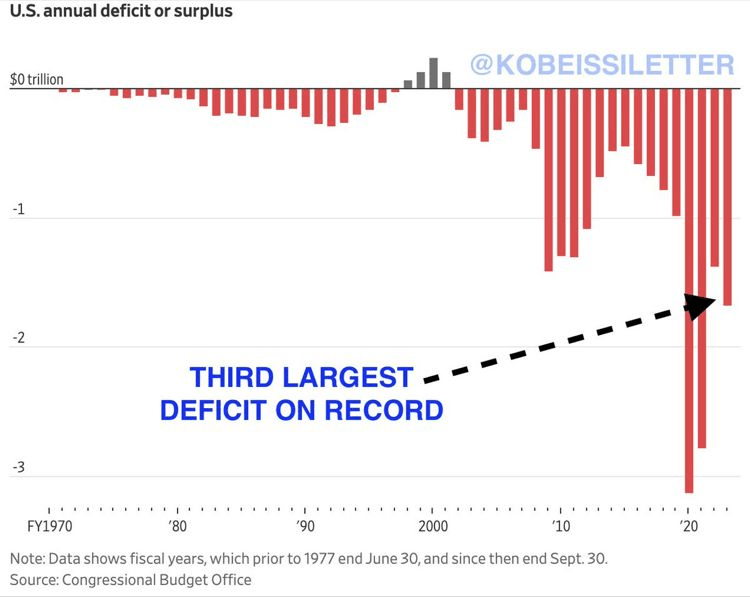
Despite what whispering Joe Biden says, he didn’t reduce the budget deficit other than briefly. The budget deficit is forecast to run persistemly high because of endless, reckless spending and forever wars (Ukraine, Israel and … Taiwan?).
(Bloomberg) — The Federal Reserve faces potential policy pitfalls ahead as it wrestles with how to respond to investor angst about the US government’s $33.5 trillion mountain of debt.
It’s exceedingly difficult to have sound monetary policy without sound fiscal policy. Biden/Democrats do NOT equal sound fiscal policy.
Adding to the pain, the long end of the yield curve is getting clobbered.
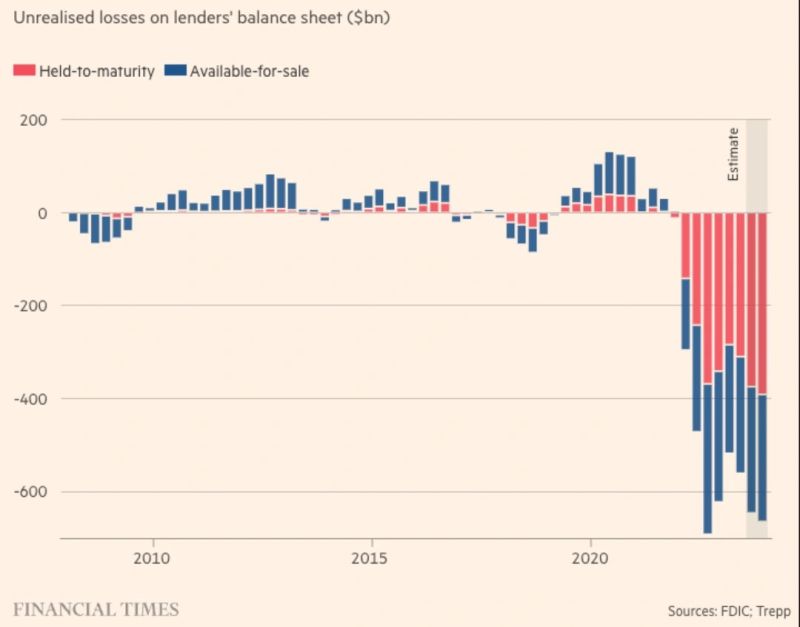
And bank balance sheets are getting clobbered too.
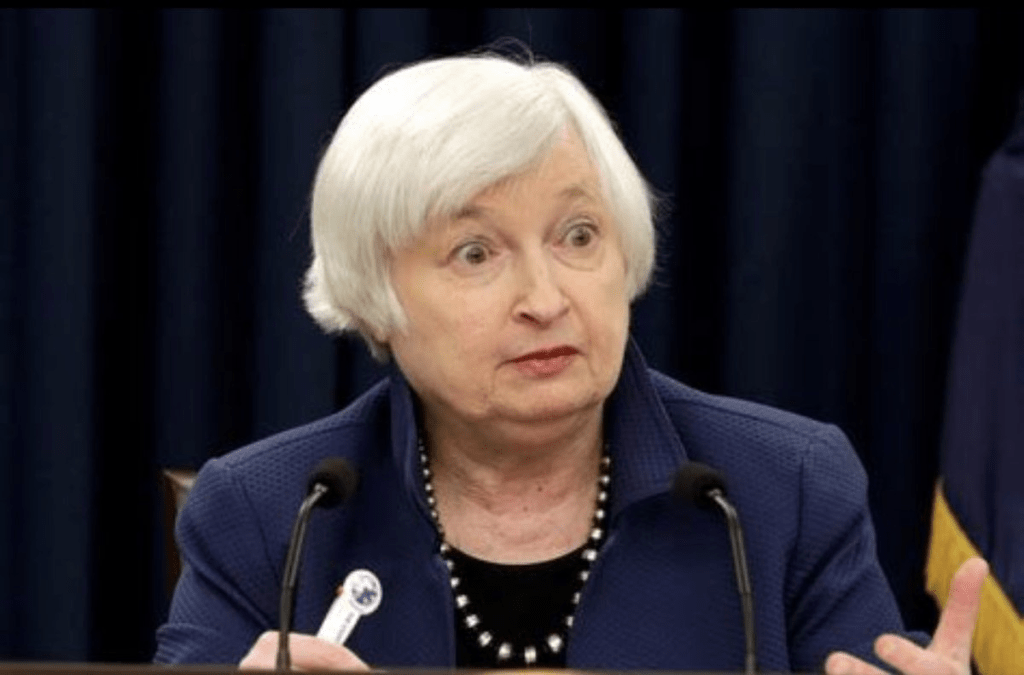
The King of Endless War! Billlions Biden! Who Janet Yellen said is “vibrant.” This is vibrant??
Trust Biden to muddy the waters about US debt, deficits and foreign wars. Hell, Biden could only say that the infamous missile that landed on the Gaza hospital was launched by “the other team” like he was watching an Eagles/Giants football game instead of a slaughter of innocents by Hamas terrorists.
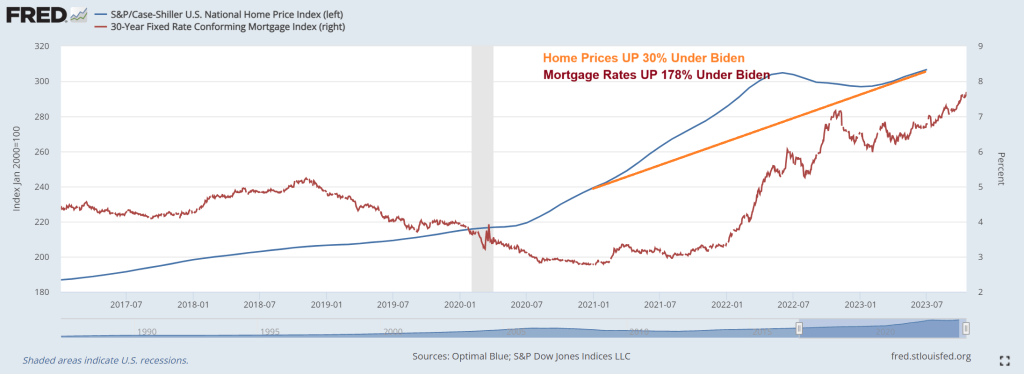
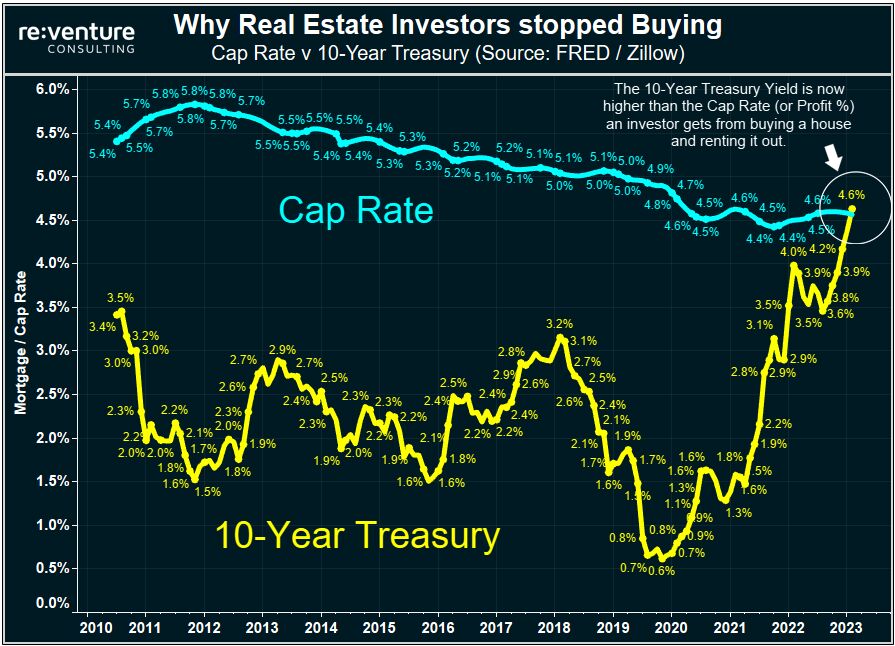
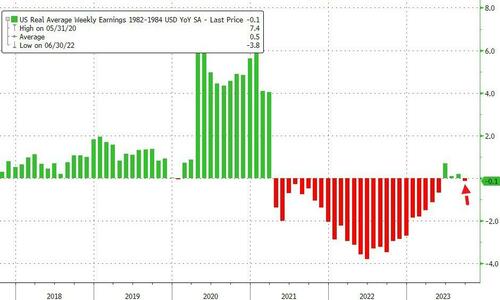
Under Bidenomics, home prices are up 30% while real weekly earnings growth has been negative for most of Biden’s Presidency. And mortgage rates are up 178% under Bidenomics.
It’s harder than ever for Americans to afford a home.
A homebuyer must earn $114,627 to afford the median-priced U.S. home, up 15% ($15,285) from a year ago and up more than 50% since the start of the pandemic. That’s the highest annual income necessary to afford a home on record.
This is based on a Redfin analysis that compares median monthly mortgage payments for homebuyers in August 2023 and August 2022. The income data in this analysis is adjusted for inflation. See the bottom of this report for more on methodology.
Housing costs are higher than ever because of the one-two punch of sky-high mortgage rates and rising home prices. The average rate on a 30-year fixed mortgage was 7.07% in August. Mortgage rates have climbed even higher since then, hitting 7.57% during the week ending October 12–their highest level in over two decades. But even though soaring mortgage rates have dampened demand, low inventory is causing home prices to increase. The typical U.S. home sold for about $420,000 in August, up 3% year over year and just about $12,000 shy of the all-time high hit in mid-2022.
The typical U.S. homebuyer’s monthly mortgage payment is $2,866, an all-time high. That’s up 20% from $2,395 a year earlier, and by that time payments had already increased substantially from the beginning of the pandemic, a time of ultra-low mortgage rates and yet-to-skyrocket home prices. In August 2020, for instance, the typical monthly payment was $1,581, based on that month’s average mortgage rate of 2.94% and median home price of $329,000. At that time, a homebuyer would have needed to earn $75,000 per year to afford the typical home.
The typical American household earns about $40,000 less than the income needed to buy a median-priced home. The median household income was roughly $75,000 in 2022, the most recent year for which annual income data is available. Hourly wages have risen in 2023, but not nearly as fast as the income necessary to afford a home is rising: The average U.S. hourly wage has increased by about 5% over the last year.
“In a homebuyer’s ideal world, rising mortgage rates would push demand and home prices down enough to make up for high interest payments. But that’s not what’s happening now: Although new listings are ticking up slightly, inventory is still near record lows as homeowners hang onto their low mortgage rates–and that’s propping up prices,” said Redfin Economics Research Lead Chen Zhao. “Buyers–particularly first-timers–who are committed to getting into a home now should think outside the box. Consider a condo or townhouse, which are less expensive than a single-family home, and/or consider moving to a more affordable part of the country, or a more affordable suburb.”
Affordability is less of a problem for all-cash and move-up buyers. The major increase in income necessary to afford a home hits first-time homebuyers hardest. Buyers who can afford to pay cash aren’t impacted by high mortgage rates, and they likely earn more than the income necessary to purchase a home, anyway. Buyers who are selling a home to buy another one are in a better boat than first-timers because they have likely built up equity in their current home, which takes a bit of the sting out of soaring monthly payments. The caveat to the caveat is those who bought at the height of the pandemic-era market with an ultra-low mortgage rate and need to sell now: Not only are they giving up a low rate, they also may have lost money on their home.
Metro-level highlights: Income needed to buy a home has risen in all major metros, with biggest uptick in Miami and smallest in Austin
August 2023, analysis includes 100 most populous U.S. metros for which data is available
Metros where necessary income has increased most: In both Miami and Newark, NJ, homebuyers must earn 33% more than a year ago to afford the typical home–the biggest percent increase of the major U.S. metros. Homebuyers in Miami need to earn $143,000 annually to afford the area’s typical monthly mortgage payment of $3,580, and Newark buyers need to earn roughly $160,000 to afford that area’s $3,989 payment.
Other metros where necessary income has increased by over 30%: The income necessary to afford a median-priced home has increased by over 30% in four other metros, all in the eastern half of the country: Bridgeport, CT ($183,000); Dayton, OH ($60,000); Rochester, NY ($66,000); and Hartford, CT ($95,000).
Buyers need to earn more in every major metro: Skyrocketing mortgage rates have caused the income necessary to buy a home to increase in every major metro, even the places where prices have declined over the last year.
Necessary income has increased least in pandemic homebuying hotspots: Austin, TX homebuyers must earn $126,000 to afford the median-priced home, 8% more than a year ago–the smallest increase of all the major U.S. metros. That’s despite Austin home prices falling 7% year over year in August after they skyrocketed during the pandemic, with remote workers flocking in. Boise, ID, another pandemic homebuying hotspot where demand has since dropped, experienced the next-smallest increase: up 9% to $127,000. Salt Lake City, Fort Worth, TX and Lakeland, FL come next, with year-over-year increases of about 13% each. Home prices are down from a year ago in all those metros.
Homebuyers must earn six figures to buy a home in half the major metros in the country: In 50 of the 100 metros in this analysis, buyers must earn at least $100,000 to afford the median-priced home in their area. Buyers must earn at least $50,000 everywhere in the country.
Bay Area buyers must earn $400,000: Buyers in the most expensive markets in the country–San Francisco and San Jose, CA–must earn more than $400,000 to afford the median-priced home in their area, both up nearly 25% year over year. The next five metros are all in California: Anaheim ($300,000), Oakland ($250,000), San Diego ($241,000), Los Angeles ($237,000) and Oxnard ($233,000).
Rust Belt buyers need the least income–but it’s still up from a year ago: Detroit homebuyers must earn about $52,000 to afford the area’s median-priced home, up 19% from a year ago. That’s the lowest income required to afford a home in the U.S. Next come three Ohio metros (Akron, Dayton and Cleveland) and Little Rock, AR, all of which require roughly $60,000 in annual income to buy a home.
Face it, the US economy and housing/mortgage markets are addicted to gov!
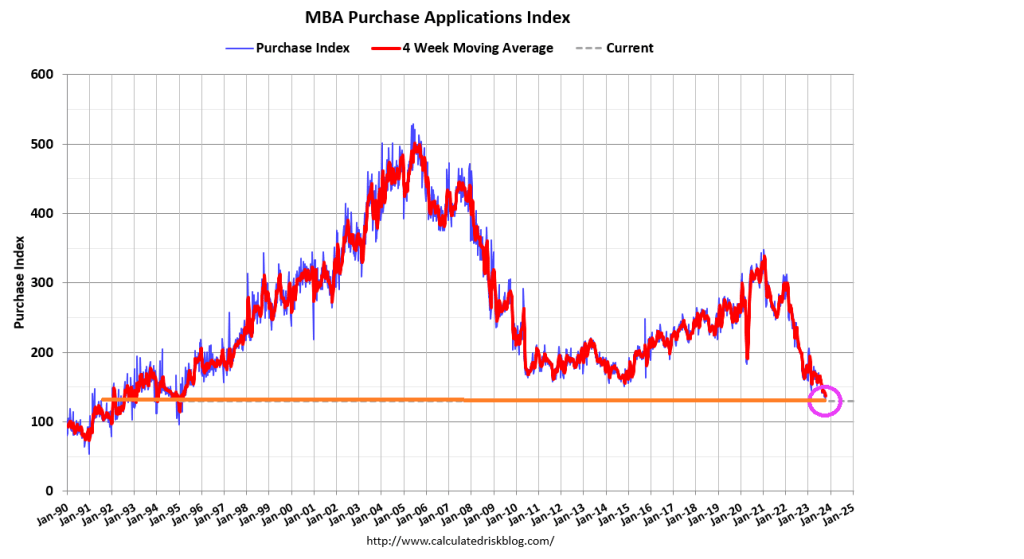
Mortgage applications decreased 6.9 percent from one week earlier, according to data from the Mortgage Bankers Association’s (MBA) Weekly Mortgage Applications Survey for the week ending October 13, 2023. Applications decreased to their lowest level since 1995, as the 30-year fixed mortgage rate increased for the sixth consecutive week to 7.70 percent – the highest level since November 2000.
The Market Composite Index, a measure of mortgage loan application volume, decreased 6.9 percent on a seasonally adjusted basis from one week earlier. On an unadjusted basis, the Index decreased 7 percent compared with the previous week. The Refinance Index decreased 10 percent from the previous week and was 12 percent lower than the same week one year ago. The seasonally adjusted Purchase Index decreased 6 percent from one week earlier. The unadjusted Purchase Index decreased 5 percent compared with the previous week and was 21 percent lower than the same week one year ago.
The Federal Reserve thinks economic growth comes with lots of debt and low interest rates. The Fed succeeded in that banks, consumers and The Federal government went wild in borrowing money, but now a hangover is happening as inflation surged and interest rates rose.
First, debt laden banks.
Paper losses on the most opaque part of US banks’ bond portfolios are now close to $400bn — an all-time high, and 10 per cent above the peak at the start of the year that caused the collapse of Silicon Valley Bank.
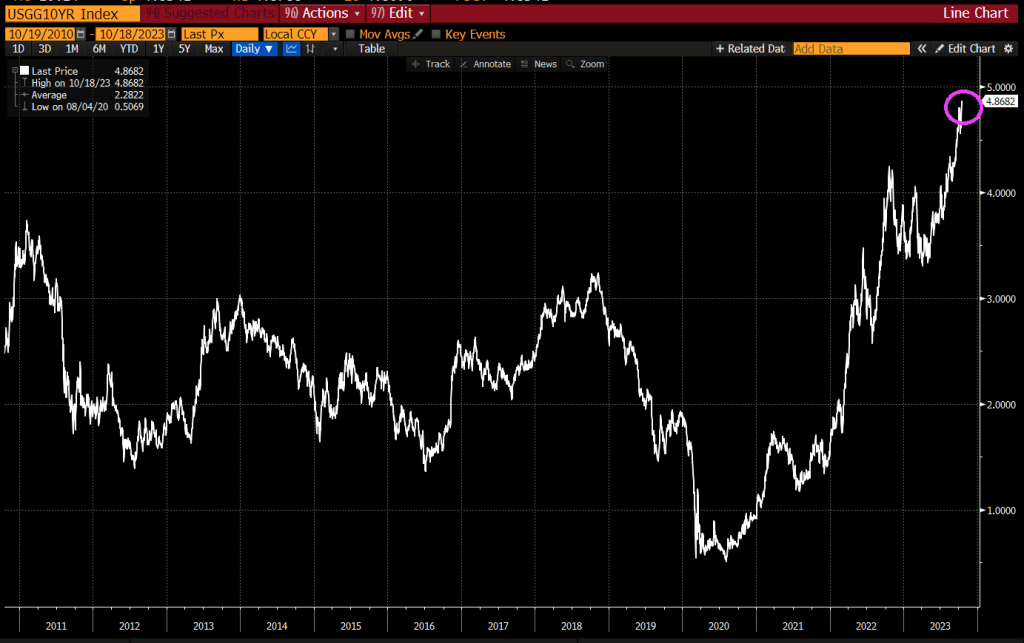
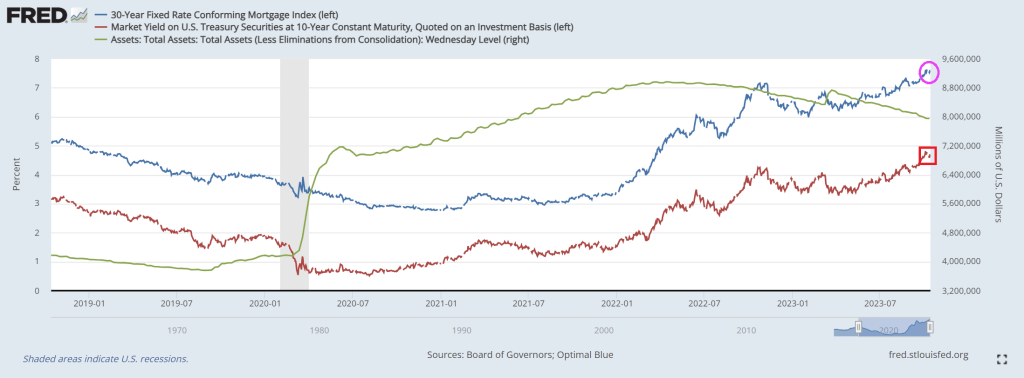
Rising interest rates are really causing havoc at banks, particularly small banks. The US 10-year Treasury yield rose again after a brief respite in rate increases.
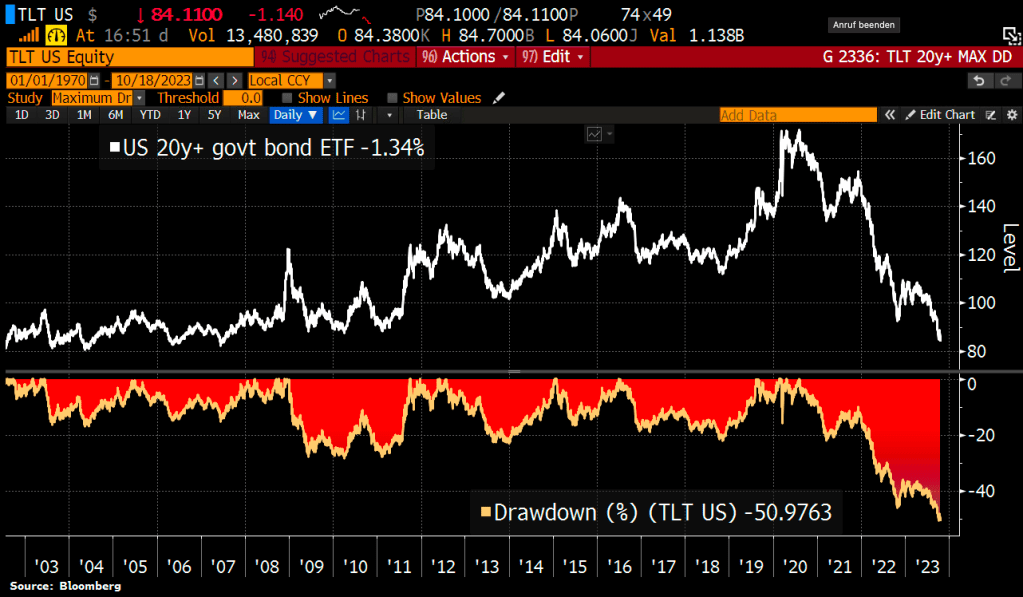
iShares 20+ Treasury Bond ETF is getting crushed with inflation and Fed rate hikes.
And The Federal government is seeing interest payments on their massive $33 TRILLION debt load. Rising Treasury yields = higher US interest payments on debt … really fast.
And with interest rates rising, Americans are seeing a surge in debt.
With rising Treasury yields, the 30-year conforming mortgage yield is up 173% under Biden’s Reign of Economic Error.
And then we have US Debt Clock, Federal debt is now above $33.56 TRILLION that is causing no consternation for Treasury Secretary Janet Yellen who said that the US economy is great and we can afford to fight wars in Ukraine AND Israel! Of course, Yellen believes in the foolish Modern Monetary Theory (aka, just keep printing money and hope nobody cares).
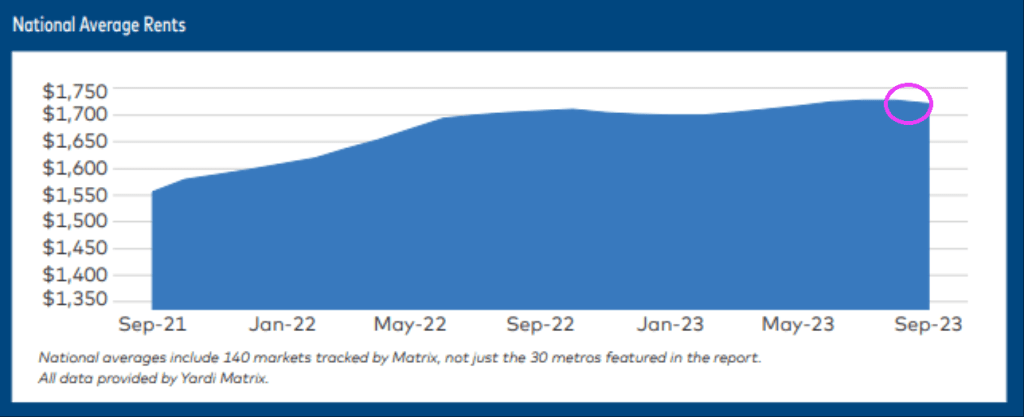
Multifamily rents turned negative in September, with the average U.S. rent declining $6 from August and $3 during the third quarter. It marked the first time since 2009 when national rents decreased in September.
Hopefully a downturn in rent growth will let buying a home more affordable relative to rent in San Jose, San Francisco, Honolulu, Los Angeles and Seattle.
Headline NAHB confidence index printed at 9-month lows (down 5 to 45, vs 49 exp). That is the 4th straight monthly miss in a row (and 5 upside surprises).
I remember when economists used to say, “Inflation? No problem! Inflation allows us to devalue the massive debt!” Except that inflation crushes the middle class and low wage workers.
Introducing Treasury Secretary Janet Yellen, the actual Nutty Professor who still thinks that the US can spend and borrow unlimited amounts without consequence.
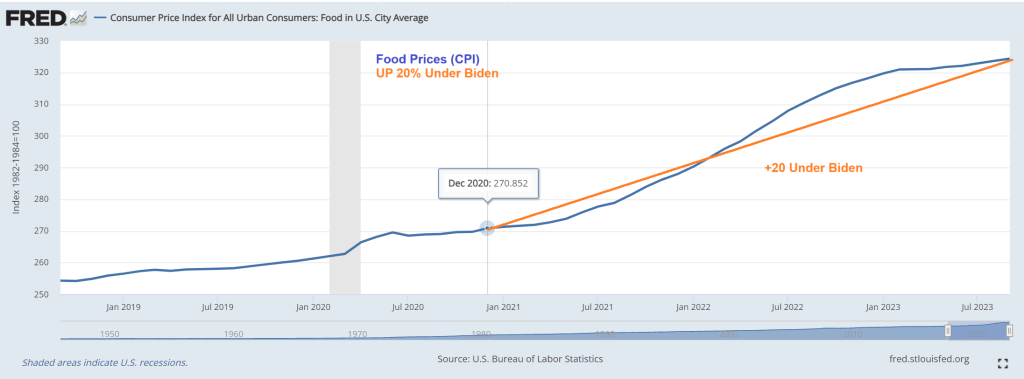
First, food prices are up 20% since December 2020. Talk about destruction of middle class wealth!
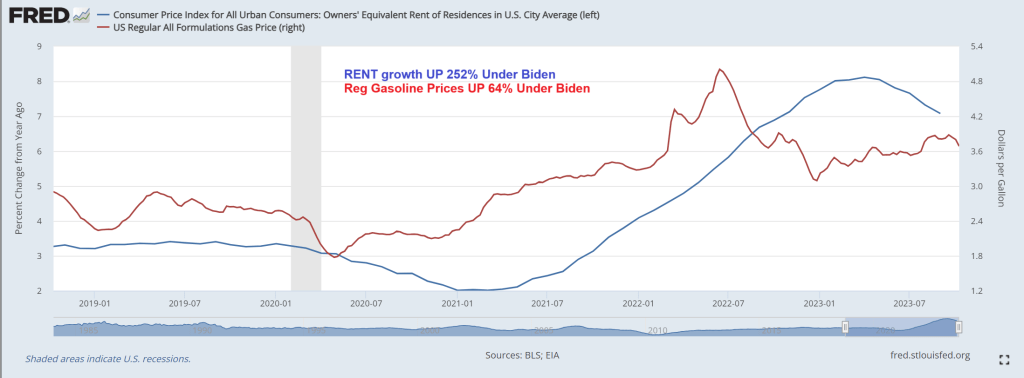
That is in addition to gasoline prices are up 64% under Biden while rent growth is up 252%. Well, Biden waived through millions of illegal immigrants and rent had to rise. Biden and Washington DC’s broken borders is Livin’ La Vida Loco.
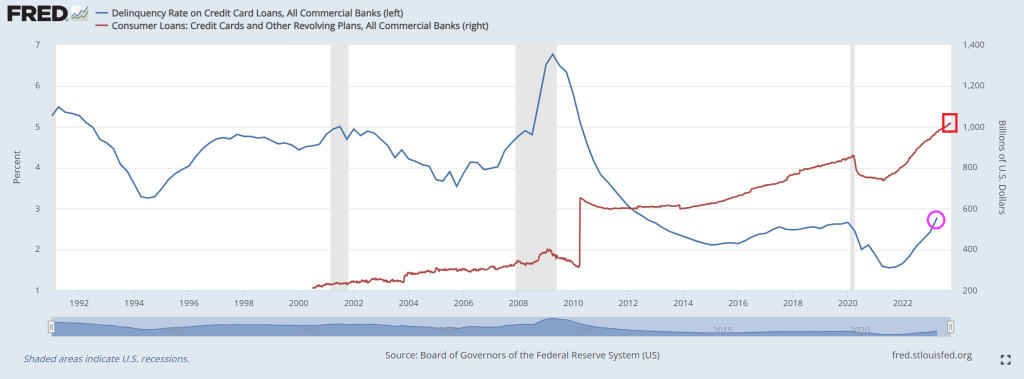
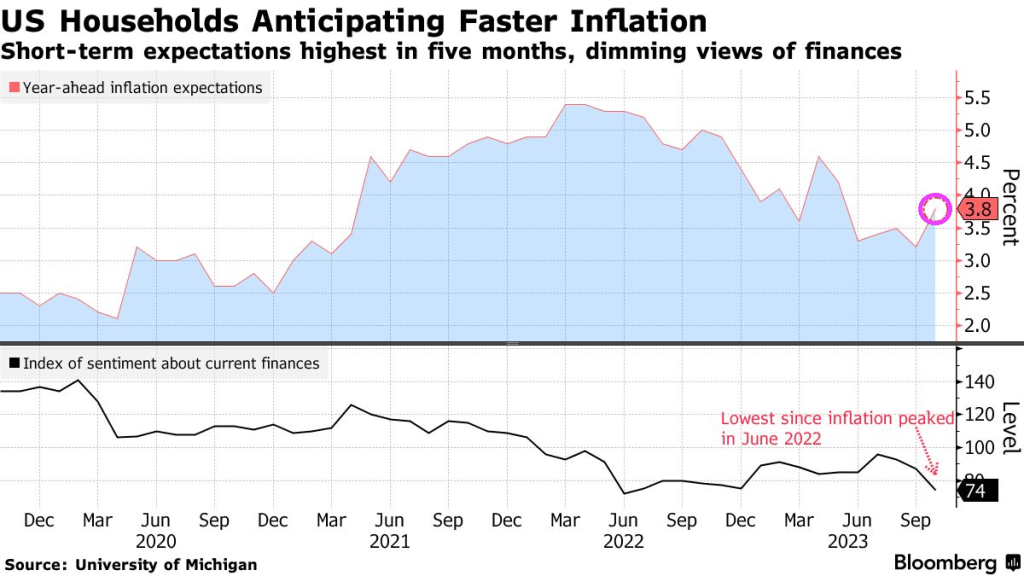
To cope with inflation (that Paul Krugman claims is over but the last inflation report showed that the tinders of inflation are hard to extinguish), consumers have turned to credit cards to survive. In fact, credit cards have expanded 38% since April 2021 despite rapidly rising interest rates. And credit card delinquency rates are rising and are now above Covid-era economic shutdown levels.
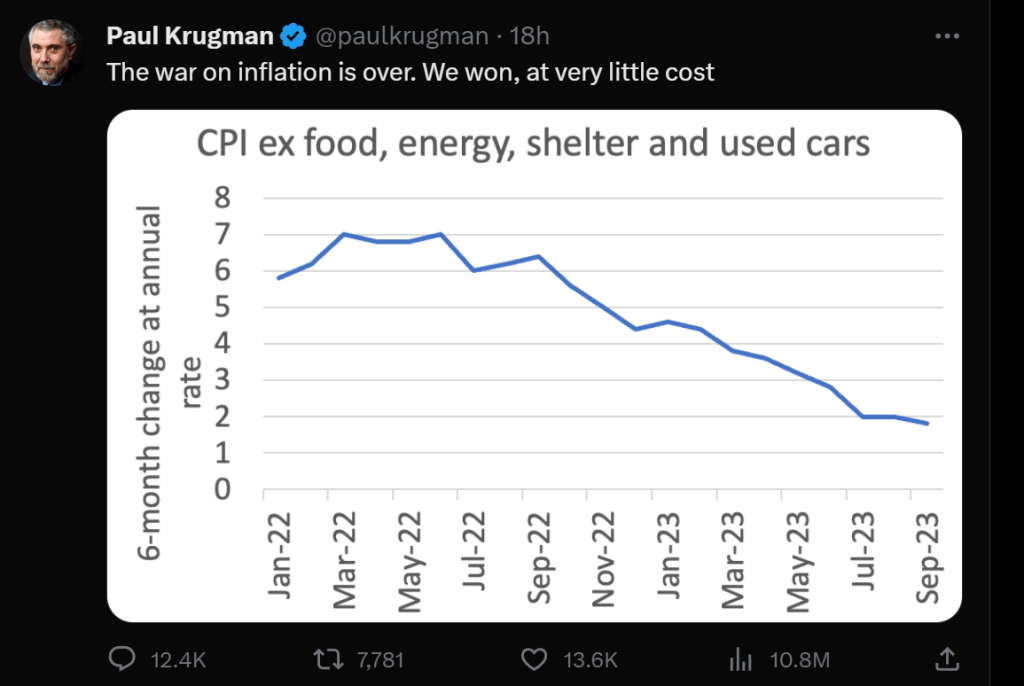
Paul Krugman, Nobel Laureate in economics and media celebrity, made a terrible claim yesterday when he pronounced that “The war on inflation is over. We won, at very little cost.” Krugman’s proclamation was trumpeted by The View’s Joy Behar Joy who claimed that everything is going great in the country! The economy is “booming” and people are having an “easier time” putting bread on the table. Huh? Easier than a month ago maybe, but not easier since 2021 under Bidenomics.
Hmm. Suppose that during World War II the Germans had stopped after they invaded and captured Paris on June 14, 1940. The war could have been over, but France was lost to Germany amidst thousands of dead and loss of property. That is not a victory, but a crushing defeat.
Just like my Paris example, Krugman’s claim the war on inflation is over and we won AT VERY LITTLE COST was grossly misleading and a big kerplunk (thud). Why? For one, the average American family is $7,400 POOR than in January 2021 when Biden became President. So, it looks like we know the cost of inflation and it was steep, not “very little cost.” Well, very little cost to elitist millionaires like Krugman.
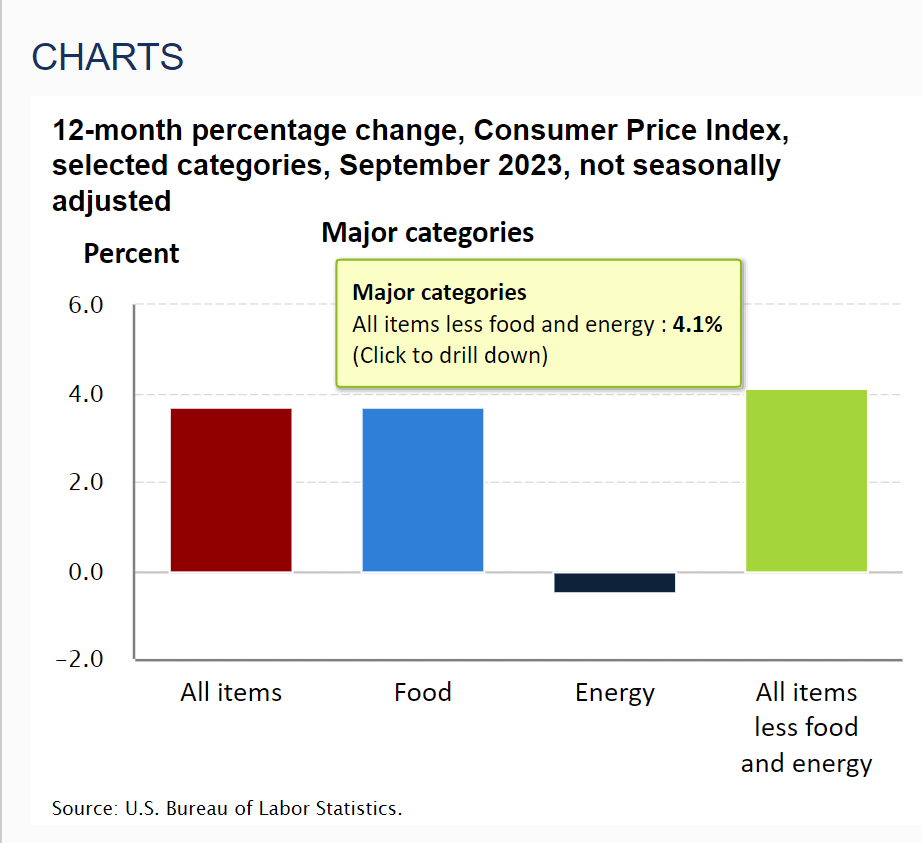
Krugman loves the recent inflation report from the BLS. Specifically, the 12-month change in the Consumer Price Index Less Food And Energy for September was 4.1%. Krugman focuses on the recent 6-month change being less than 2%. In Krugman’s mind, this is victory … core inflation has been tamed and inflation is at The Fed’s target rate of 2%.
But before Krugman pops the champagne cap on the 1959 Dom Perignon for $42,350 (while the rest of us are drinking E&J Gallo’s Thunderbird), bear in mind that he is referring to the RATE OF GROWTH in prices, not the highly elevated levels of prices. Victory against inflation would be if prices returned to December 2020 levels.
I pointed out yesterday that “real” wages contracted 0.1% YoY (after 3 months positive) in September. It is important to note that real wage growth was negative from 2021 until 3 months ago, but has gone negative yet again. Victory??
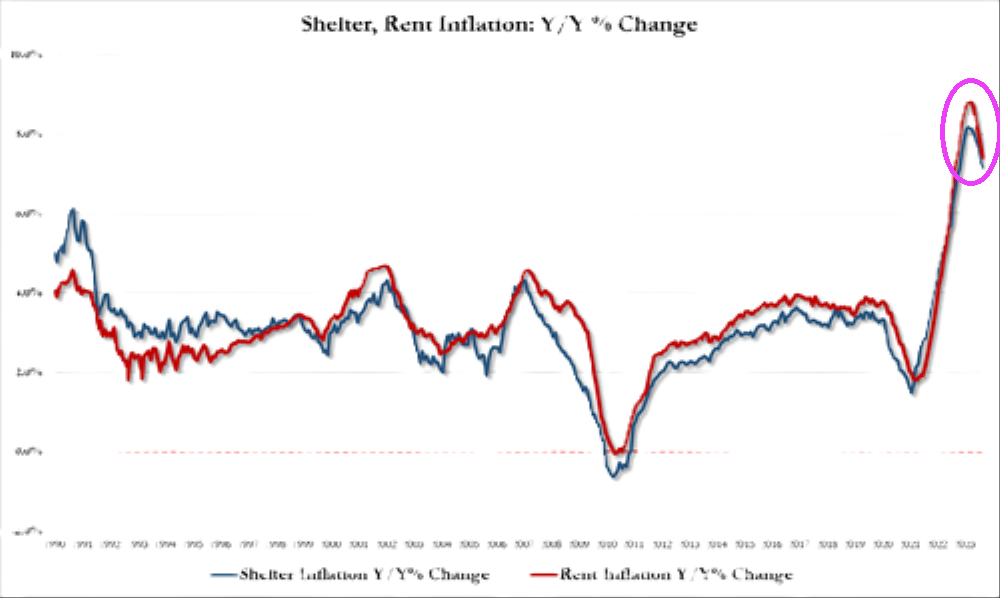
Krugman prefers core inflation, removing food, housing and energy. You know, the three things most Americans actually care about. Take shelter (or rent of residence) where rent is growing at a sizzling 7.1% YoY.
Under Biden and Congress’ reckless spending splurges (and inane Federal energy policies), regular gasoline prices are up 64%. Growth in rent of residence has grown 252%! So, Professor Krugman, Americans are far worse off than before Biden was President.
If prices return to December 2020 (or pre-Covid levels), I will declare a victory. But for right now, symbollically, the German army is occupying France and Paris with horrible suffering for the French people. In other words, Americans are still far worse off under Biden even though inflation is finally slowing.ew
Speaking of France and World War II, maybe we should consider Joe Biden as today’s Pierre Laval, leader of Vichy France since Biden seems more concerned with pleasing Klaus Schwab and The World Economic Forum than America’s middle class and low wage worker (like Laval was concerned with that German leader Adolf Hitler thought).
Bidenomics is failing catestropically. Example? As interest rates rise to fight Biden’s Federal spending splurges, bank credit growth slowed to -0.41% YoY for the 10th straight week of negative credit growth.
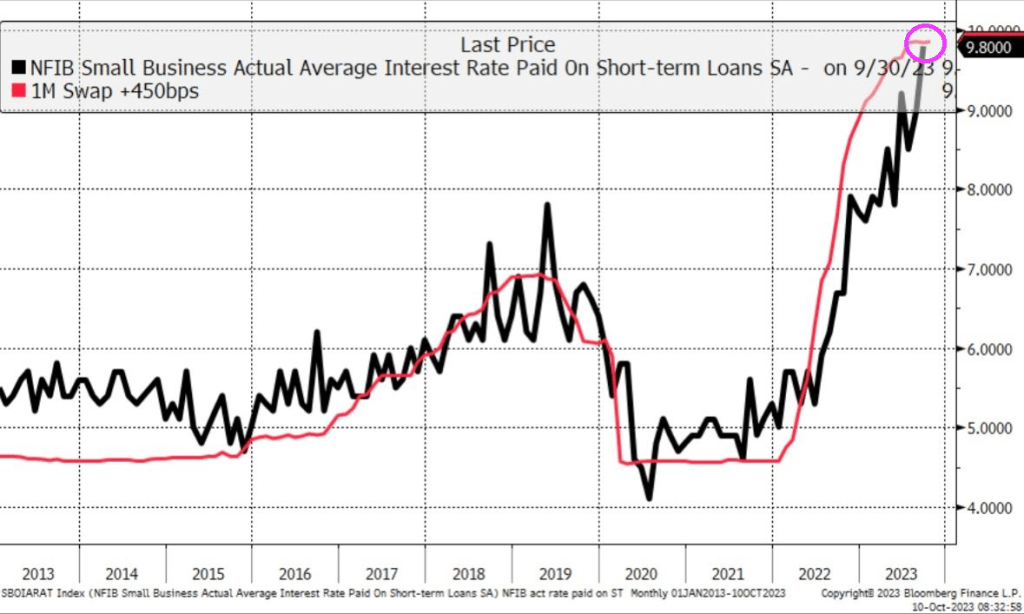
While interest paid on short-term loans almost 10%!!
“Jimmy, watch me tank the economy even worse than you did!”
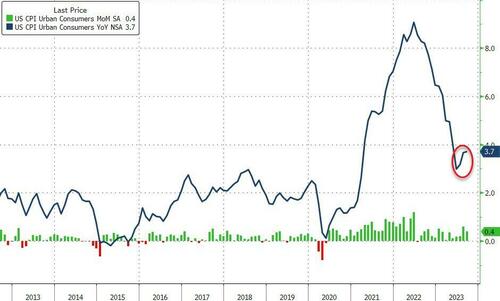
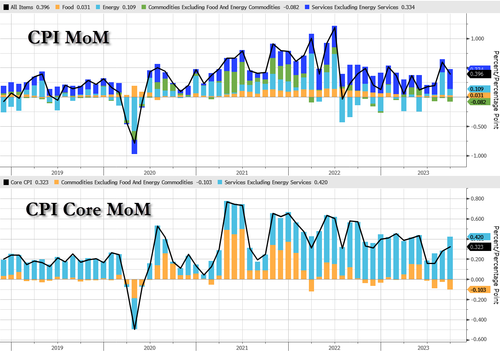
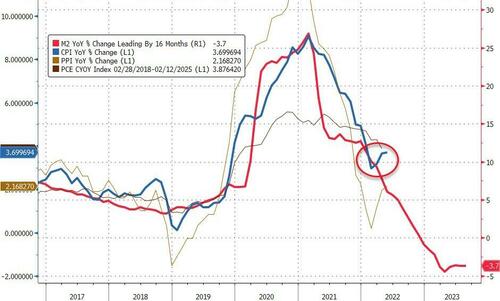
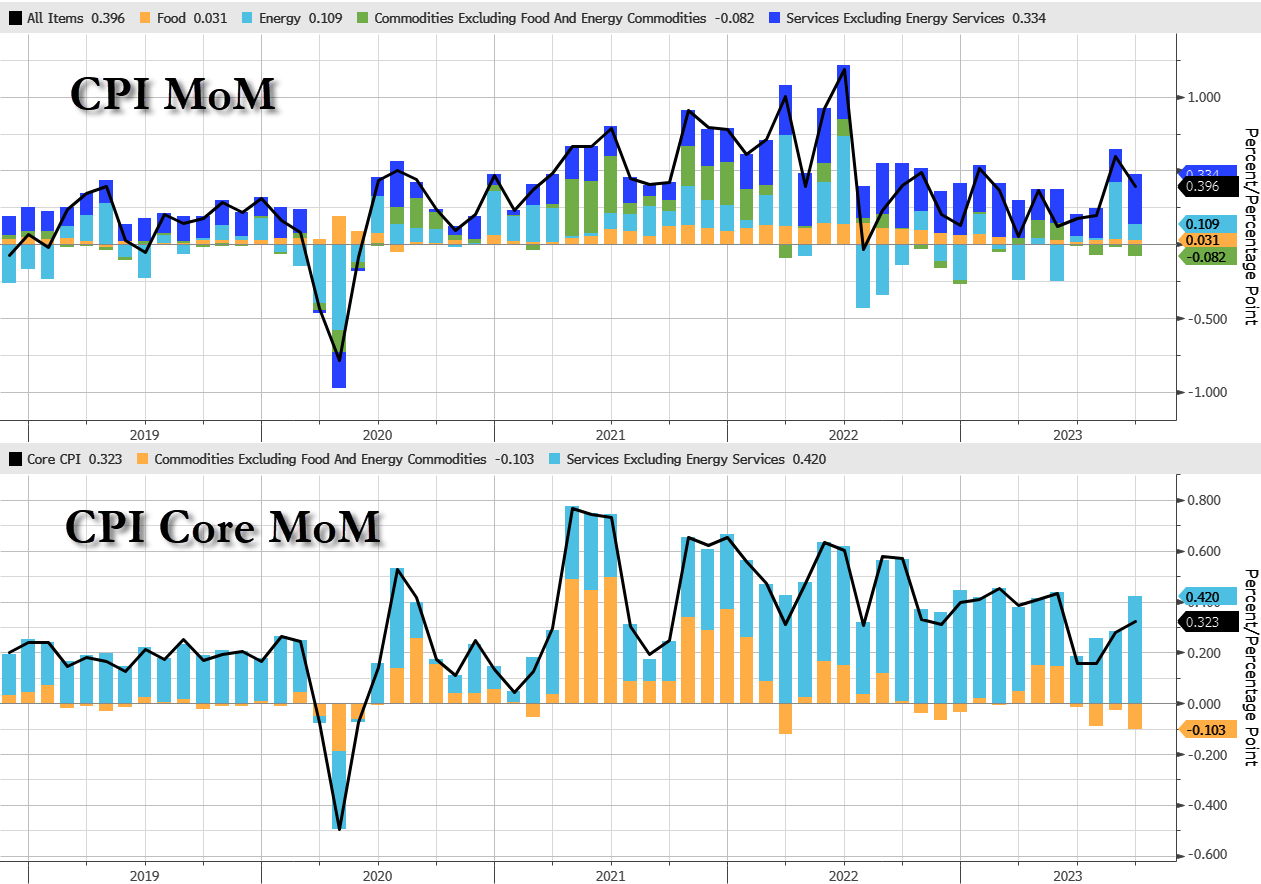
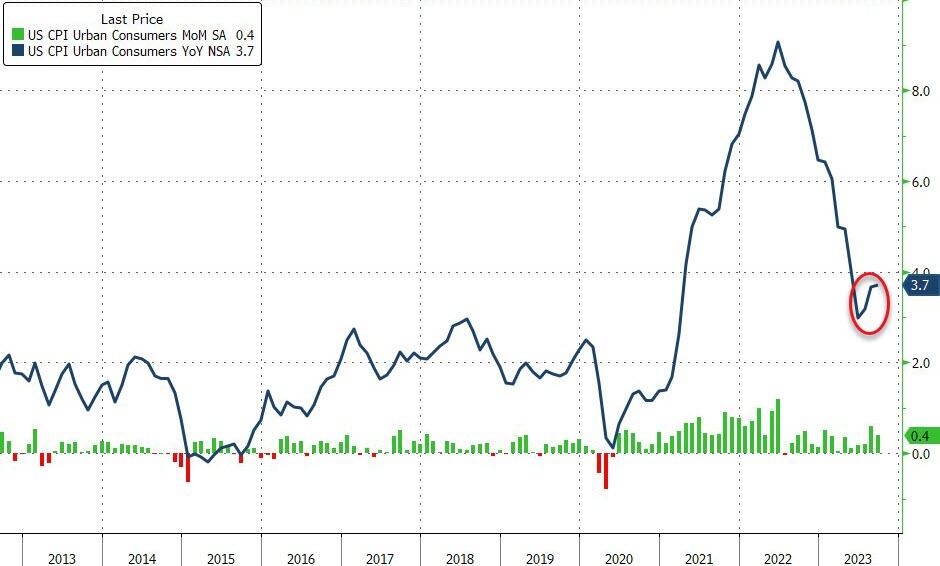
However, headline CPI came in modestly hot at +0.4%, with YoY at 3.7% – that is the 3rd monthly rebound in a row.
Source: Bloomberg
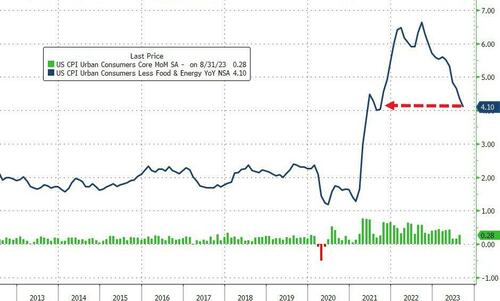
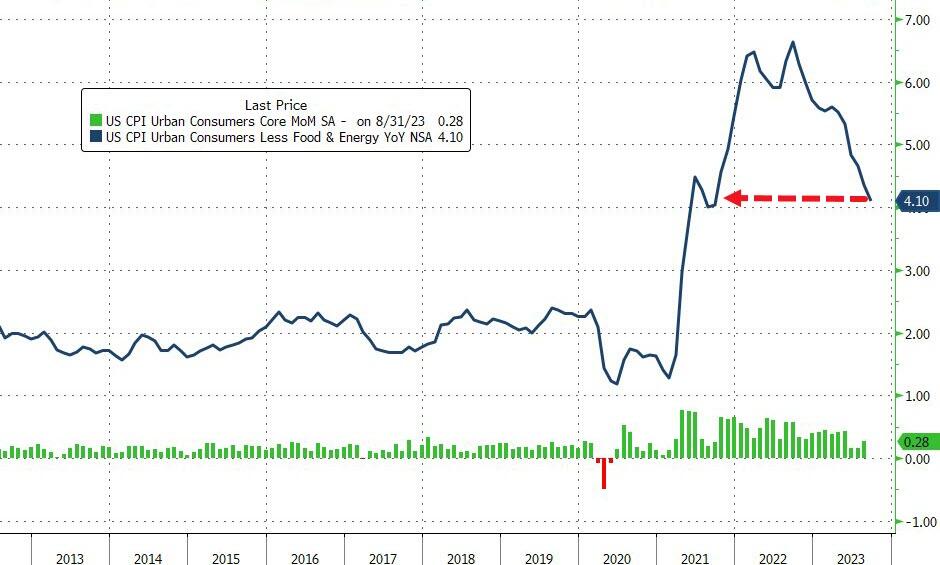
Core CPI rose 0.3% MoM, with YoY sliding to +4.1% YoY (as expected)… it still hasnt been below 4.00% since May 2021….
Source: Bloomberg
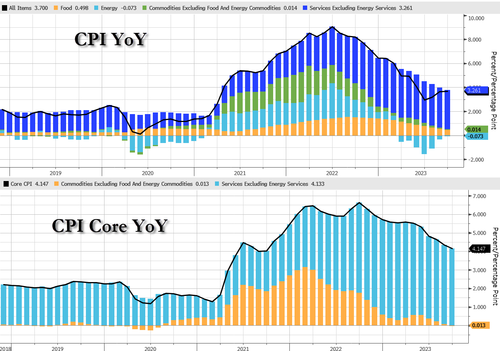
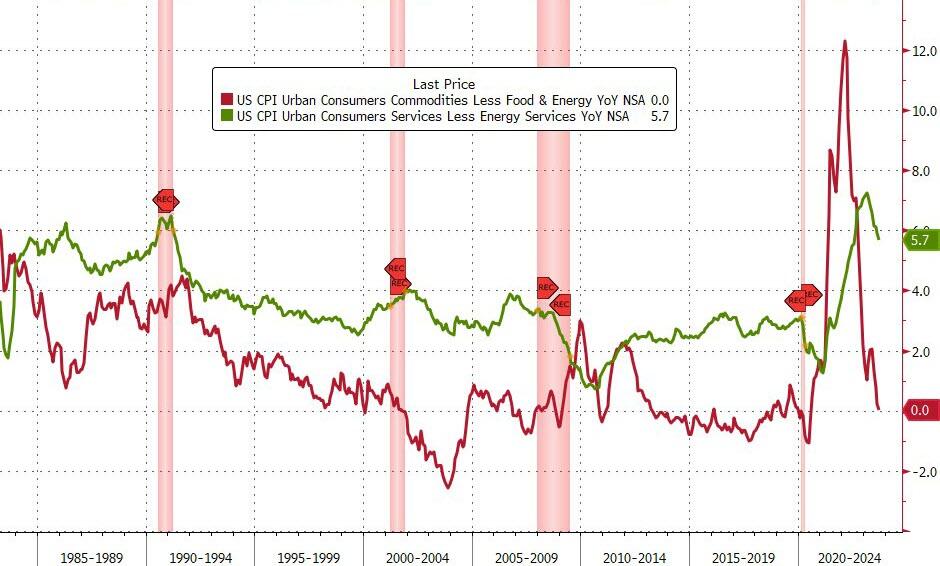
Food and Commodities contribution to YoY CPI slowed while Services increased…
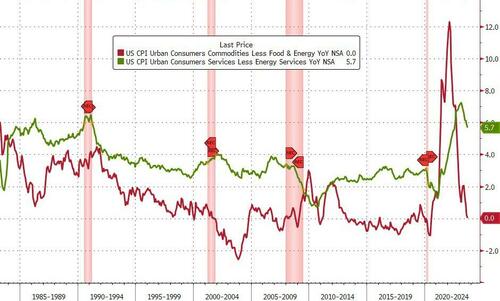
Goods inflation dipped back to unchanged YoY and Services CPI slowed to +5.7%…
Services stands out on A MoM basis…
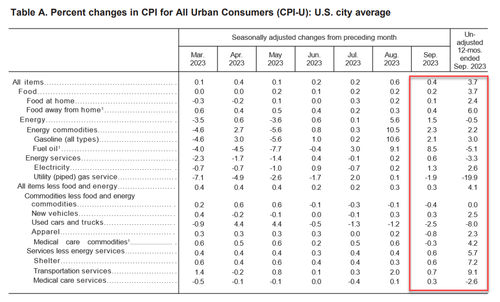
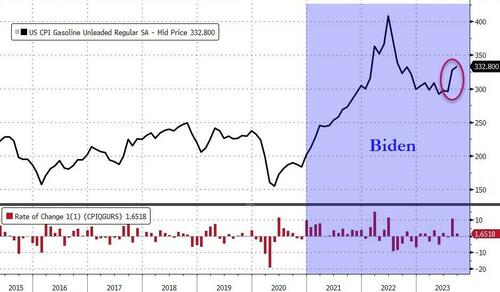
Under the hood, gasoline continues to rise and used car prices drop…
Rent of primary residence and owner’s equivalent rent YoY both exceeeded 7%. Fixing a car/truck rose 10.2% (will people start to notice that repairing EVs is outrageously expensive?).
The index for all items less food and energy rose 0.3 percent in September, as it did in August.
The shelter index was the largest factor in the monthly increase in the index for all items less food and energy.
The shelter index increased 0.6 percent in September, after rising 0.3 percent the previous month. The index for rent rose 0.5 percent in September, and the index for owners’ equivalent rent increased 0.6 percent over the month.
The lodging away from home index increased 3.7 percent in September, ending a string of 3 consecutive monthly decreases.
Among the other indexes that rose in September was the index for motor vehicle insurance, which increased 1.3 percent after rising 2.4 percent the preceding month.
The indexes for recreation, personal care, new vehicles, and household furnishings and operations also increased in September.
The medical care index rose 0.2 percent in September, as it did in August.
The index for hospital services increased 1.5 percent over the month, and the index for physicians’ services was unchanged.
The prescription drugs index fell 0.7 percent in September.
The index for used cars and trucks fell 2.5 percent in September, after decreasing 1.2 percent in August.
The apparel index declined 0.8 percent over the month, and the communication index was unchanged.
The index for all items less food and energy rose 4.1 percent over the past 12 months.
The shelter index increased 7.2 percent over the last year, accounting for over 70% of the total increase in all items less food and energy.
Other indexes with notable increases over the last year include motor vehicle insurance (+18.9 percent), recreation (+3.9 percent), personal care (+6.1 percent), and new vehicles (+2.5 percent).
Gasoline prices continue to rise…
Shelter costs are slowing, but accounted for the largest part of core CPI…
Rent inflation 7.41%, down from 7.76% in August and the lowest since Sept 2022
Shelter inflation 7.15%, down from 7.27% in August and the lowest since Nov 2022
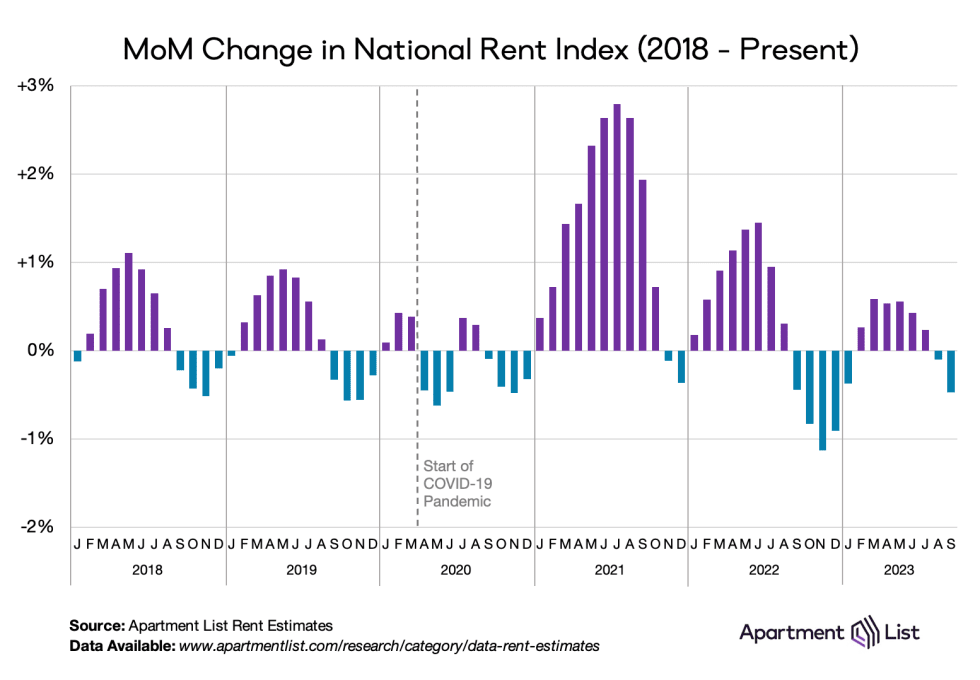
Bear in mind that while CPI very stale data is rising over 7%, real-time rent indicators are in freefall. Apt List’s Sept rent drop was the biggest on record…
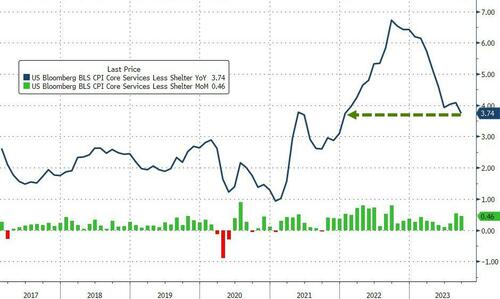
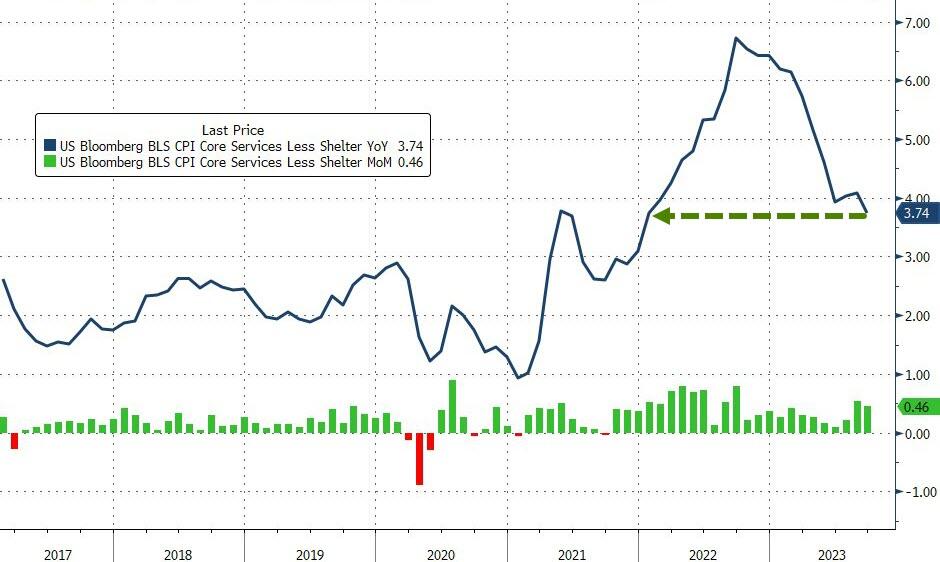
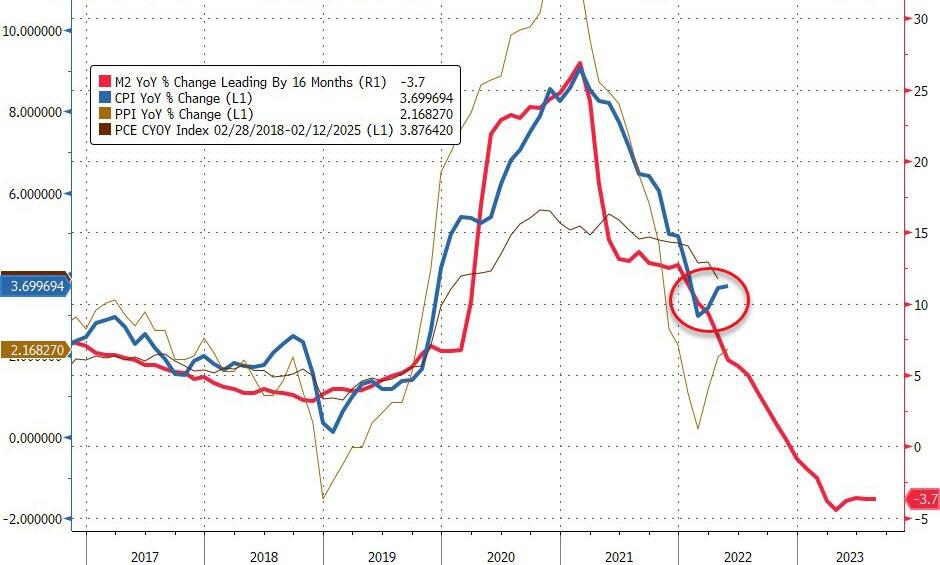
And perhaps most importantly, one silver lining is that The Fed’s new favorite inflation signal – Core Services CPI Ex-Shelter YoY slowed to +3.74% (despite jumping 0.46% MoM). That is the lowest YoY since Dec 2021…
Is this third straight monthly increase in CPI YoY an inflection point? Or is M2 still leading the trend?
Turning from the cost of things to the ability to pay, “real” wages contracted 0.1% YoY (after 3 months positive)…
This is not the soft-landing cruise lower in inflation that the market (and The Fed) was hoping for…
Former Fed Chair Janet Yellen, notorious for leaving rates too low for too long (TLTL) and then suddely raising them after Donald Trump was elected President, wants rates lower again for much longer. Make rates great again (MRGA?).
YELLEN SAYS DEBT SERVICE COSTS WILL BE 1% OF GDP FOR THE NEXT DECADE. – Reuters
Her statement implies that the economy will be strong and the government will run budget surpluses, or interest rates will be near zero for the next ten years.
Instead of guessing what she is pondering, we do some math and arrive at the only possible answer.
The Government Can’t Afford Today’s Interest Rates
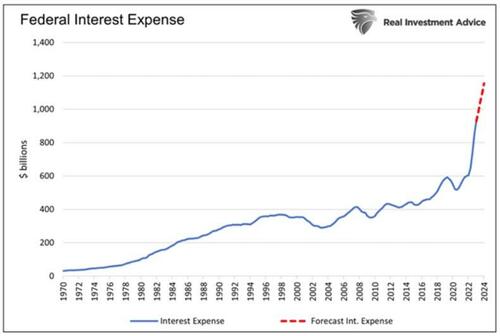
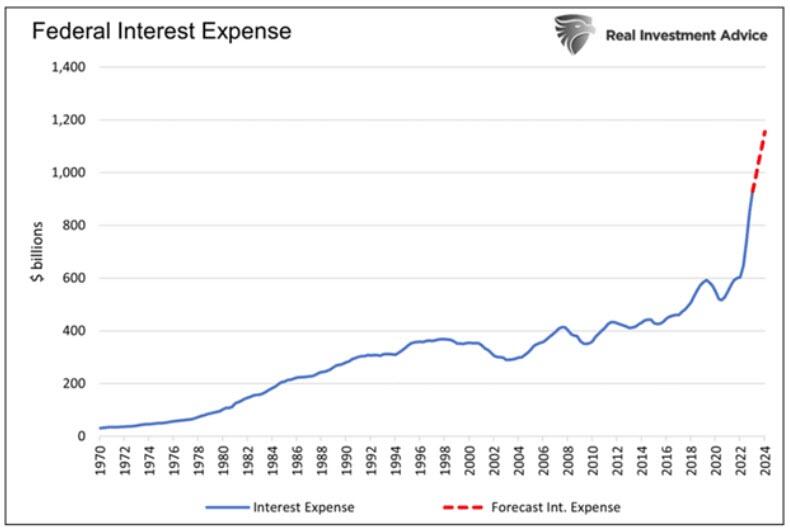
Before walking through various scenarios to figure out what Yellen may be implying, it’s helpful to provide background on what drives her mindset. In our article The Government Can’t Afford Higher For Longer, Much Longer, we shared the following graph and commentary:
Total federal interest expenses should rise by approximately $226 billion over the next twelve months to over $1.15 trillion. For context, from the second quarter of 2010 to the end of 2021, when interest rates were near zero, the interest expense rose by $240 billion in aggregate. More stunningly, the interest expense has increased more in the last three years than in the fifty years prior.
The graph above is just the tip of the fiscal iceberg. Every month, lower-interest-rate debt matures and will be replaced with higher-cost debt.
Higher interest rates are an additional funding burden for the federal government. Janet Yellen surely understands the damaging situation and grasps that higher interest rates are not feasible given current debt levels.
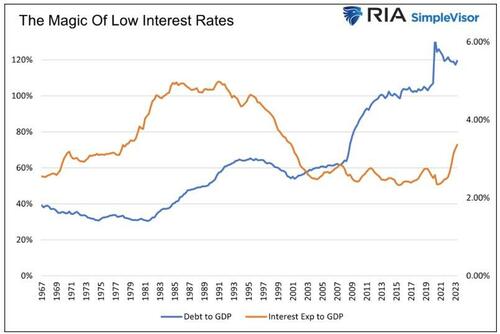
Low-Interest Rates Make Debt Manageable
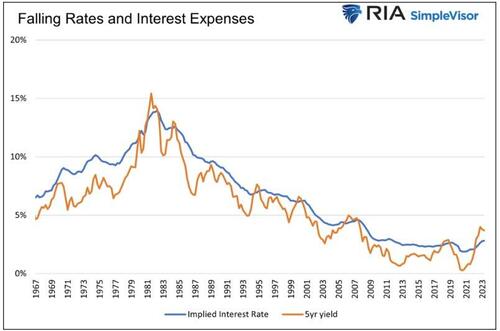
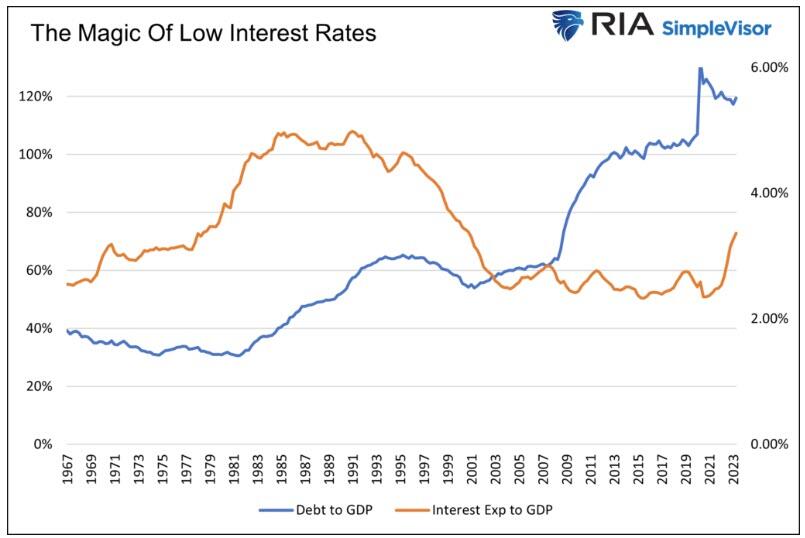
The government’s debt-to-GDP ratio has climbed three-fold since 1966. Yet, until very recently, the ratio of the federal interest expense to GDP was at its lowest level since 1966.
While the amount of debt rose sharply, its cost was offset by rapidly falling interest rates. As a result, higher debt levels were very manageable.
If $1 trillion of debt with a 4% coupon matures, and the Treasury replaces it with $2 trillion at a 2% coupon, the interest expense doesn’t change despite doubling the debt. While a simplified example, that is essentially what has occurred for the last 30 years.
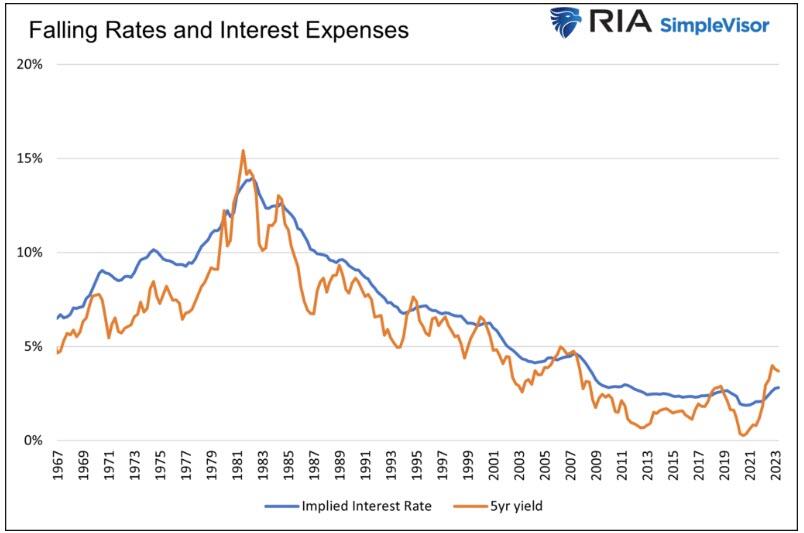
The following graph compares the 5-year U.S. Treasury note and the implied cost of funding the government’s debt.
In time, as lower interest rate debt is replaced with higher interest rate debt, the benefits of lower rates work in reverse.
“Debt Service Costs At 1%” – Is It Possible?
We return to Janet Yellen’s message and discuss why she is likely correct.
Balanced Budgets and Unicorns
In the five years leading up to the pandemic, nominal GDP grew at 5.03% annually. Let’s optimistically assume growth continues at 5% consistently for the next ten years. Now, let’s tack on an even bolder presumption: the government balances its budget every year for the next ten years. Thus, the amount of outstanding debt will remain constant. For context, in the last 57 years, there has only been one year in which the amount of debt has not increased.
In such a far-fetched scenario, the debt-to-GDP ratio would drop considerably to 70%. However, interest costs would equal 2% of GDP. Such is much better than the current 3.36% but double Janet Yellen’s 1% objective.
Budget surpluses for the next ten years would lower interest expenses even more and possibly get the interest expense to GDP ratio to 1%. However, the odds of a unicorn spraying rainbows across the sky and the government running a surplus are the same: zero percent.
Consequently, we exclude surpluses as a viable way to reduce the interest expense to a more manageable level.
Budget Deficits And The Magic Of Low-Interest Rates
Balanced budgets or surpluses are unrealistic, given the political and fiscal trends. Further, the economy relies heavily on government spending. While fiscal prudence would be good in the long run, the short-run effect would be a recession.
Instead of using pipe dreams as scenarios, let’s get realistic. The more likely, albeit still optimistic, scenario involves the debt and GDP growing at the same rate. Let’s also assume interest rates remain at current levels. In this exercise, we assume an average borrowing cost of 4.75%, which is a little below the current weighted average funding cost for the government. Under this “realistic” picture, interest expense would climb to 5.6% of GDP.
The only logical variable in the equation that can make Janet Yellen correct is the future interest rate.
To arrive at Yellen’s 1% figure, assuming debt grows at the rate of GDP, interest rates must be much lower.
In time, a weighted average interest rate of 0.85% would put the nation’s interest expense at 1% of GDP.
When Janet Yellen tells us the debt cost to GDP ratio will be 1% over the next ten years, she is really saying interest rates will be below 1% for the next ten years.
Therefore, Janet Yellen must believe that the recent spike in inflation and yields is an anomaly. If the pre-pandemic economic and interest rate trends resume, she will be correct.
Summary
Part of Janet Yellen’s job is to exude confidence to its investors. In this case, it means telling the public that the current jump in interest expenses will not last. While she would probably prefer to be straightforward and say interest rates will be much lower, she must also be sympathetic to the Fed’s job of getting inflation down. Therefore, to walk the party line, she must speak in code, so to speak.
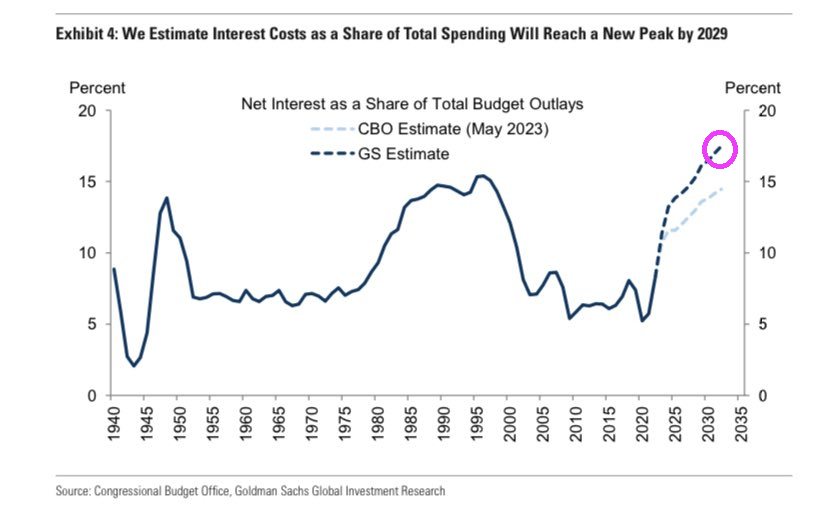
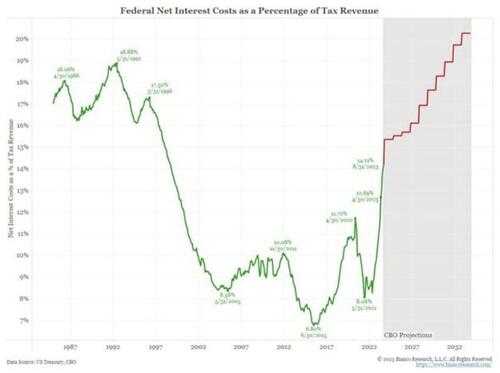
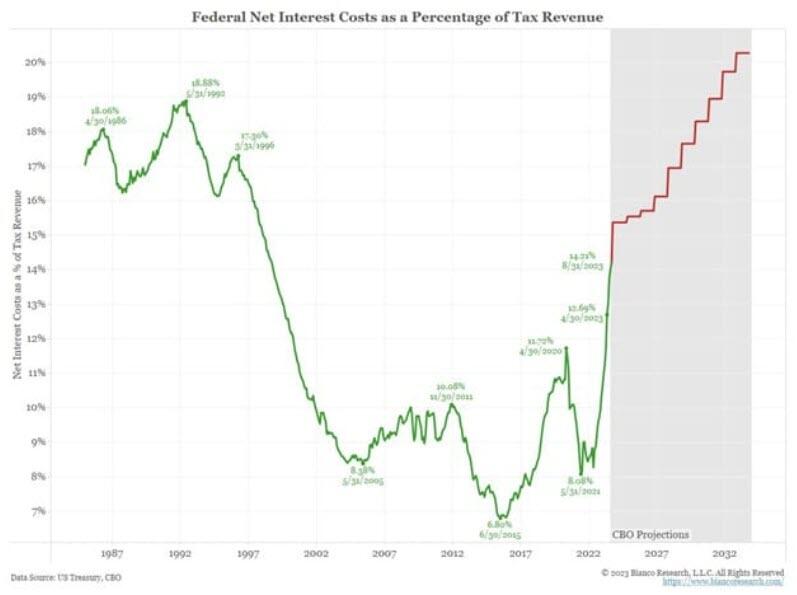
Whether you agree with Yellen’s projection or not, the following CBO graph projecting interest costs as a percentage of tax revenues, courtesy of Bianco Research, highlights that the government has no choice but lower for longer interest rates. The current level of interest rates will bankrupt the nation.
This makes sense. Two global elitists who look down with disdain and want to reprogram MAGA voters. Can we reprogram the MRGA types into letting rates float to market.


You must be logged in to post a comment.