I said over and over again, Bidenomics will be a drag.
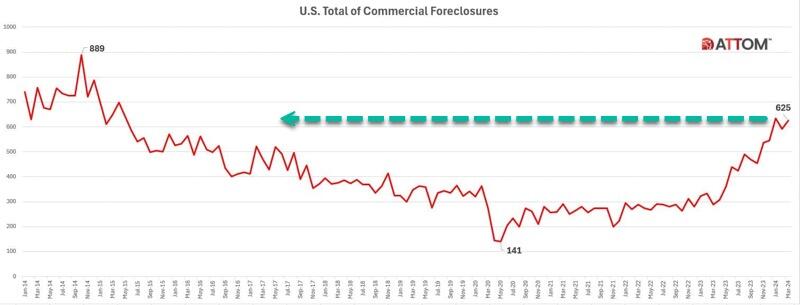
The latest report from real estate data provider ATTOM shows CRE foreclosures topped 625 in March, up 6% from February and 117% from the same period last year.
ATTOM has been tracking commercial foreclosures since 2014. The number of foreclosures is approaching the peak of 889 in October 2014.
“California began experiencing a notable rise in commercial foreclosures in November 2023, surpassing 100 cases and continuing to escalate thereafter,” the report said.
New York, Florida, Texas, and New Jersey also showed increases in CRE foreclosures last month.

Regional banks provide a bulk of the financing for the space. The ongoing mess in the lending space due to tighter conditions adds pressure to the CRE downturn. Banks are expected to set aside more money to cover potential CRE losses.
Last month, Federal Reserve Chair Jerome Powell testified on Capitol Hill, “We have identified the banks that have high commercial real estate concentrations, particularly office and retail and other ones that have been affected a lot,” adding, “This is a problem that we’ll be working on for years more, I’m sure. There will be bank failures, but not the big banks.”
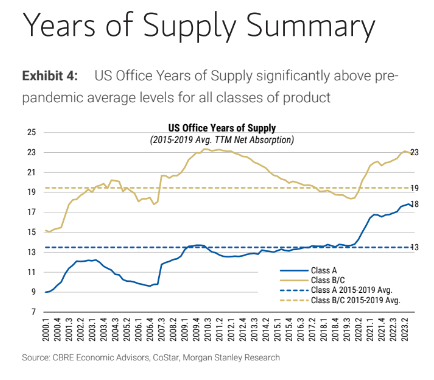
Data from a recent Treasury Department’s Financial Stability Oversight Council (FSOC) warned office vacancy rates have climbed sharply in recent years, reaching a record of 13.1% at the end of 2023.
CoStar analyst Phil Mobley recently noted the “reset in office demand has rocked US markets.”
Morgan Stanley warned earlier this year that office prices could plunge 30% due to sliding demand.
With sliding demand comes a massive amount of supply. Morgan Stanley pointed out that most of the oversupply is in offices and apartments.
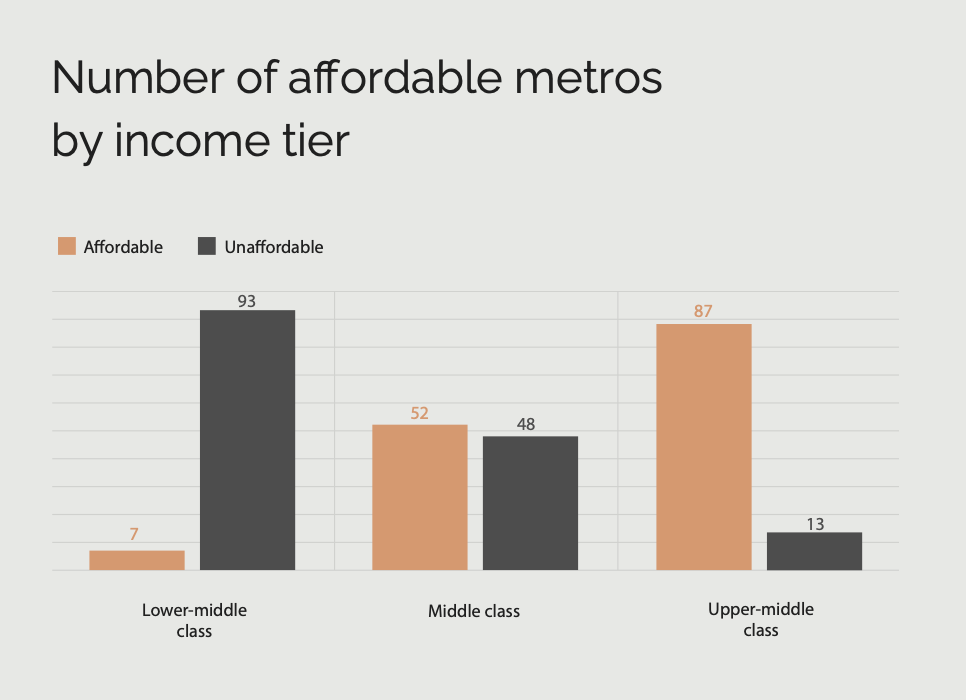
For those wondering why the excess supply of office towers can’t be converted into affordable housing, Goldman also noted that prices must drop 50% for housing conversions to make sense.
Powell has a rolling crisis on his hands. And the goal is to save the fireworks for after the election.


You must be logged in to post a comment.