The Cold Reality of Bidenomics And The Jobs Market: Philadelphia Fed Admits US Payrolls Overstated By At Least 800,000 (All New Jobs Over Past Year Were Part-time Jobs!)

Well, ain’t this a kick in the head!

The Philadelphia Fed says the US Payrolls overstated by at least 800,000. While Biden was in New York City with the other former Presidents (Clinton and Obama) raising money for Biden’s reelection bid, Trump attended a wake for a fallen police officer.

The jobs market is much worse than Biden and his mouthpieces claim.

The first red flags emerged in the summer of 2022: that’s when the Biden Labor Department started well and truly rigging the labor market data.

Something has snapped in the labor market: that’s when a staggering discrepancy emerged between the number of Payrolls (as measured by the BLS’ Establishment Survey, a far more crude and imprecise, yet much more market-moving data series), and the number of actual Employed Workers (as measured by the BLS’ far more accurate Household Survey). As we showed at the time, after the two series had tracked each other tick for tick, a gap opened in March 2022 which quickly grew to 1.5 million jobs in just 3 months…
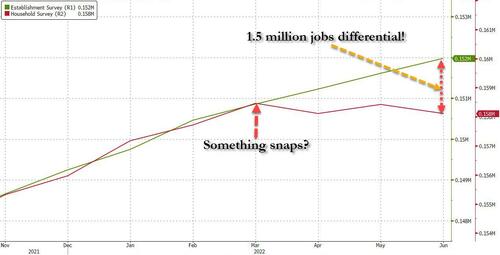
… and has since exploded to a whopping gap of 5 million “jobs” that apparently do not exist.
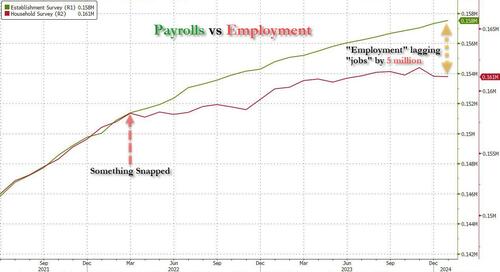
And while some of this discrepancy could be explained with the record surge in multiple jobholders, which increased by 1 million since March 2022 to an all time high of 8.6 million at the end of 2023 (as a reminder, the Establishment Survey counts 1 worker have 2 or 3 (or more) multiple jobs as, well, 2 or 3 (or more) separate jobs, even if it is just one worker trying to make ends meet under the roaring inflation of Bidenomics), most of the gap remained unexplained.

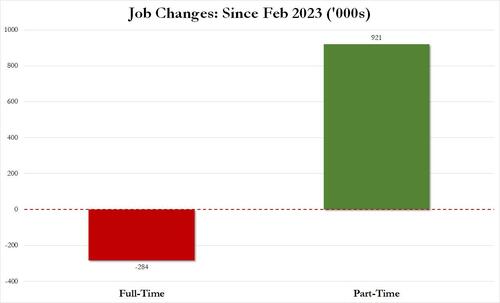
There was more: it was around the summer of 2022 that the Biden labor department – in its zeal to show job growth no matter the cost, or quality of jobs – also started fooling around with the composition of the labor market, with most of the monthly gains going to part-time workers, even as full-time workers stagnated or declined. The culmination, as we reported earlier this month, is that in February 2024, the US had 132.9 million full-time jobs and 27.9 million part-time jobs. Which is great… until you look back one year and find that in February 2023 the US had 133.2 million full-time jobs, or more than it does one year later! And yes, all the job growth since then has been in part-time jobs, which have increased by 921K since February 2023 (from 27.020 million to 27.941 million).
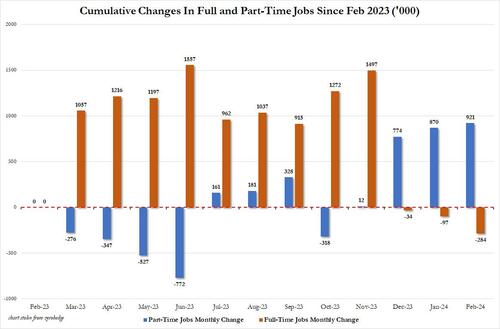
In other words, starting in 2022 and accelerating to present days, less and less full-time jobs were added, until we got to the absurd situation that all the new jobs in the past year have been part-time jobs!
And then there was, of course, the great jobs replacement theory, only as we first showed well over a year ago, it wasn’t a theory but practiceand following countless months in which native-born workers lost their jobs, including a near-record 3-month plunge to start 2024…
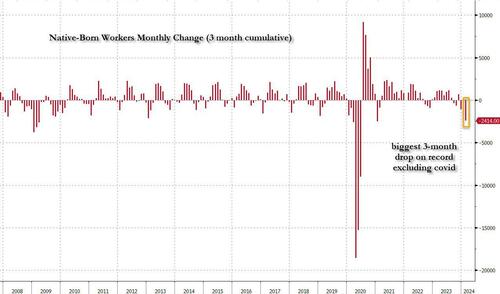
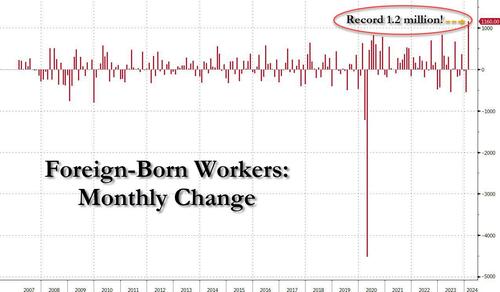
… offset by a record 1.2 million foreign-born (read immigrants, both legal and illegal but mostly illegalworkers added in February…

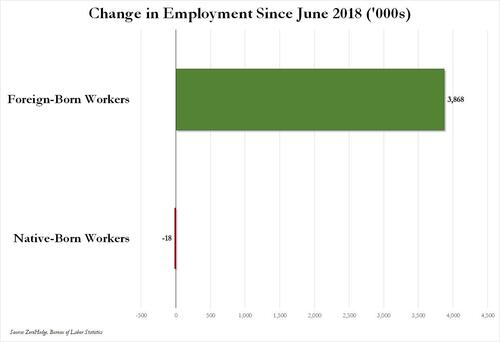
Or, as we first pointed out several months ago, not only has all job creation in the past 6 years – since May 2018 – has been exclusively for foreign-born workers…
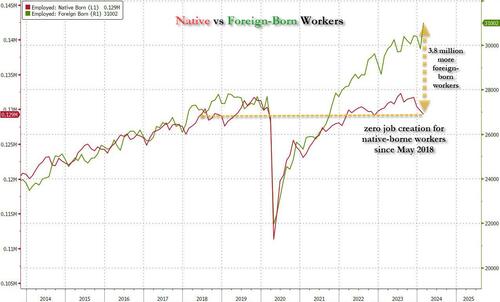
… but there has been zero job-creation for native born workers since June 2018!
Ok fine, but all of the above are really just example of the Biden admin Labor Department playing around with statistics and trying (and succeeding) to fool the greatest number of people. There is really nothing about outright data rigging and fabrication… and also while we realize that the Household survey shows a far uglier labor market – one where part-time jobs, illegal immigrants, and multiple jobholders dominate – what about the Establishment survey, which is behind the actual payrolls number, the only number that matters as far as the market is concerned?

All good points, and to address them, we first have to go back to December 2022, when it reported something shocking: as part of its data analysis of the “more comprehensive, accurate job estimates released by the BLS as part of its Quarterly Census of Employment and Wages (QCEW) program“, the Philadelphia Fed found that the BLS had overstated jobs to the tune of 1.1 million! This is what the Philadelphia Fed wrote in its quarterly Early Benchmark Revision of State Payroll Employment report at the time:

Our estimates incorporate more comprehensive, accurate job estimates released by the BLS as part of its Quarterly Census of Employment and Wages (QCEW) program to augment the sample data from the BLS’s CES that are issued monthly on a timely basis. All percentage change calculations are expressed as annualized rates. Read more about our methodology. Learn more about interpreting our early benchmark estimates.

So what did this “more accurate”, “more comprehensive” report find? It found that…

In the aggregate10,500 net new jobs were added during the period rather than the 1,121,500 jobs estimated by the sum of the states; the U.S. CES estimated net growth of 1,047,000 jobs for the period.

This is shown graphically in the chart below: specifically, the analysis looks at the quarter in the red box, where the green line, or the more accurate “early benchmark” revision of official data, dipped decidedly below the CES trendline (i.e., the nonfarm payrolls).
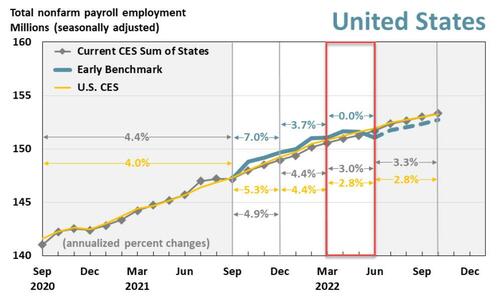
Alas, since the far more accurate Quarterly Census of Employment and Wages (QCEW) numbers would not be actually incorporated into BLS benchmarks for well over a year after we wrote our analysis in Dec 2022, neither we nor the market would know just how manipulated the data was until early 2024. Which, of course, is now, and as we already know, the BLS had been consistently downward revising virtually all initial job prints in 2023 (ten of the eleven jobs reports heading into Dec 2023 were revised lower) to make the economy more realistic but only in retrospect…
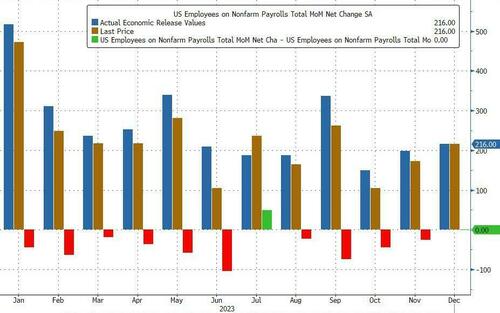
… however, even though we do know now that the jobs data in 2022 was far weaker than anyone thought at the time, nobody really cares: after all there are part-time jobs and illegal immigrants to plug any and all historical holes, plus we are talking about ancient history.

Plus, we have all those great recent jobs reports to fall back on: the ones that confirm that Bidenomics is doing such a great job.

Only… that’s not true either. Presenting Exhibit A: the latest Philadelphia Fed quarterly report on Early Benchmark Revisions of State Payroll Employment. It shows that once again, the BLS has been fabricating jobs, and not just any jobs but those that make up the all-important (if highly inaccurate) payrolls reported by the Biden Bureau of Goalseeked Statistics.

The primary purpose of this analysis, in the Philly Fed’s own words, is “to produce timely estimates of state payroll jobs that closely predict the annual benchmark revisions released by the BLS each March. To do so, we incorporate more comprehensive job estimates released by the BLS as part of its Quarterly Census of Employment and Wages (QCEW) program.” This is more or less a replica of the analysis which the Philly Fed performed back in December, when it found that 1.1 million jobs were unexpectedly “missing.”

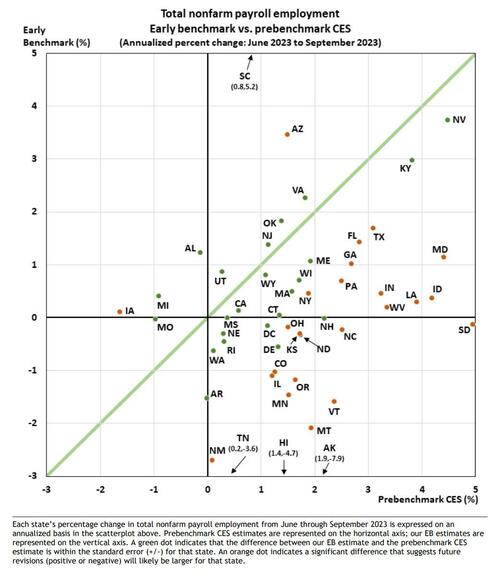
So what happened this time? Well, the analysis, which looked at state-level data, “found that “the employment changes from June through September 2023 were significantly different in 27 states compared with prebenchmark state estimates from the Bureau of Labor Statistics’ (BLS) Current Employment Statistics (CES).” Specifically, “early benchmark (EB) estimates indicated lower changes in 24 states, higher changes in three states, and lesser changes in the remaining 23 states and the District of Columbia.

Some more details from the report:

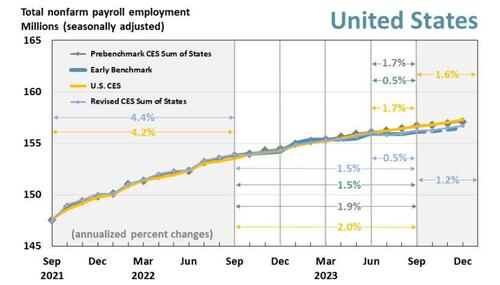
Over the full year ending with this 2023 Q3 vintage — which includes additional QCEW data changes affecting the prior three quarters — payroll jobs in the 50 states and the District of Columbia grew 1.5 percent.

  • Based on the pre-benchmark CES sum of states and the U.S. CES, payroll jobs grew 1.9 percent and 2.0 percent, respectively.
  • The revised CES sum-of-states growth rate is 1.5 percent.

For 2023 Q3, payroll jobs in the 50 states and the District of Columbia rose 0.5 percent, after adjusting for QCEW data.

  • Based on both the prebenchmark CES sum of states and the U.S. CES, payroll jobs grew 1.7 percent.
  • The revised CES sum-of-states growth rate is 0.5 percent
We’ll go back to the chart above in a second, but first we wanted to show this scatter of state-level employment comparing the St Louis Fed’s more accurate early benchmarking process vs the BLS’ Prebenchmarking CES process: it found that most states’ labor data would be revised lower, in many substantially so.
Ok… but what does all of that mean in English?

Well, to make some more sense of the data, we went through the Early Benchmark state-level data excel spreadsheet provided by the Philly Fed (link), and simply added across the various states to obtain aggregate, country-level data so that we could compare the far more accurate QCEW data with what the BLS had been peddling for the past year.

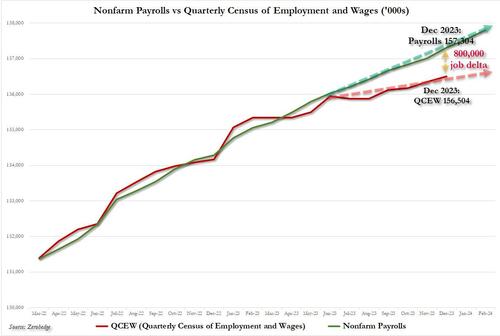
The result was – again – shocking, and as shown in the chart below, a little over a year after we, or rather the Philly Fed, found that the BLS had overstated payrolls in 2022 by 1.1 million, here we go again, only this time the BLS had overstated payrolls by 800,000 through Dec 2023 (and more if one were to extend the data series into 2024). It’s truly statistically remarkable how every time the data error is in favor of a stronger, if fake, economy.
it also means that far from the stellar 230K average monthly increase in payrolls in 2023, which the White House would spin time and again as direct evidence of the benefits of Bidenomics, the true average monthly payroll increase in 2023 was only 130K! The full monthly change in payrolls as originally reported by the BLS (in green) and the actual monthly number, as per the QCEW (in red) is shown below.
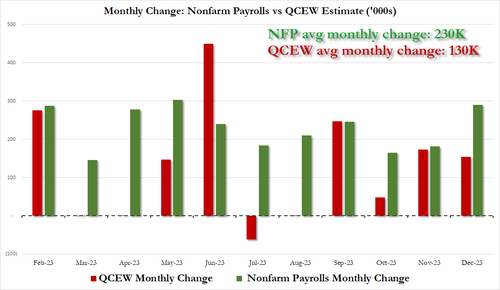
Putting it all together, we now know – as the Philly Fed reported first – that the labor market is far weaker than conventionally believed. In fact, no less than 800,000 payrolls are “missing” when one uses the far more accurate Quarterly Census of Employment and Wages data rather than the BLS’ woefully inaccurate and politically mandated payrolls “data”, and if one looks back the the monthly gains across most of 2023, one gets not 230K jobs added on average every month but rather 130K.

Of course, none of that paints Bidenomics in a flattering picture, because while one can at least pretend that issuing $1 trillion in debt every 100 days to add 3 million jos per year is somewhat acceptable, learning that that ridiculous amount buys 800,000 jobs less is hardly the endorsement that the White House needs.

Which is also why nobody in the mainstream media – which is now nothing more than the PR smokescreen for the Biden puppetmasters, the government and the deep state – will ever mention this report.

Bidenomics Reality Check! Chicago Fed’s PMI Crashes To 41.4 (Usually Found In Recessions)

Chicago Illinois used to be a shiny toy.

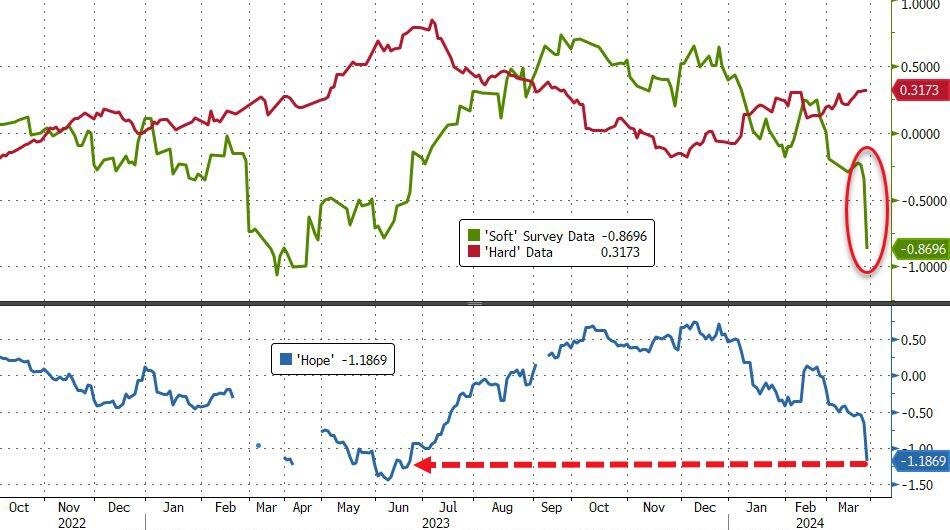
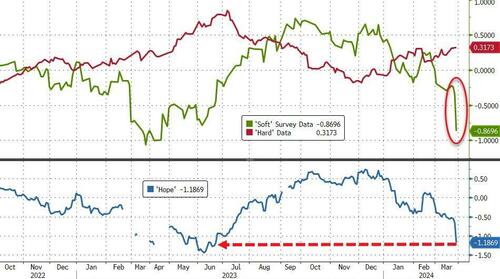
Soft’ survey data has been a bloodbath this week with regional Fed surveys all slumping and this morning’s Chicago PMI uglier than all expectations.

That smashed ‘hope’ – the spread between hard and soft data – back to cycle lows…

Source: Bloomberg

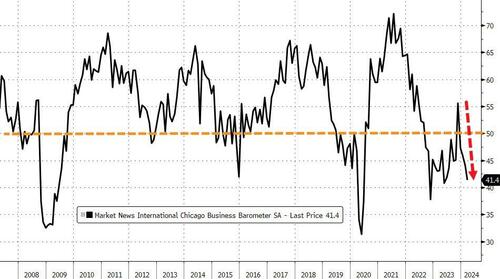
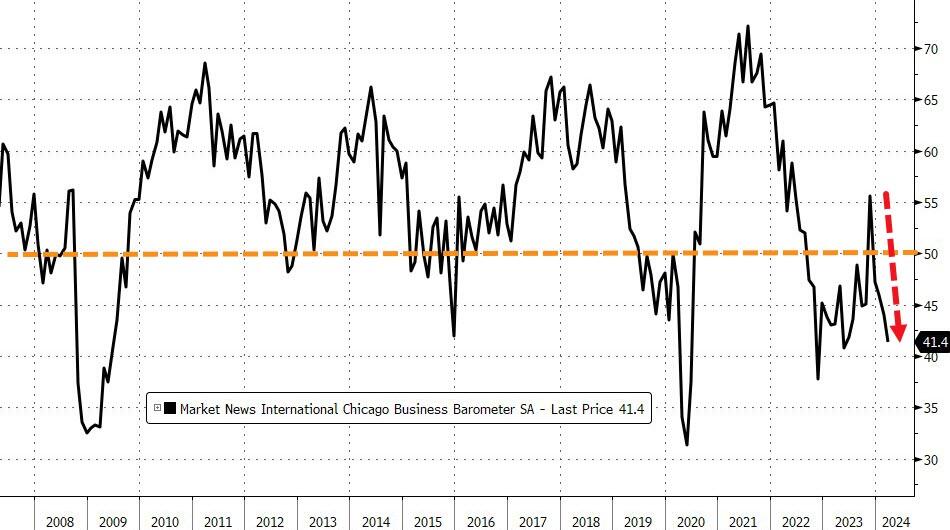
Today’s Chicago PMI plunged to 41.4 – its lowest since May 2023 – from 44.0 (and well below the expected bounce to 46.0)…

Source: Bloomberg

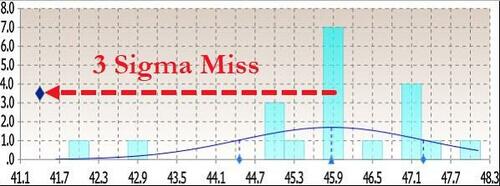
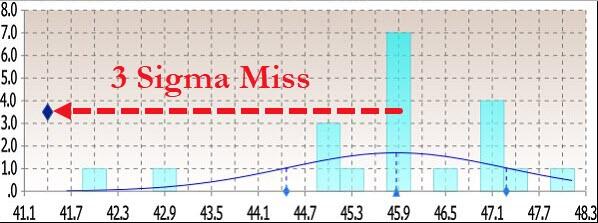
That was below all analysts expectations for the second month in a row…

Source: Bloomberg

Under the hood was even more problematic:

  • New orders fell at a faster pace; signaling contraction
  • Employment fell at a slower pace; signaling contraction
  • Inventories fell at a faster pace; signaling contraction
  • Supplier deliveries fell and a faster pace; signaling contraction
  • Production fell at a faster pace; signaling contraction
  • Order backlogs fell at a slower pace; signaling contraction

Worse still, Prices paid rose again!

So, in summary: slower growth, declining production, shrinking orders, falling employment… and accelerating inflation – is it any wonder that ‘soft survey’ data is collapsing – not exactly election-winning headlines.

Biden asking Zelenskyy for a loan so he can fix the bridge….

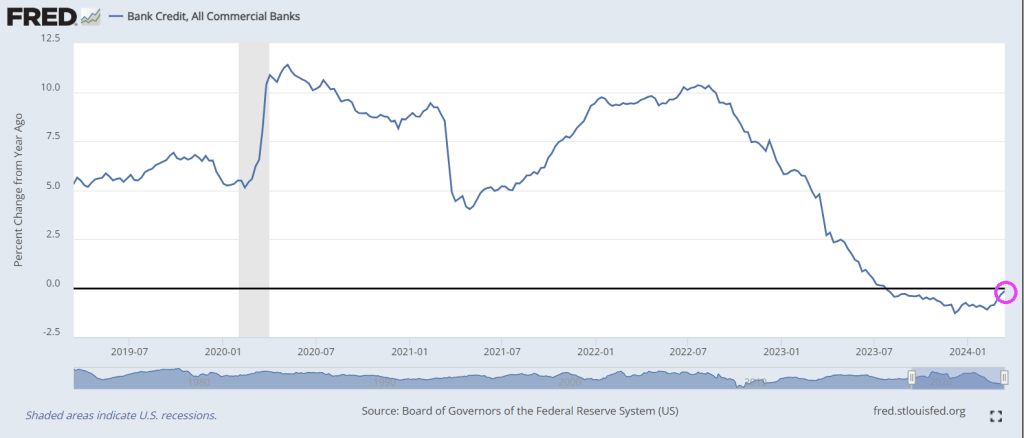
Fear The Talking Fed! Fed Loses $114.3 Billion In 2023 (Bank Credit Growth At Just -0.1% YoY)

As The Federal Reserve continues to support bad Bidenomics policies, they … like millions of Americans … are suffering catestrophic losses.

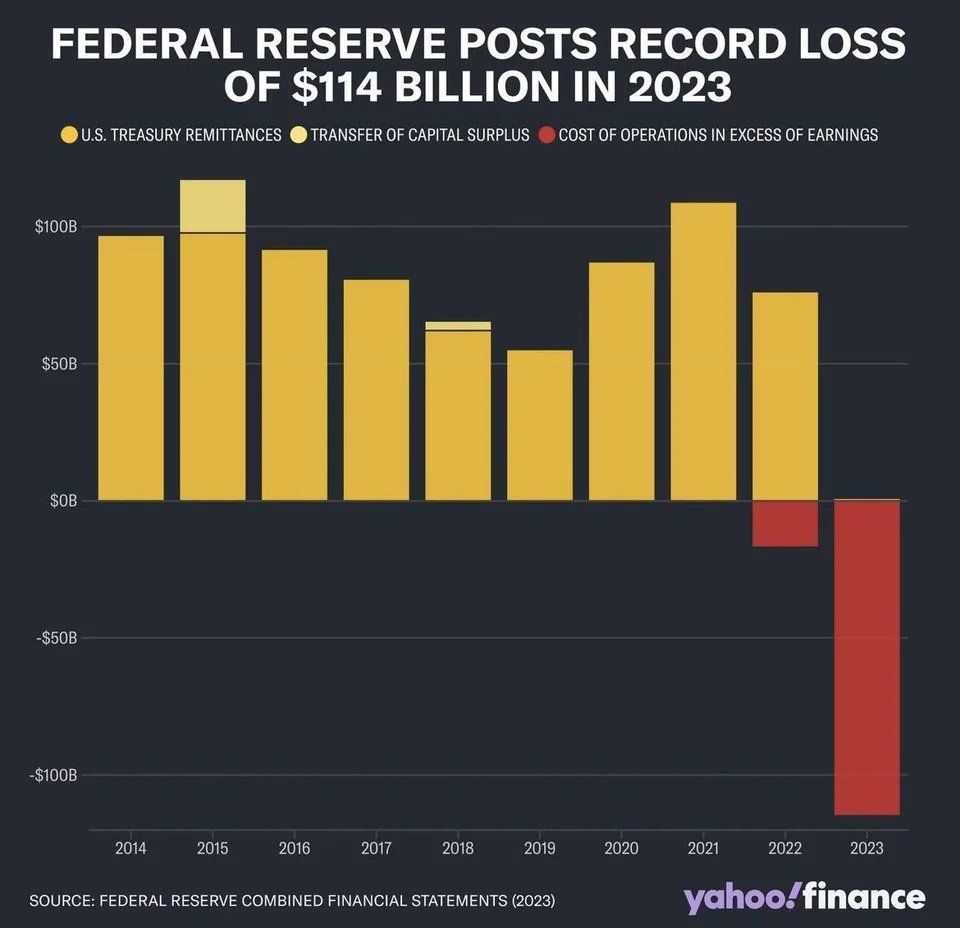
The #Fed said on Tuesday that it officially saw a net negative income of $114.3 billion in 2023, a record loss tied to expenses related to managing the U.S. central bank’s short-term interest rate target. The loss last year follows $58.8 billion in net income in 2022, the Fed said.
The good news? Bank credit growth is ALMOST back to 0%!

I wonder if KJP or Jared Bernstein will tout almost 0% credit growth as a sign that economists were wrong about Bidenomics?

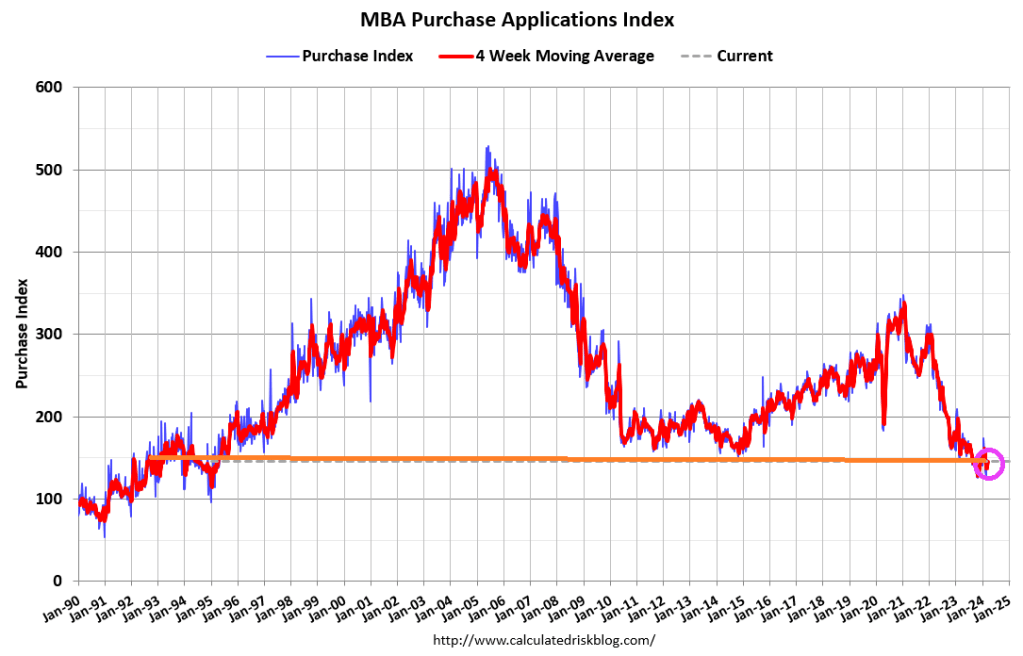
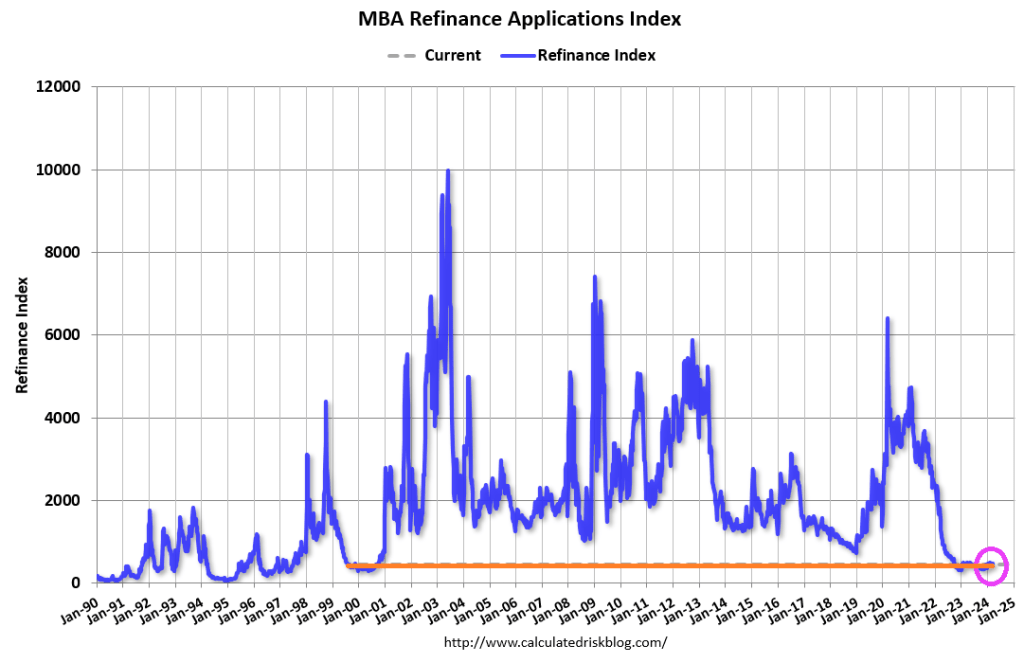
Bidenomics, The Key Bridge Collapse And The Collapsing US Mortgage Market (Mortgage Applications Collapse By 16% From Last Year)

The cargo ship craashing into and collapsing the Key bridge in Baltimore is emblematic of Bidenomics: an ongoing wreck. And the mortgage market is the Key bridge collapse over a longer period. Specifically, from the start of Biden’s Regime in 2021.

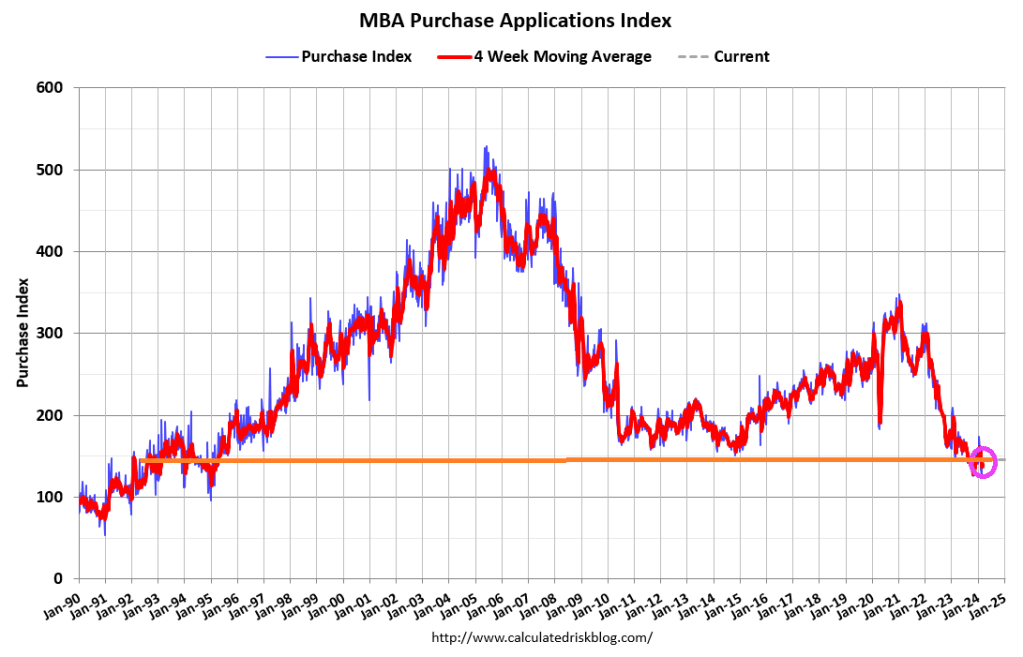
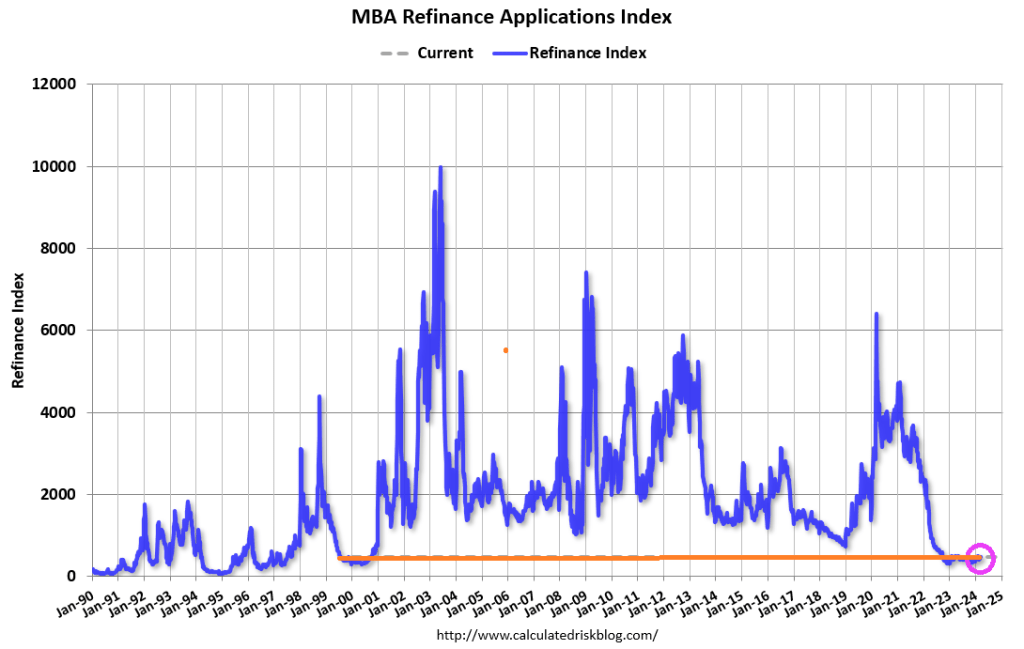
Mortgage applications decreased 0.7 percent from one week earlier, according to data from the Mortgage Bankers Association’s (MBA) Weekly Mortgage Applications Survey for the week ending March 22, 2024.

The Market Composite Index, a measure of mortgage loan application volume, decreased 0.7 percent on a seasonally adjusted basis from one week earlier. On an unadjusted basis, the Index decreased 0.4 percent compared with the previous week. The seasonally adjusted Purchase Index decreased 0.2 percent from one week earlier. The unadjusted Purchase Index increased 0.2 percent compared with the previous week and was 16 percent lower than the same week one year ago.

The Refinance Index decreased 2 percent from the previous week and was 9 percent lower than the same week one year ago.

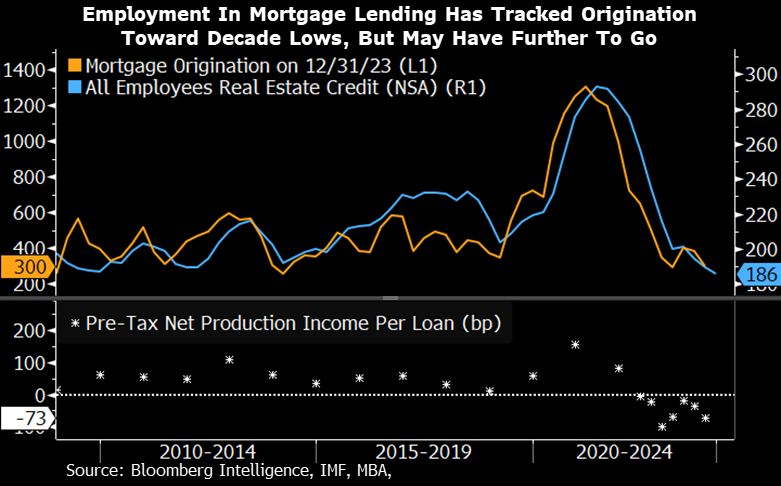
Employment in mortgage lending has shrunk along with collapsing mortgage originations under Biden.

Hey Big Spenders! Broken Money And Neverending Inflation (Inflation STILL At 18%)

Face it. The Federal government is broken. Congress and the Biden Administration are addicted to spending money and running up massive debts. There is no attempt at fiscal restraint because they will always argue that “More money must be spent!” On what exactly? Usually pet projects (aka, pork) like the LGBTQ retirement home in Boston for $850 thousand and $15 million for Egyptian college tuition.

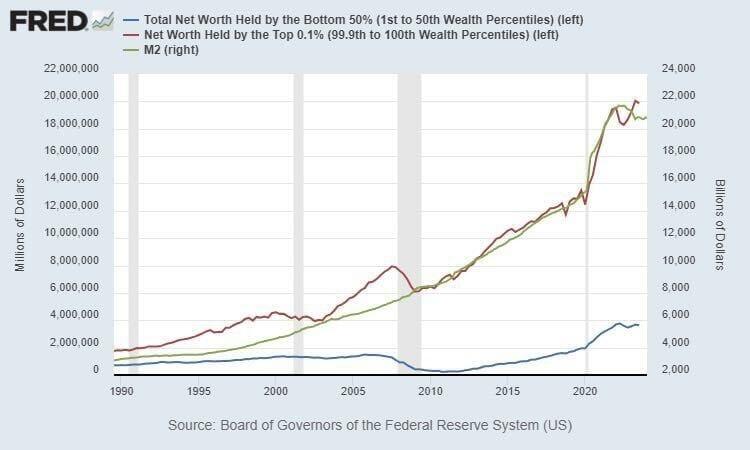
How does “broken money” work? Badly. Without any fiscal restraint, politicians can just give away thousands/millions of dollars to the donor class (donate $1, get $1,000 in return). As you can see, the net worth of the top 0.1% has exploded with each ensuing “crisis.” There was the 2008/2009 financial crisis and the 2008 Covid crisis. With each crisis, the top 0.1% get richer and richer. You will note that net worth for the top 0.1% is closely related to M2 Money printing. Like, who gets the money printed by Uncle Spam? The 0.1%, of course!

Broken money leads people to store their value in sub optimal vehicles like housing. This drives the cost of real estate up unnaturally and increases the gap between the “haves” and the “have nots”. Sowing seeds of animosity. Seeds that, when left to germinate and grow via the further degradation of the money people use, blossom into ugly flowers of Anarcho Tyranny.

This has manifested in the trend of people claiming other’s houses by squatting in them when they are left unattended for an extended period of time. The preferential treatment that has been given to squatters over homeowners in recent years can be seen as the regime which controls the money printers throwing the plebs a bone as they struggle to get by, an attempt to push the productive class to violence against a state unwilling to respect private property rights, or a combination of the two.

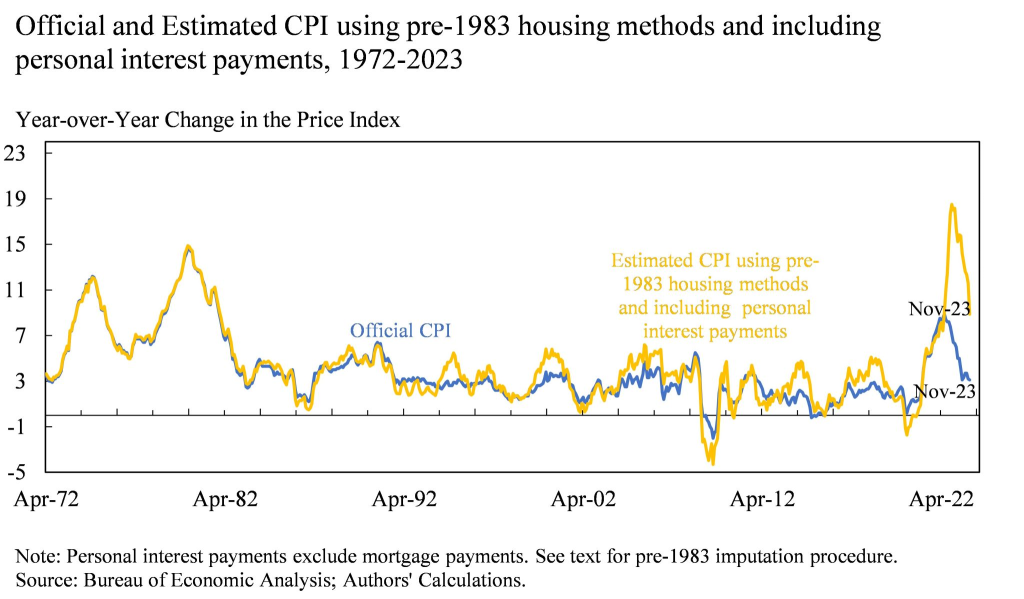
Look at inflation if we use pre-1983 methods. Inflation is still roaring at 18%!

Broken money incentivizes governments to allow their borders to be bum rushed by cheap laborers who will take low paying jobs that enable the systemically fragile economy to keep chugging along while simultaneously increasing the chaos that already exists and diluting the values that the natives of this country believe in.

The excess and decadence enabled by a world run on broken easy money allows people to live in a detached reality that leads them to push objectively false narratives. This is why there are running debates about gender and a retreat from merit based compensation.

All of this stems from broken money.

The chart above should act as a reminder to you all that the biggest problem in the world right now is the money. The chart above should also prove to you that the most powerful people throughout the economy are going to fight tooth and nail to protect the broken money because they benefit massively from the fact that it is broken.

Keep this in mind as the chaos increases and narratives begin to form around using bitcoin as money. But we will never see inflation “normalizing” as long as Congress and Biden keep spending money.

Here are 3 of the BIG SPENDERS, Obama, Biden and Insider trader pro Pelosi. Do any of them look like the care about the bottom 50% of net worth or inflation??

Biden, Schumer Fund Border Defense In Spending Bill! Jordan, Lebanon, Egypt, Tunisia and Oman Get Border Funding, NOT The US (US Falls To 23rd In Global Happiness Ranking)

Biden loves to blame Republicans for the border crisis. Although he has it in his power to close and secure the border, but won’t. It’s easier to blame the opposition, like “extreme MAGA Republicans.” Huh, I didn’t realize that as a conservative American I am considered extreme by the Biden Administration.

Unfortunately, Biden, Schumer and Johnson only provided financial support for Jordan, Lebanon, Egypt, Tunisia and Oman. In the form of $380 million.

As the US falls to 23rd in World Happiness ranking. Based, in part, on Biden’s idiotic open borders policy.

Pork Barrell Chuck And Gaslight Joe! $60 Million For Ukraine, $0 For US Border Disaster (Purchasing Power Of Dollar Down -16% Under Biden)

Its Pork Barrell Chuck Schumer and Gaslight Joe Biden! Always ready to lie (gaslight) and spend trillions that we don’t have.

A new $1.2 trillion government spending package Congress is trying to ram through faces significant headwinds in the House, where members are expected to vote on it later this morning.

The 1,012-page bill was introduced at around 3am Thursday morning – just 48 hours before a midnight Friday funding deadline. It must pass both the House and the Senate, after which President Biden will sign it (with crayons at the ready, we’re sure).

The package accounts for approximately 70% of discretionary government spending – and consists of six out of twelve total bills that Congress must pass each fiscal year to fund the government. The six others, around $460 billion in spending, were passed earlier this month.

According to Fox News, multiple GOP sources, two GOP lawmakers and one senior GOP aide think the package will pass, but by a tight margin.

On Thursday afternoon, however, the bipartisan deal hit turbulence – with one GOP lawmaker citing absurd pork contained within – including funding for LGBTQ centers and facilities that provide late-term abortions.

Pork City

As usual, Democrats slipped in as much pork as possible, including:– $850k for a gay senior home- $15 million to pay for Egyptian’s college tuitions- $400k for a gay activist group to teach elementary kids about being trans- $500k for a DEI zoo- $400k for a group to gives clothes to teens to help them hide their gender

$60,000,000,000 for Ukraine (of course). NOTHING for US border.

$1,140,000,000,0000 for pork barrelling

1.2 trillion in inflation, an increase of the money supply by 2% in a single spending bill.

The US Dollar’s purchasing power is down -16% under Gaslight Joe.


Existing Home Sales Prices Explode In February (Median Selling Price Rose 5.7% to $384,500 From Last Year, Highest For Any February Back To 1999)

February’s existing home sales are like a scoop of cottage cheese. Seemingly satisfying until you look more closely at the data (or get hungry 30 minutes later).

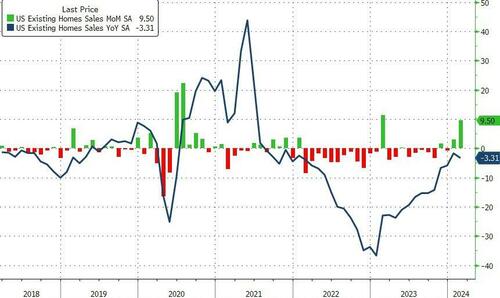
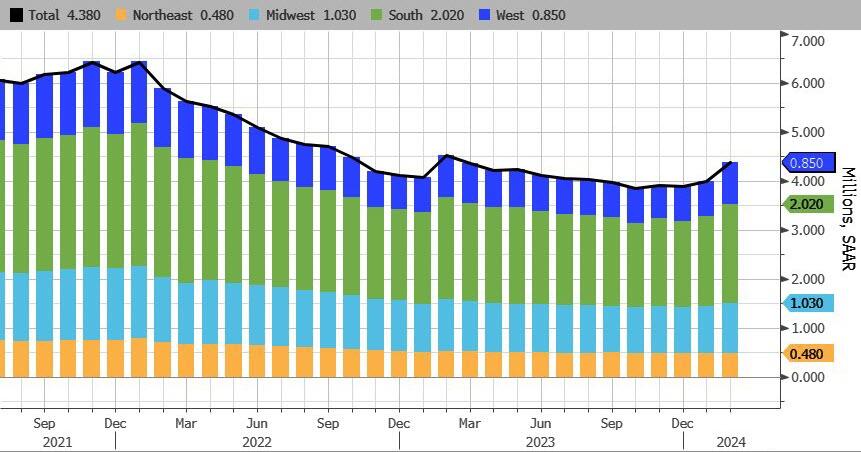
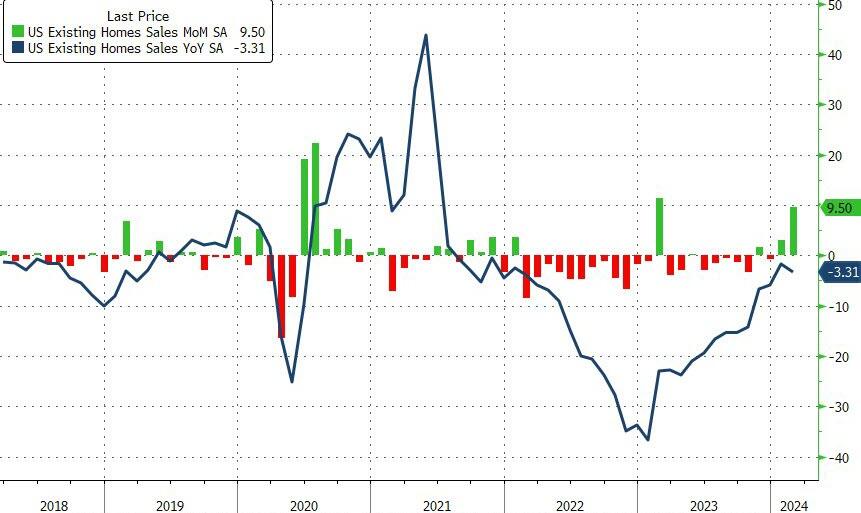
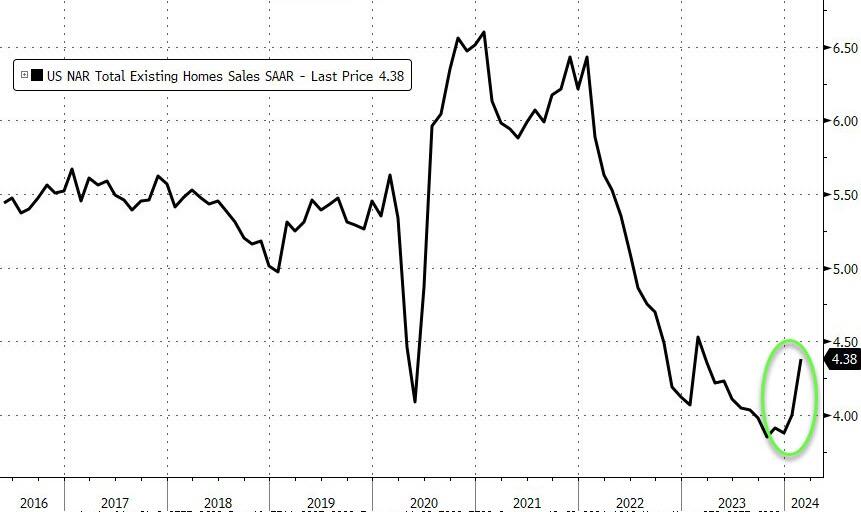
Existing home sales soared a stunning 9.5% MoM in February, smashing the expectation of a 1.3% decline and building on the 3.1% MoM in January. However, even with the big monthly jump, existing home sales remain down 3.3% YoY…

Source: Bloomberg

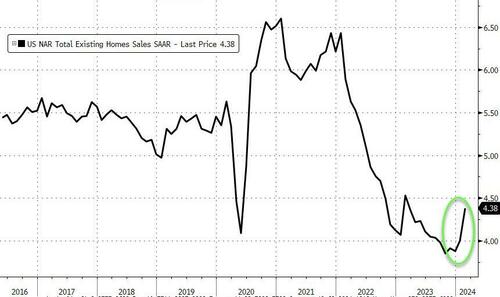
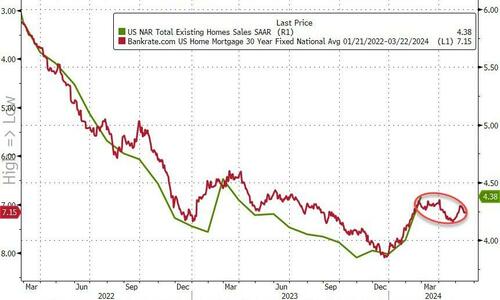
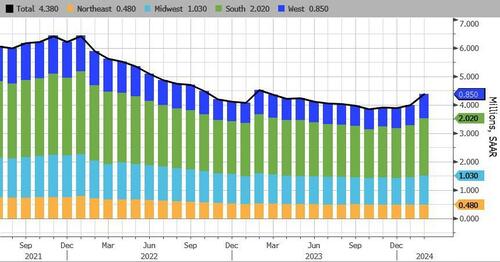
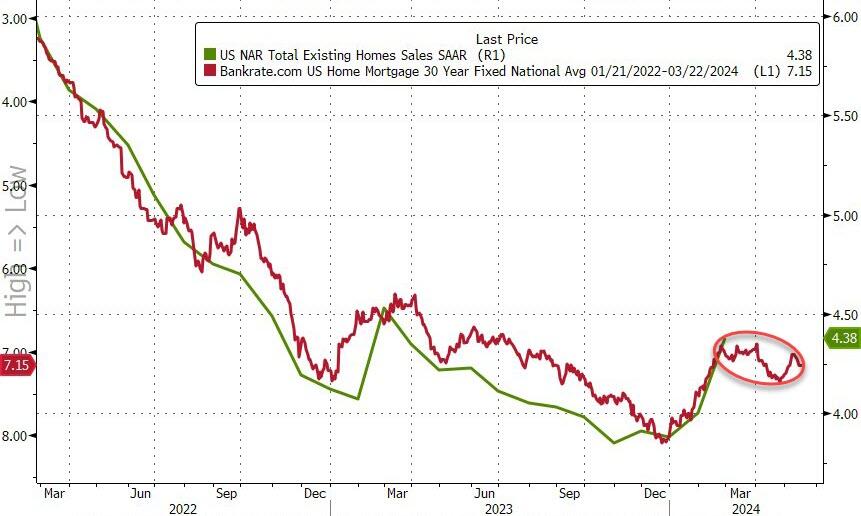
Total existing home sales SAAR surged to 4.38mm – a 12 month high…

Source: Bloomberg

Homeowners may be accepting that mortgage rates are settling into a new normal and can’t delay moving any longer, NAR Chief Economist Lawrence Yun said on a call with reporters.

“Additional housing supply is helping to satisfy market demand,” Yun said in a statement.

“Housing demand has been on a steady rise due to population and job growth, though the actual timing of purchases will be determined by prevailing mortgage rates and wider inventory choices.”

With a 2-month lag, we can see why existing home sales may have risen, but with mortgage rates rising since then, we suspect the fun and games may come to an end again soon (even if the NAR economist thinks otherwise)…

The number of previously owned homes for sale climbed to about 1.07 million last month, and Yun said he expects that will continue to go up. At the current sales pace, selling all the properties on the market would take 2.9 months, the lowest in about a year.

Realtors see anything below five months of supply as indicative of a tight market.

Even with greater inventory, strong demand put upward pressure on prices. The median selling price advanced 5.7% to $384,500 from a year ago, the highest for any February in data back to 1999.

Sales rose in three of four regions, led by a 16.4% surge in the West

First-time buyers made up 26% of purchases in February, matching the lowest on record.

Biden’s War On Gas Cars Will Cost Americans A Fortune, 5-year Cost To Own An Electric Vehicle Exceeds $92,000 (Too Expensive, Only 73% Of Chargers In Working Order)

Biden continues to try to force Americans to buy electric cars and support China’s EV and battery industries! And are EVs ever expensive!

The Environmental Protection Agency released what it calls the “strongest-ever pollution standards for cars,” which it claims will “expand consumer choice in clean vehicles.”

That’s a stretch: These new regulations, which are clearly beyond EPA’s defined powers, will limit overall vehicle choice and force Americans into expensive and unreliable electric vehicles.

The EPA expects plug-in electric vehicles to make up between 62% and 70% of the automotive market. But this unrealistic target ignores two key facts:

First, consumers are not lining up to purchase electric vehicles, which made up only 7.6% of 2023 vehicle sales despite heavy subsidies.

American drivers simply aren’t embracing EVs because they know these vehicles have shorter driving ranges and longer refueling times. Not to mention that they’re significantly more expensive.

The five-year cost to own an average electric vehicle is more than $92,000, according to the North American Auto Dealers Association. Compare that to a typical gas-powered vehicle, which over the same period costs $76,500.

Second, readily available charging infrastructure remains elusive for many EV users.

Many of the available chargers are level 2, which the magazine U.S. News notes “is fine if you have time to kill.”

Repair issues compound even the limited levels of charging, as only 73% of chargers in some major centers are in working order, according to Autoweek.

In the face of rapid decreases in the growth of electric vehicle sales, automakers are already scaling back EV production plans.

In December, Ford announced it was cutting planned production of its F-150 Lightning pickup in half due to “changing market demand.”

The Mackinac Center for Public Policy has warned automobile manufacturers for years that leaving consumers out of their long-term business plans was a recipe for failure.

Taxpayers not only pay with more expensive cars, they have to subsidize new production facilities.

In Michigan, lawmakers have already promised $200 million dollars of taxpayer money — and that’s just for one Ford battery plant in Marshall.

Notice that Biden has his right hand mysterioulsy over the cup holders where the transmission shifter would be on his gas-guzzling Corvette. When Biden drives a Nissan Leaf and sells his Corvette, I will almost believe Biden. No, he lies so much I can’t believe anything you see.

Mortgage Woes Continue! Purchase Applications (Demand) Now Down 14% From Last Year

The woes for the mortgage market continue under President Magoo.

Mortgage applications decreased 1.6 percent from one week earlier, according to data from the Mortgage Bankers Association’s (MBA) Weekly Mortgage Applications Survey for the week ending March 15, 2024.

The Market Composite Index, a measure of mortgage loan application volume, decreased 1.6 percent on a seasonally adjusted basis from one week earlier. On an unadjusted basis, the Index decreased 1 percent compared with the previous week. The seasonally adjusted Purchase Index decreased 1 percent from one week earlier. The unadjusted Purchase Index decreased 1 percent compared with the previous week and was 14 percent lower than the same week one year ago.

The Refinance Index decreased 3 percent from the previous week and was 3 percent lower than the same week one year ago.

Between The Fed’s announcement of rate changes and The Biden Crime hearings in DC (where Hunter of course failed to appear), there is plenty to keep us occupied.