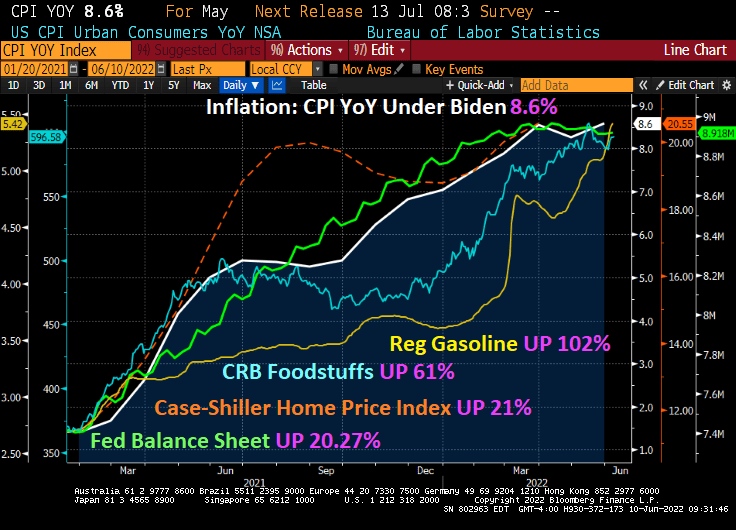
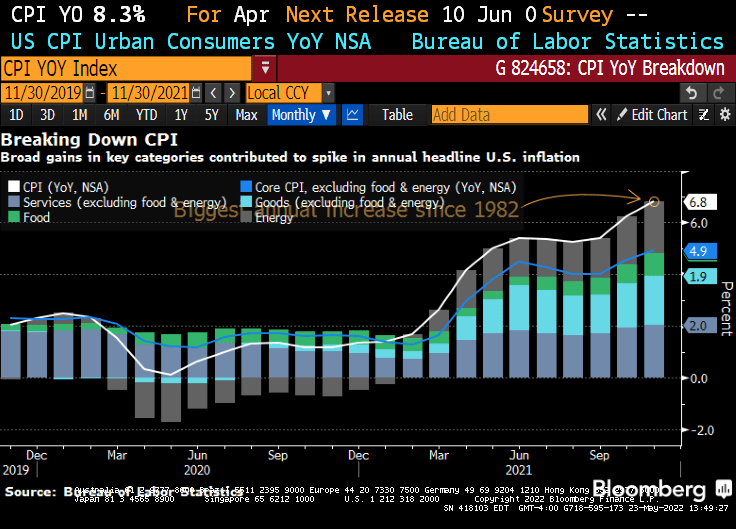
Inflation, the bane of the middle class and working families, just rose to 8.6%.
Core inflation, that excludes energy and food, actually declined slightly to 6% from 6.2% in April. But since most families are concerned with gas prices and food, (not to mention home prices growing at 21.17% YoY), core inflation really underestimates the suffering.
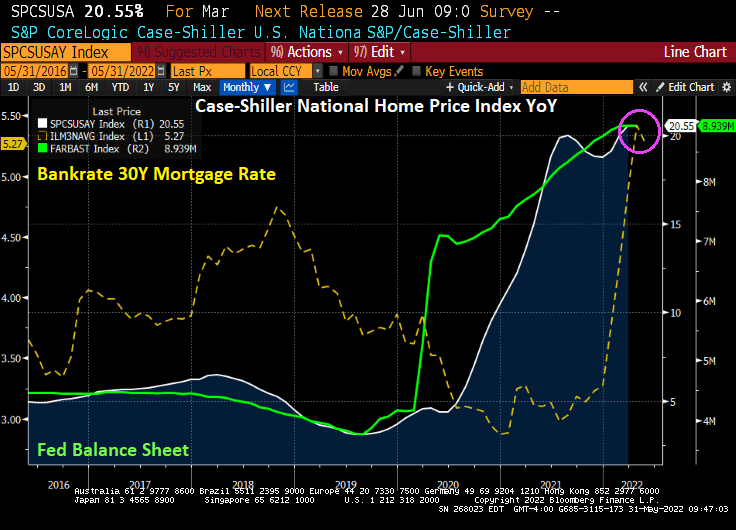
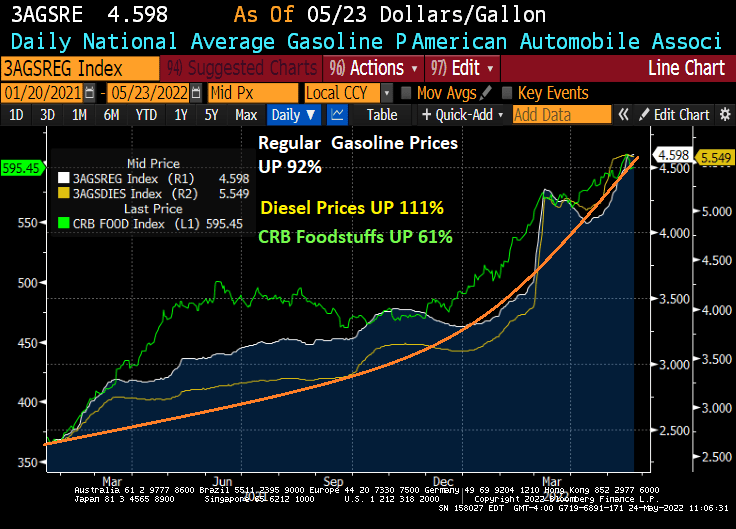
Under Biden’s leadership in cooperation with eternal Fed stimulus (until now), inflation started at 1.4% YoY and has increased to 8.6% YoY. The Fed’s balance sheet has increased by 20.27% (more monetary Stimulypto!), Case-Shiller home prices started at 10.44% YoY and has now doubled to 20.55% YoY. Regular gasoline started at $2.57 and is now at $5.42, up 102%. Food is up 61%.
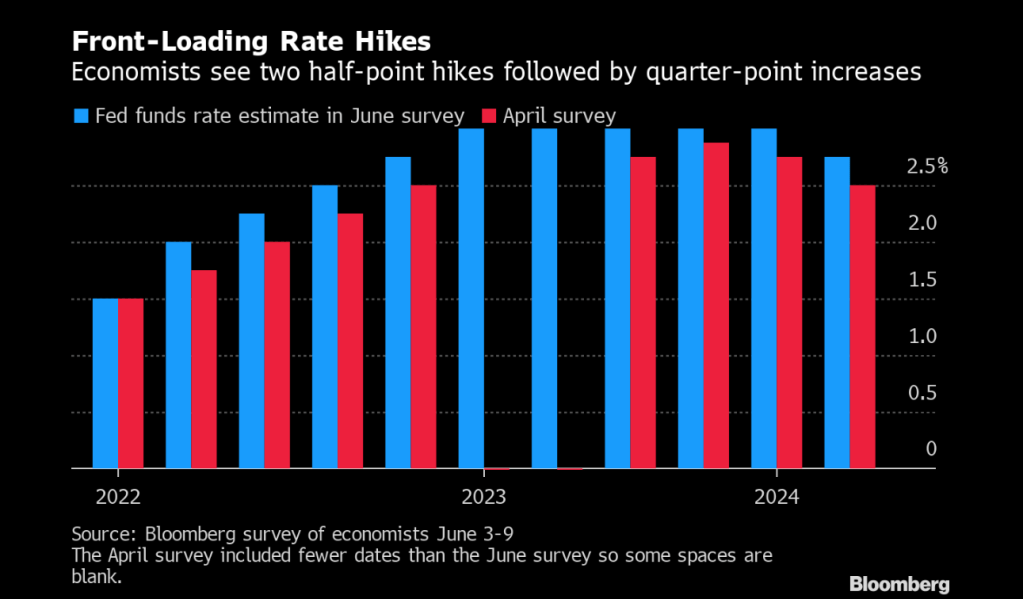
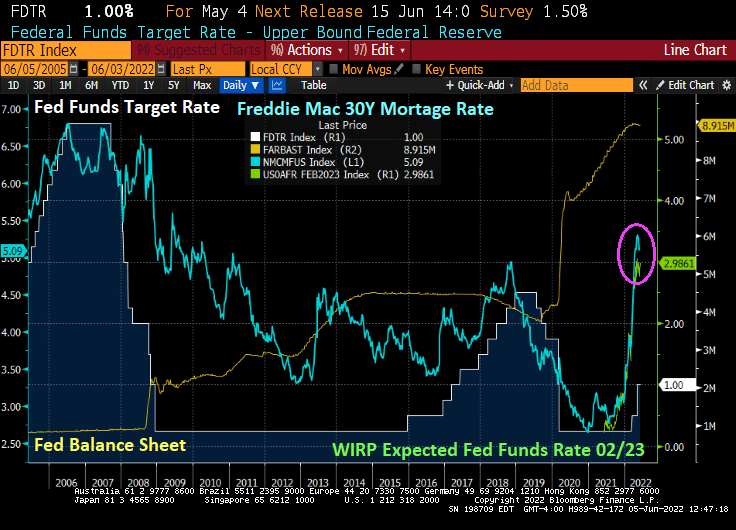
The Fed is expecting two half-point hikes followed by quarter-point increases.
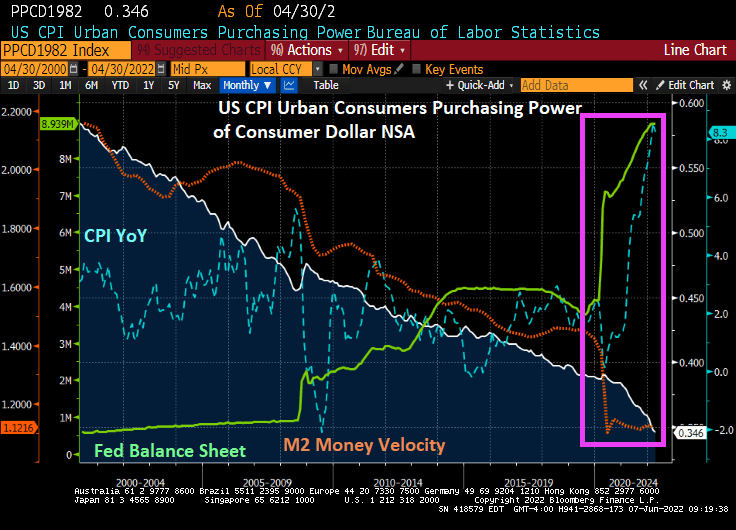
Here is my version of their chart since 2000 where you can seen the seismic shift in the balance sheet (toxic green slime line), particularly with The Fed’s response to Covid. The Fed is signaling a tightening in monetary policy to help reduce inflation (blue line).
But notice that M2 Money Velocity (GDP/M2) is now near the all-time low along with consumer purchasing power.
How BIG is The Fed’s balance sheet? Try more that a third of size of US GDP.
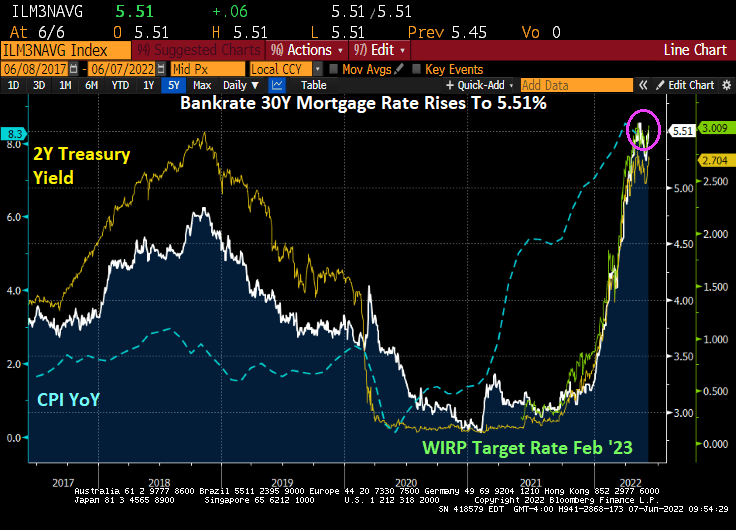
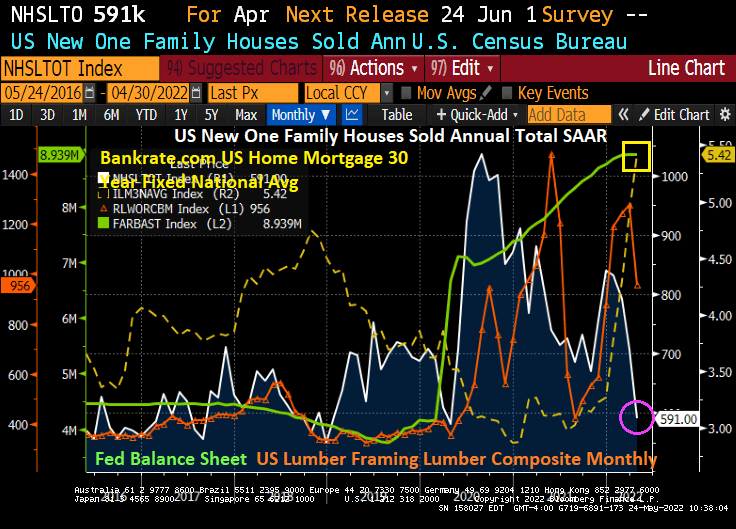
And as The Fed signals its inflation-fighting intentions, mortgage rates have shot up to 5.51%, the highest mortgage rate since June 2009.
Meaning that The Fed has kept monetary stimulus in play for too long since late 2008 helping to lower mortgage rates from over 6% in November 2008 to 2.98% in November 2021. Then came “The Missouri Boat Ride” as The Fed signaled monetary tightening, leading to mortgage rates skyrocketing to their highest level since 2010.
The result of rising home prices AND mortgage rates? Housing acquisition prices (home prices * 30 year mortgage rates) have skyrocketed.
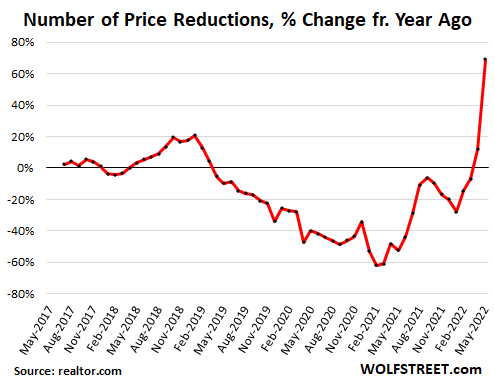
Between rising home prices and rising mortgage rates, we see that number of prices reductions increasing at nearly 70% YoY (chart courtesy of WolfStreet.com).
Of course, Congress and the media will never ask Janet Yellen (former Fed Chair [2013-2018] and current Treasury Secretary) WHY she kept massive monetary stimulus around for so long. Or why current Fed chair Powell did the same with Covid-related monetary stimulus.
Earlier today, we saw that the Case-Shiller National home price index in March rose to its fastest rate in history.
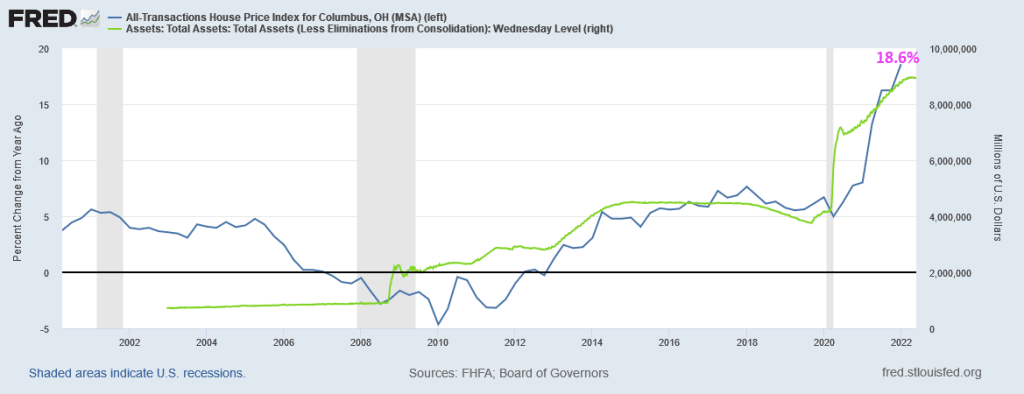
Columbus Ohio is not covered by Case-Shiller in their 20-city index, but the FHFA’s home price index does. And in Q1 2022, home prices grew at a 18.6% YoY clip.
The Federal Reserve has been signaling a tightening of its loose monetary policy (essentially loose since the housing bubble burst of 2008 and the ensuing financial crisis). It is still loose as The Fed hasn’t really trimmed its massive balance sheet yet and has just raised it target rate to 1%.
So, potential home owners have to pay 5.10% for a 30-year fixed-rate mortgage while the effective Fed Funds rate, the rate at which banks lend to each other, is a measly 0.83%. This puts consumers at a relative disadvantage to large Wall Street firms that are gobbling up houses at an accelerated rate.
With the US housing market slowing (thanks to The Fed’s signaling of monetary tightening), the question now is how far will The Fed go in its “War on Inflation!”?
You can see a major cause of inflation in the US since 2000: Federal spending and Federal (public) debt. During The Great Recession of 2008-2009, we saw inflation (CPI YoY) collapse into negative territory as Federal spending and debt soared. But the mini-recession of 2020 caused by the Covid governments shutdowns led to TWO surges in Federal spending and debt: Covid relief followed by the infrastructure spending bill. Combined with Biden’s anti-fossil fuel executive orders and massive splash of Federal spending in to the economy, we have inflation soaring.
If surges in Federal spending (requiring surges in Federal debt) have gone away (except for $40 billion in Ukrainian relief and Biden’s possible student loan cancellation of $10,000 that will cost an estimated $321 billion … and help drive up college tuitions even further), we may be over the “twin gorgings” of the Covid spending spree. This alone may result is a decline in the inflation rate.
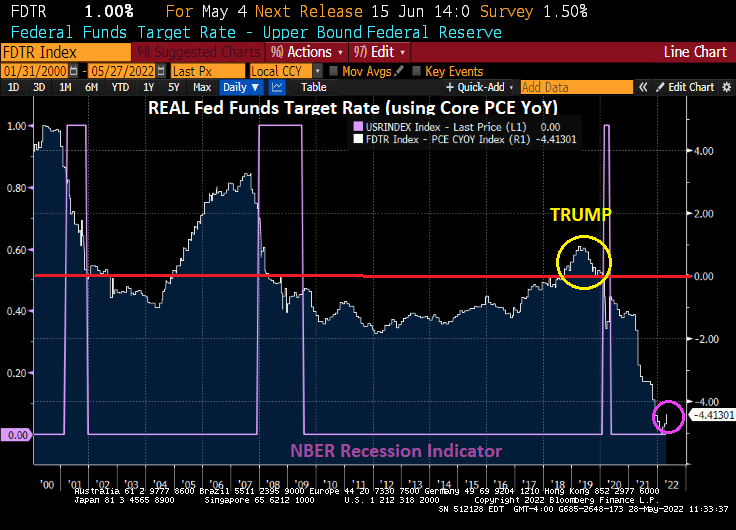
Where do we sit today with the REAL neutral rate? The REAL Fed Funds Target Rate (upper bound) is -4.41%. It was in positive territory during the Trump years. But then Covid struck.
No wonder Wall Streeters like to go “Down To The Nightclub!” The Fed still has not taken the monetary stimulypto away, but have taken it away for consumers buying housing.
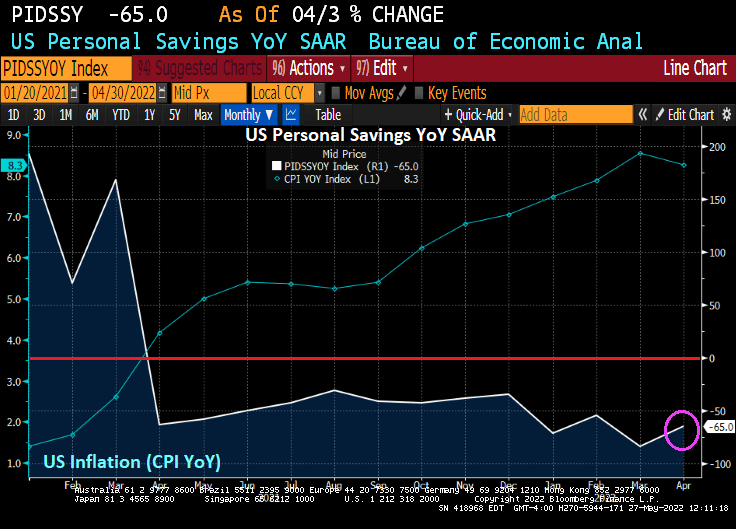
Americans’ Savings Rate Drops to Lowest Since 2008 as Inflation Bites.
Yes, inflation really bites. In fact, as US inflation is near the 40-year high, US personal savings declined -65% YoY as consumers try to cope with rising prices.
Its not only that personal savings is crashing in the face of inflation, revolving debt has soared as consumers try to cope with rising prices. I call this chart “The Biden Bowl.” Soaring consumer credit card debt with crashing personal savings.
US pending homes sales in April tanked -11.5% YoY and down -3.9% MoM which was greater than expected.
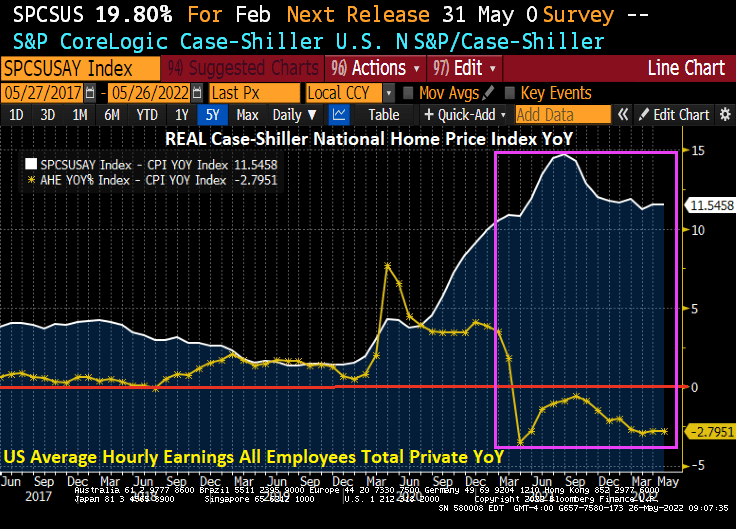
Not really surprising when you see that REAL home prices are growing at an 11.55% YoY clip while REAL hourly earnings are declining at a -2.8% YoY pace.
Do you feel like I do with Bidenflation crushing my check book and The Fed crushing my hopes for an affordable home.
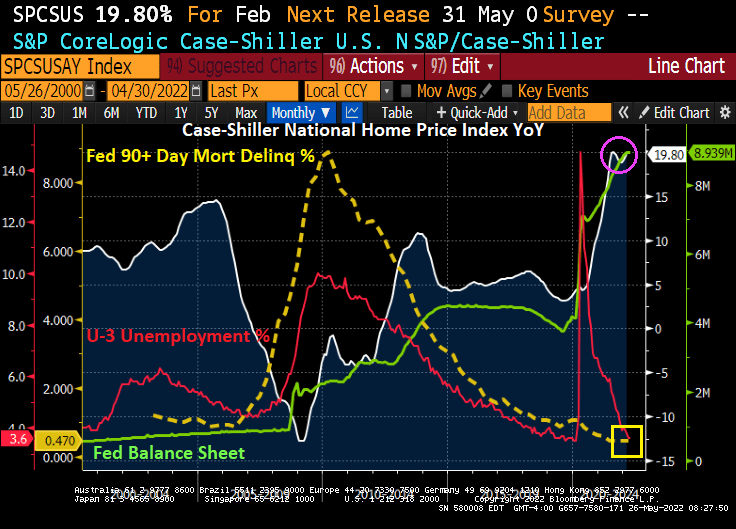
If we look at 90+ days late for mortgages (yellow line), we see that the surge in unemployment with the Covid outbreak and subsequent government shutdowns (red line) did not lead to a surge in mortgage foreclosures.
This situation is quite unlike 2008 when collapsing home prices and the subsequent surge in the unemployment rate led to a 90+ days late surge on mortgages (yellow line).
Difference between today and 2008? The Federal Reserve’s asset purchase (green line) surge happened twice AFTER the 2008 housing crash. Once in late 2008 through 2014, then a second, bigger surge in March 2020 after the Covid outbreak. One big difference is the surge in home prices, home price growth was 3.69% YoY in December 2019 and skyrocketed to 19.80% as of February 2022. This translates to a massive increase in homeowner equity, leading to a lower probability of default.
So, there you go. Powell and The Federal Reserve made housing unaffordable for millions of Americans, but The Fed did help thwart another mortgage default crisis. BUT we will see what happens with future rate hikes from The Fed.
Here is Attom’s US Foreclosure Starts chart. Yes, that is hardly a surge, although foreclosure starts did rise in Q1 2022.
So, The Fed has helped make housing simply unaffordable. Look at the growth of REAL home prices relative to REAL average hourly earnings.
I have never seen two Federal entities make such a mess in my life. The Federal Reserve and The Federal government.
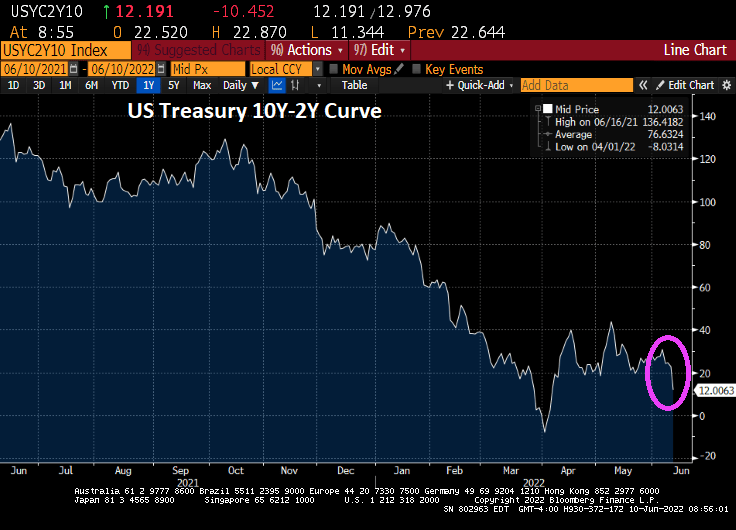
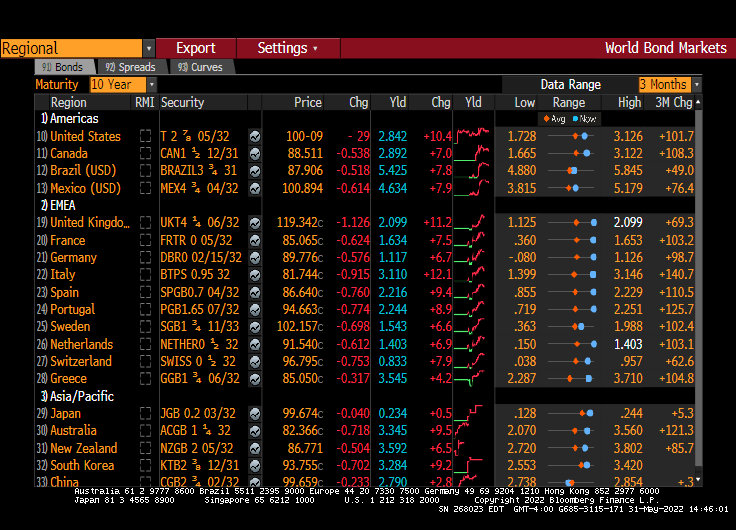
The good news? The 10-year Treasury yield is down -12.9 BPS this morning generally resulting in lower 30-year mortgage rates. Of course, the reason why the 10-yield is falling is generally bad news.
The bad news? US New Home Sales fell -16.6% MoM in April as mortgage rates skyrocketed.
Since the installation of Joe Biden as President, new home sales have plunged -31.2%, mortgage rates are up 88.9%, and framing lumber prices are up 29.2%.
Biden is out there bragging about rising energy prices which he views as a necessity to force the conversion of America to electric cars and trucks. Biden is the first President in history to gloat over the suffering of American households.
Under Biden, regular gasoline prices are up 92%, diesel prices are up 111%, and CRB Foodstuffs are up 61%.
Say, framing lumber for housing is cheaper than food. Maybe Biden will suggest Americans transform to being beavers and gnaw on wood.
As The Federal Reserve tries to fight inflation (it can’t thanks to Federal energy policies and bottlenecks), it is causing a disconnect between mortgage current coupon rate and the MBS index coupon. The disconnect is so bad that it is back to 1985 levels.
The Fed can certainly try to cool inflation, but Biden is intent on raising energy prices (leading to food price increases, and everything else) to shift us to electric cars. So, Biden is unlikely to back off.
So, The Fed is left trying to fight a war against inflation that only Biden can fight.
Meanwhile, the US mortgage market is getting pulverized


You must be logged in to post a comment.