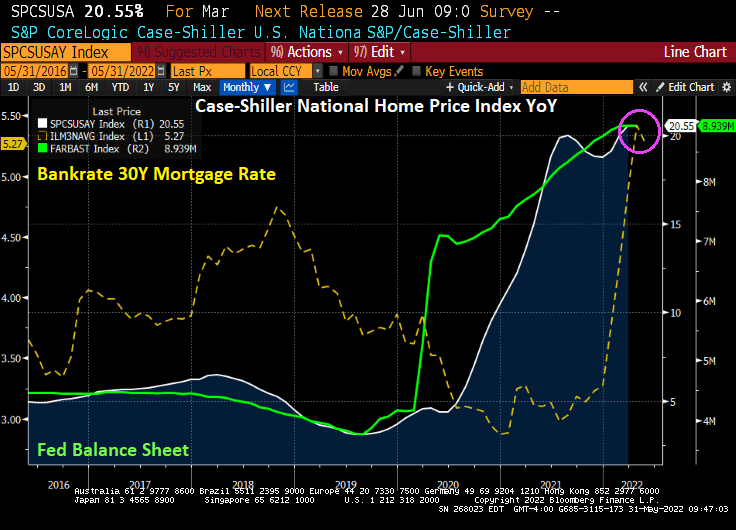
US home prices are still skyrocketing as The Federal Reserve kept its massive foot on the monetary accelerator pedal.
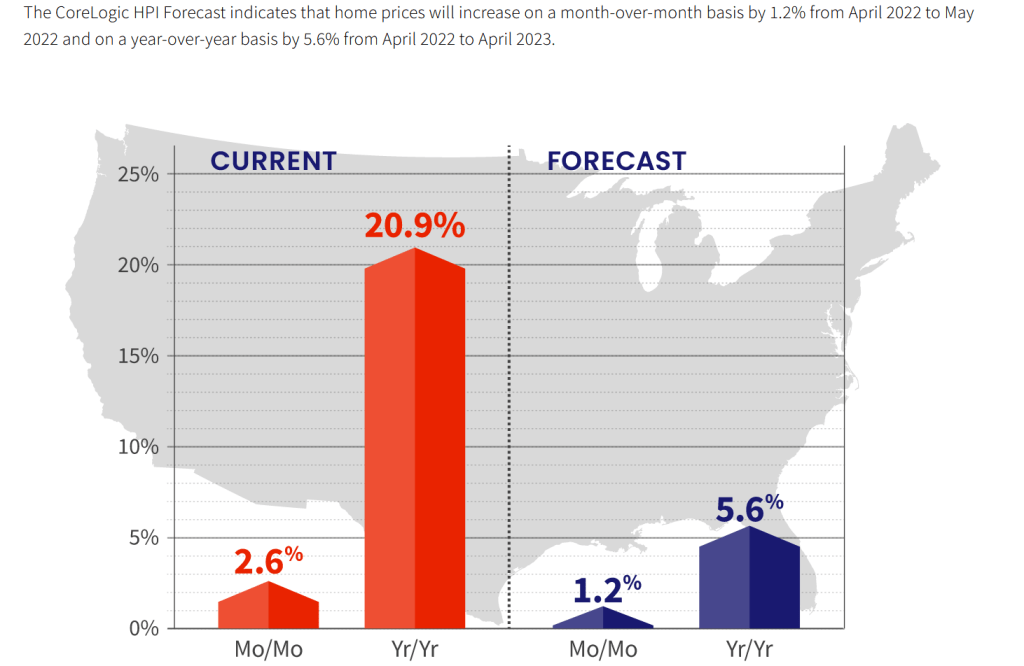
CoreLogic’s home price index grew at a 20.9% YoY pace in April, but is expected to slow to 5.6% YoY in late 2022.
Remember peeps, The Fed still have its staggering monetary stimulypto in place.
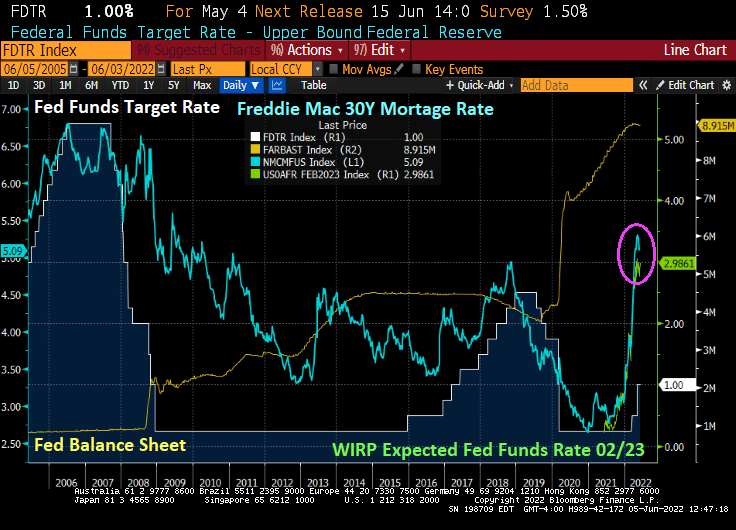
The Fed is signaling its withdrawal of stimulus, causing mortgage rates to soar.
Given the slowdown of the US and global economy, we shall see if The Fed keeps to its tightening plans. As of today, the market is expecting The Fed to raise its target rate from 1% to 3.819% by February 2023. That is a 291% increase in The Fed’s target rate.ng
The Fed trying to tame inflation (caused by The Fed and Biden’s energy policies and Congressional spending) is like Curly trying to eat oyster stew.
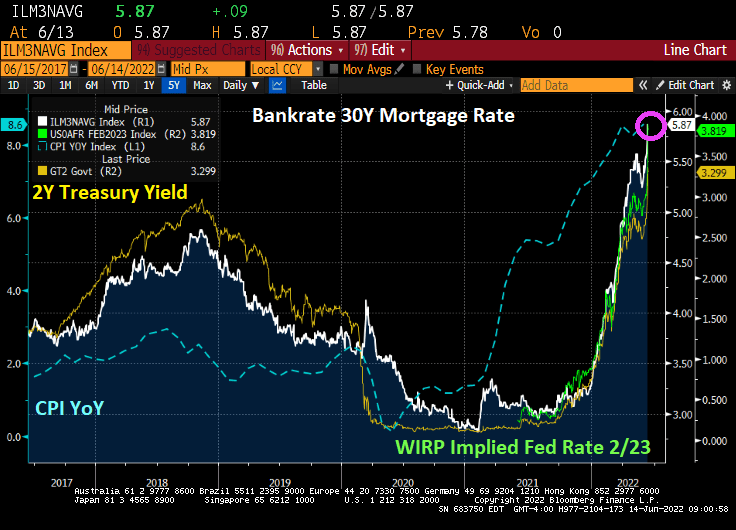
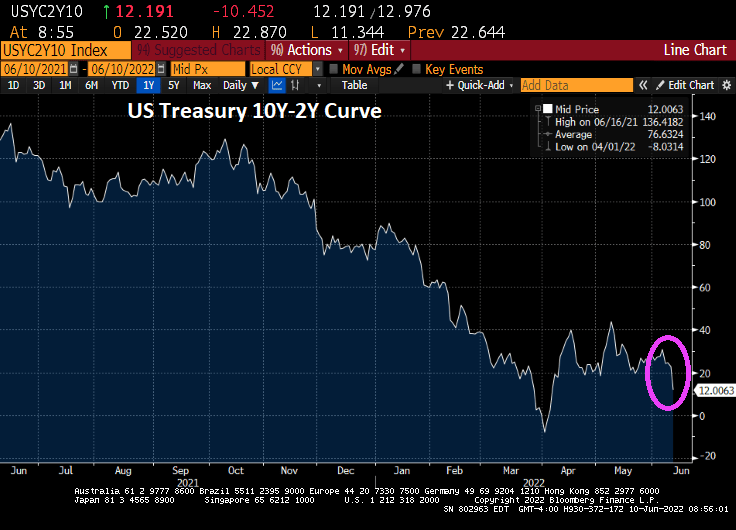
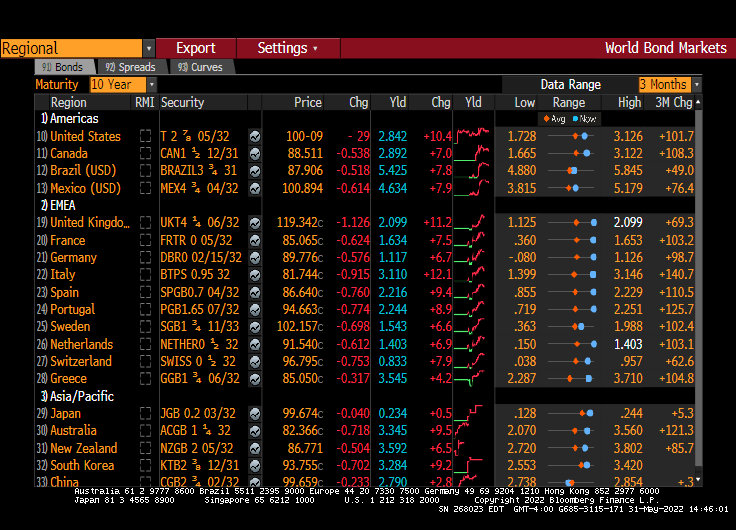
The US Treasury 10Y-5Y yield curve has gone into negative territory (which usually occurs before a recession). At the same time, US mortgage rates are climbing like Tom Cruise in “Top Gun: Maverick” to 5.87% as The Fed tightens its choke hold on markets.
The 10Y-5Y Treasury curve typically goes negative before a recession.
And then we have today’s PPI report (Producer Price Index), rising 10.8% YoY as M2 Money stock starts to decline a bit.
Here is a better view of mortgage rates under Biden/Powell.
The Federal Reserve is making up for Bernanke and Yellen’s “too slow to remove” Fed stimulus policies (QE1 – QE3) and Powell’s Covid-related QE4. Now The Fed is trying to remove the stimulus in a (misguided) attempt to cool inflation. Remember, the dramatic rise in prices was caused by more than Fed stimulypto, it was also caused by Biden’s executive orders driving up oil, gasoline and natural gas prices and the massive Federal spending bills signed by Biden.
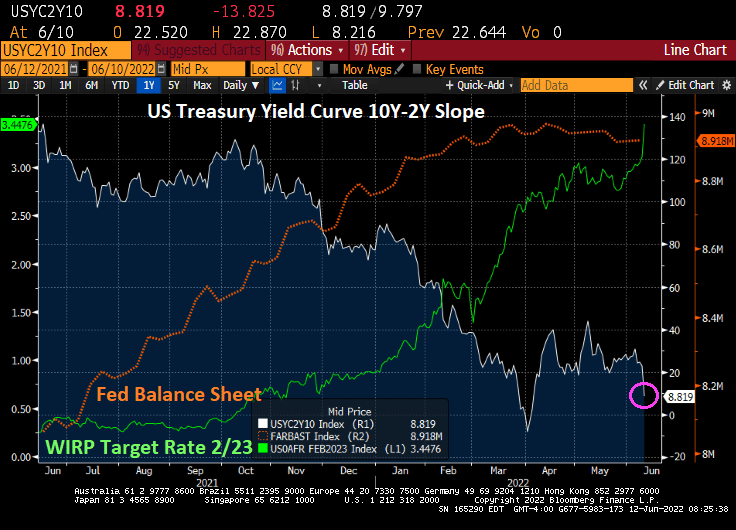
The result of The Fed’s jawboning about undoing Fed stimulypto is take away the punch bowl. But the results are troubling. Both the total return indices for US Treasuries and Agency Mortgage-backed Securities (MBS) have declined dramatically since inflation has been rising (highest in 40 years) and The Fed is expected to crank their target rate by February 2023 to 3.448% (The Fed Funds Target Rate currently stands at 1%). That is almost a 250 basis point rise in the target rate in 8 months.
While the 10-year rate is rising rapidly, the 2-year Treasury yield is REALLY rising fast.
And the yield curve (10Y-2Y) is down to +8.819 basis points as The Fed signals tightening.
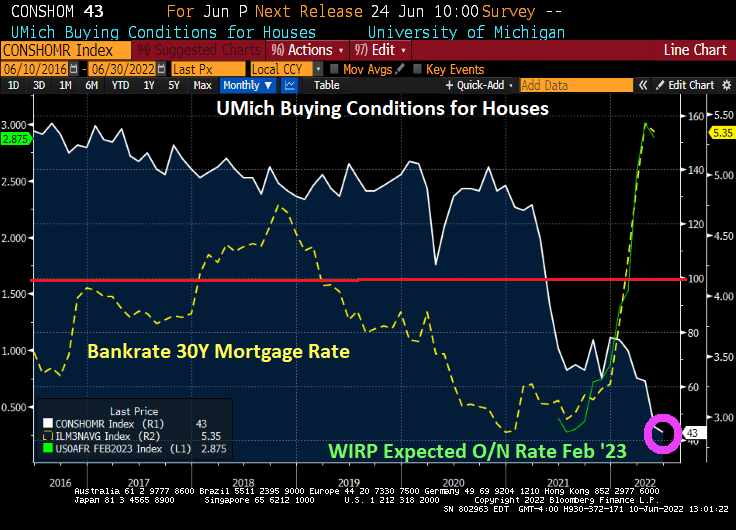
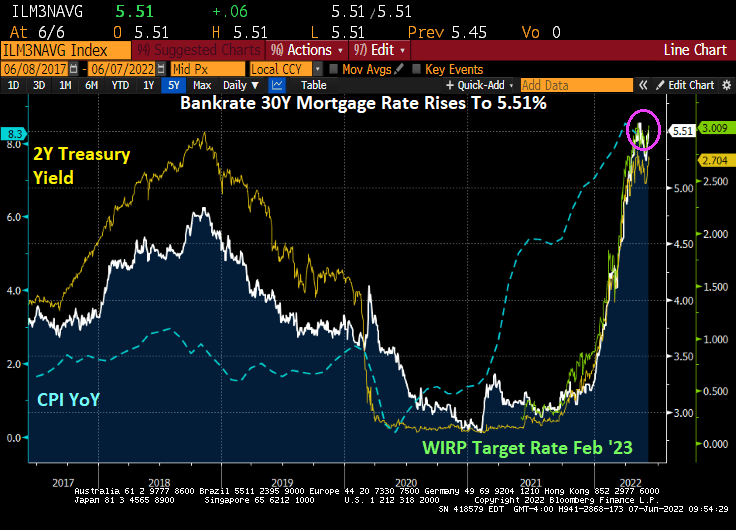
And with rising 10 and 2Y Treasury yields, we are seeing the fastest rise in mortgage rates since 1981.
The Fed is expected to raise their target rate to 2.875% by February 2023. With that expectation, mortgage rates (yellow line) are soaring. And with that, University of Michigan’s Buying Conditions for housing has plunged to 43, the lowest levels since 1982 as the US was trying to recover from high inflation.
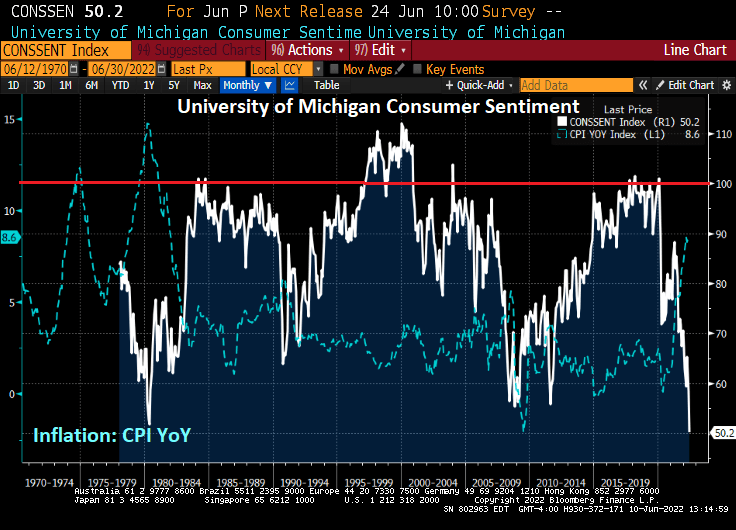
The University of Michigan consumer sentiment index just plunged to the LOWEST LEVEL in history on inflation and Fed’s reaction.
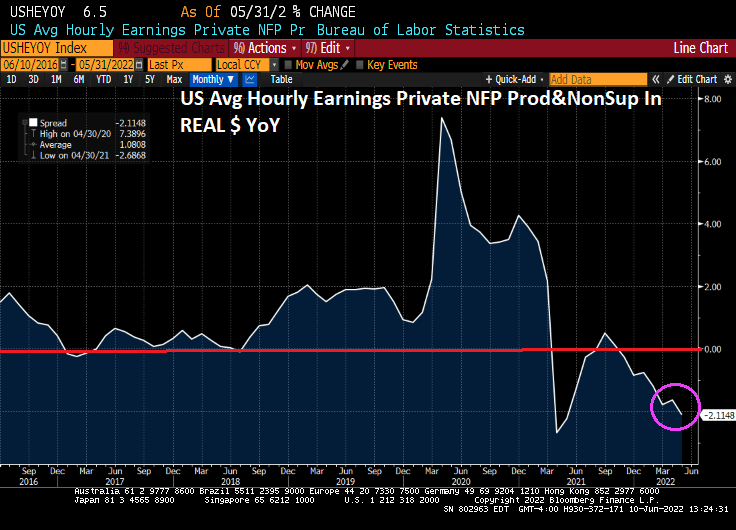
Average REAL wage growth has now declined to -2.11% YoY.
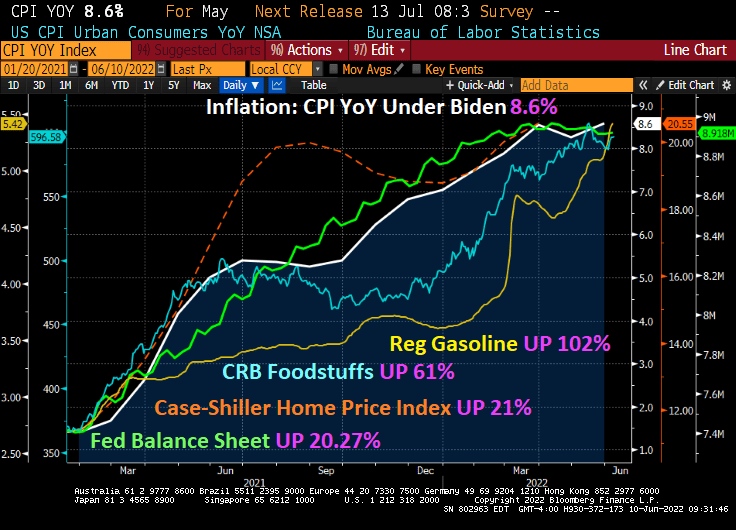
Inflation, the bane of the middle class and working families, just rose to 8.6%.
Core inflation, that excludes energy and food, actually declined slightly to 6% from 6.2% in April. But since most families are concerned with gas prices and food, (not to mention home prices growing at 21.17% YoY), core inflation really underestimates the suffering.
Under Biden’s leadership in cooperation with eternal Fed stimulus (until now), inflation started at 1.4% YoY and has increased to 8.6% YoY. The Fed’s balance sheet has increased by 20.27% (more monetary Stimulypto!), Case-Shiller home prices started at 10.44% YoY and has now doubled to 20.55% YoY. Regular gasoline started at $2.57 and is now at $5.42, up 102%. Food is up 61%.
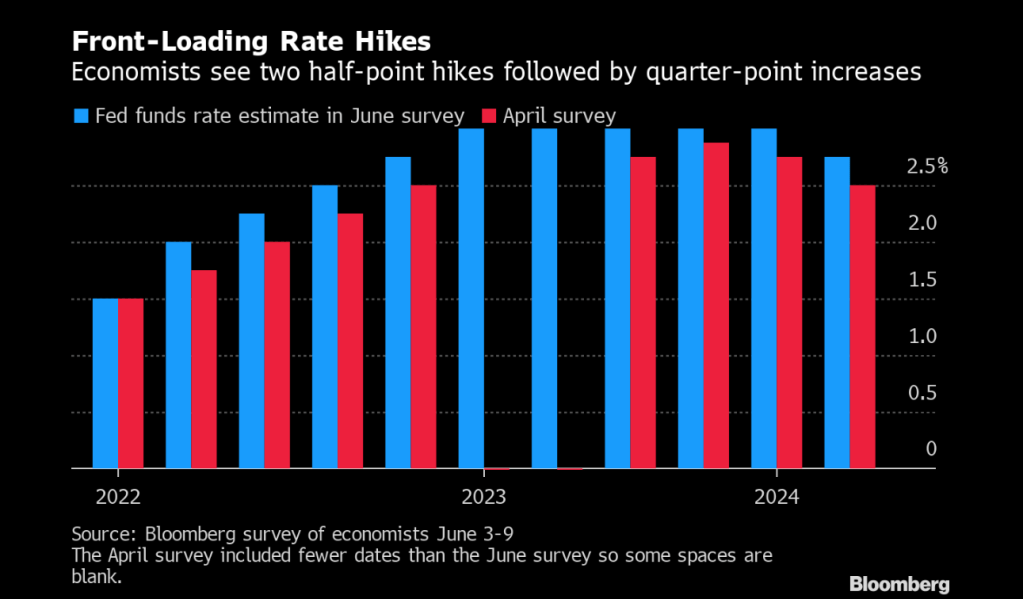
The Fed is expecting two half-point hikes followed by quarter-point increases.
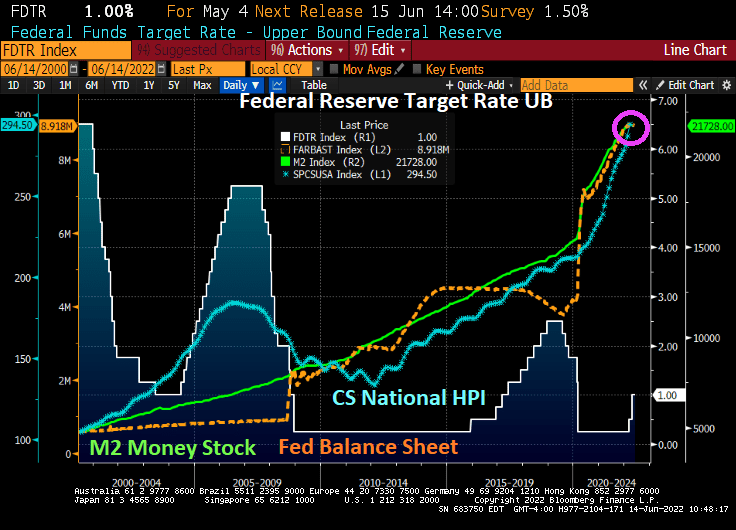
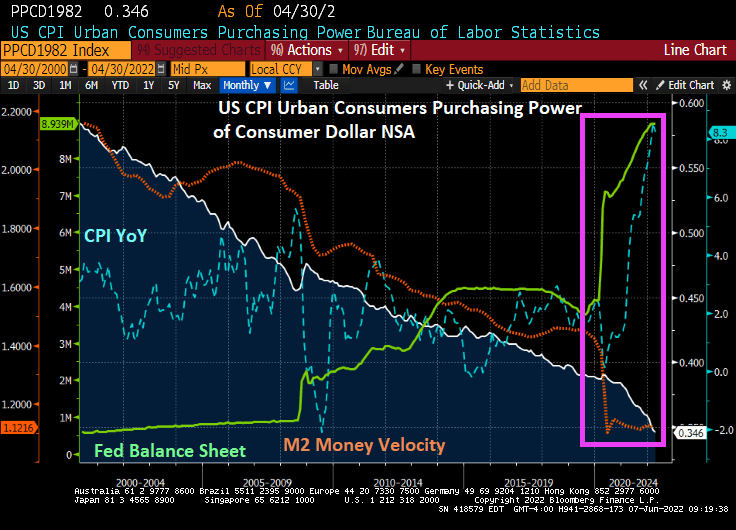
Here is my version of their chart since 2000 where you can seen the seismic shift in the balance sheet (toxic green slime line), particularly with The Fed’s response to Covid. The Fed is signaling a tightening in monetary policy to help reduce inflation (blue line).
But notice that M2 Money Velocity (GDP/M2) is now near the all-time low along with consumer purchasing power.
How BIG is The Fed’s balance sheet? Try more that a third of size of US GDP.
And as The Fed signals its inflation-fighting intentions, mortgage rates have shot up to 5.51%, the highest mortgage rate since June 2009.
Meaning that The Fed has kept monetary stimulus in play for too long since late 2008 helping to lower mortgage rates from over 6% in November 2008 to 2.98% in November 2021. Then came “The Missouri Boat Ride” as The Fed signaled monetary tightening, leading to mortgage rates skyrocketing to their highest level since 2010.
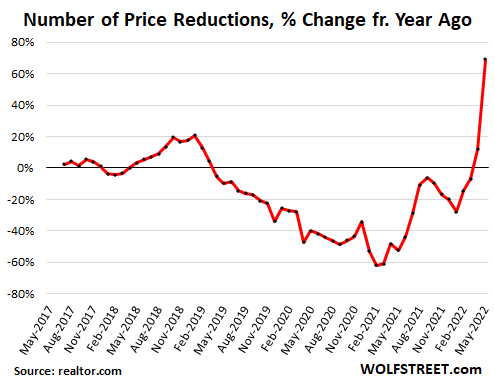
The result of rising home prices AND mortgage rates? Housing acquisition prices (home prices * 30 year mortgage rates) have skyrocketed.
Between rising home prices and rising mortgage rates, we see that number of prices reductions increasing at nearly 70% YoY (chart courtesy of WolfStreet.com).
Of course, Congress and the media will never ask Janet Yellen (former Fed Chair [2013-2018] and current Treasury Secretary) WHY she kept massive monetary stimulus around for so long. Or why current Fed chair Powell did the same with Covid-related monetary stimulus.
Earlier today, we saw that the Case-Shiller National home price index in March rose to its fastest rate in history.
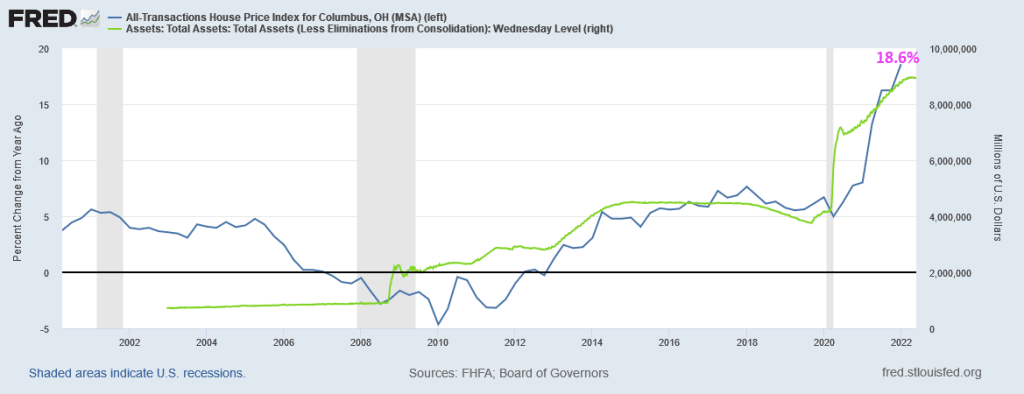
Columbus Ohio is not covered by Case-Shiller in their 20-city index, but the FHFA’s home price index does. And in Q1 2022, home prices grew at a 18.6% YoY clip.
The Federal Reserve has been signaling a tightening of its loose monetary policy (essentially loose since the housing bubble burst of 2008 and the ensuing financial crisis). It is still loose as The Fed hasn’t really trimmed its massive balance sheet yet and has just raised it target rate to 1%.
So, potential home owners have to pay 5.10% for a 30-year fixed-rate mortgage while the effective Fed Funds rate, the rate at which banks lend to each other, is a measly 0.83%. This puts consumers at a relative disadvantage to large Wall Street firms that are gobbling up houses at an accelerated rate.
With the US housing market slowing (thanks to The Fed’s signaling of monetary tightening), the question now is how far will The Fed go in its “War on Inflation!”?
You can see a major cause of inflation in the US since 2000: Federal spending and Federal (public) debt. During The Great Recession of 2008-2009, we saw inflation (CPI YoY) collapse into negative territory as Federal spending and debt soared. But the mini-recession of 2020 caused by the Covid governments shutdowns led to TWO surges in Federal spending and debt: Covid relief followed by the infrastructure spending bill. Combined with Biden’s anti-fossil fuel executive orders and massive splash of Federal spending in to the economy, we have inflation soaring.
If surges in Federal spending (requiring surges in Federal debt) have gone away (except for $40 billion in Ukrainian relief and Biden’s possible student loan cancellation of $10,000 that will cost an estimated $321 billion … and help drive up college tuitions even further), we may be over the “twin gorgings” of the Covid spending spree. This alone may result is a decline in the inflation rate.
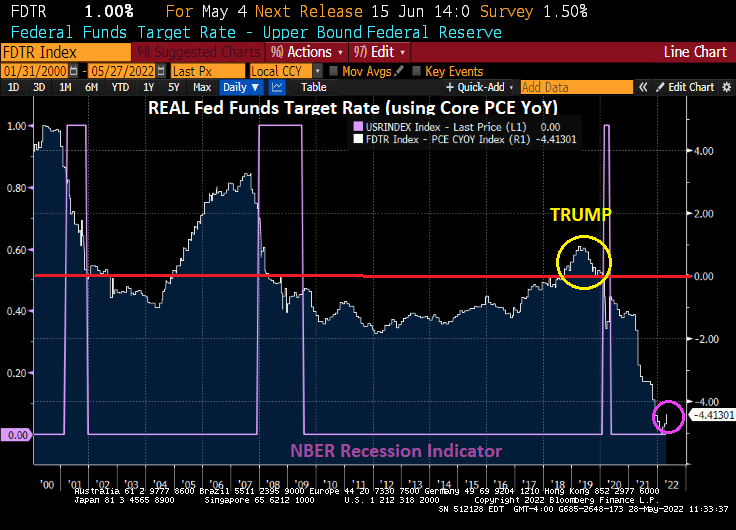
Where do we sit today with the REAL neutral rate? The REAL Fed Funds Target Rate (upper bound) is -4.41%. It was in positive territory during the Trump years. But then Covid struck.
No wonder Wall Streeters like to go “Down To The Nightclub!” The Fed still has not taken the monetary stimulypto away, but have taken it away for consumers buying housing.


You must be logged in to post a comment.