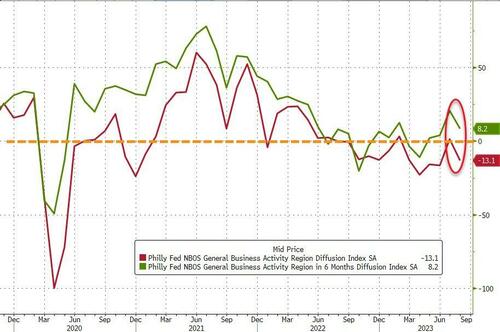
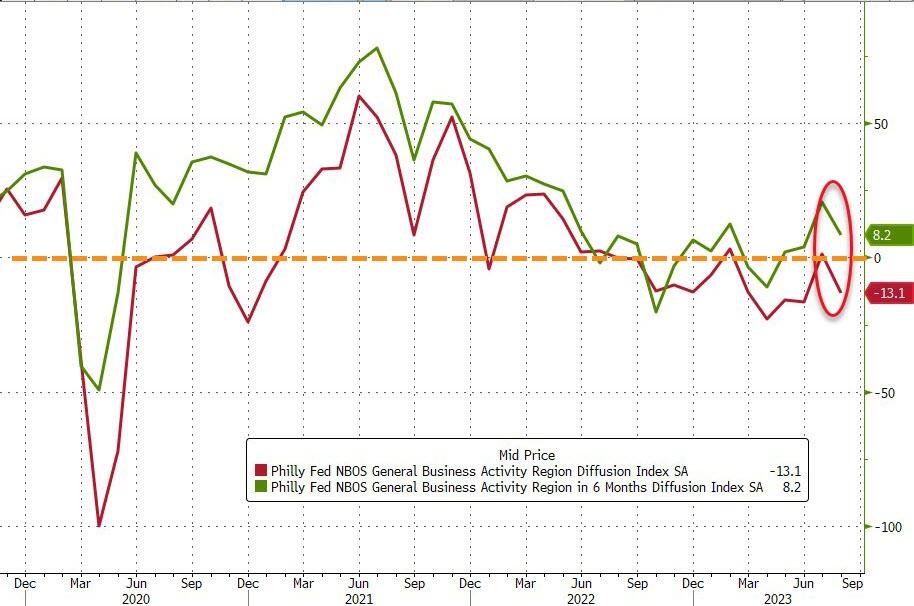
It’s NOT always sunny in Philadelphia. Particularly when the Philly Fed non-manufacturing survey screams stagflation (a nauseating combination of economic slowdown and inflation).
On a non-seasonally-adjusted basis, the Philly Fed Services survey plunged to -20.0 – practically its lowest level since the COVID lockdowns…
Source: Bloomberg
Under the hood it’s even uglier with stagflationary impulses rearing their ugly heads.
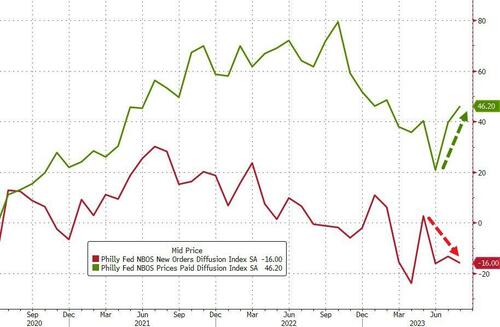
Price indicator readings suggest continued increases in prices for inputs and the firms’ own goods and services.
The prices paid index increased 7 points to 46.2 this month. More than 50 percent of the firms reported increases in input prices. Regarding prices for the firms’ own goods and services, the prices received index rose from 7.8 to 14.6.
At the same time the indexes for sales/revenues and new orders both recorded negative readings this month
Source: Bloomberg
Is the ‘Services’ side of the economy finally catching down to the reality of the ‘Manufacturing’ side as savings run dry?
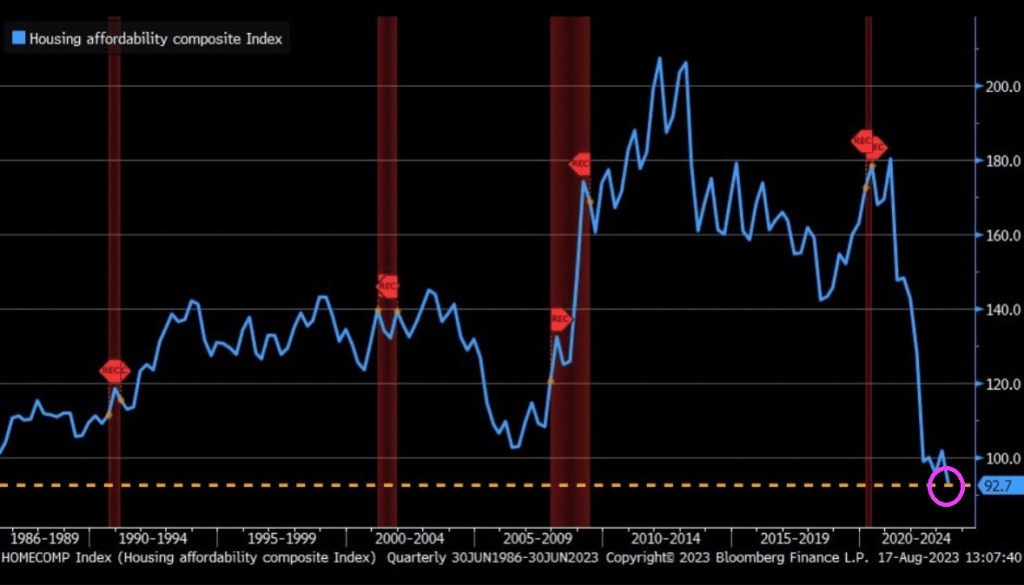
Yes, The Fed has a line on you! And will likely keep raising rates as inflation stays elevated. This means higher mortgage rates unless China slips into a deflation doom loop.
Thanks in part to The Fed, housing affordability is at the lowest level since the 1980s.
And we are seeing tail volatility in the US Treasury futures.
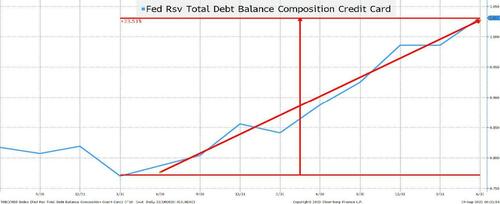
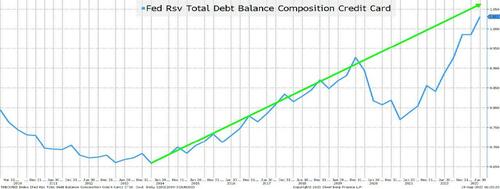
Fastest Ever Rate of Increase in Credit Card Debt!!
Credit card debt has been rising at what seems like an alarming rate. To cope with Bidenflation.
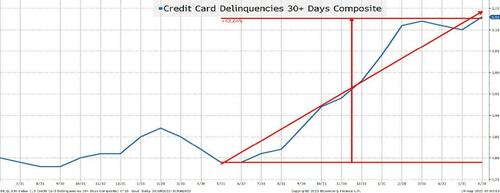
Credit Card Delinquencies Gapping Higher!
This chart seems almost scary because it shows a rapid rise in delinquencies. While not quite “parabolic” it has increased by almost 50% in a little over a year! However, 0.8% to 1.15% seems a lot less scary than saying it has increased by 50% (which is why I tune out whenever anyone talks about credit spread moves in percentage terms).
Not only is credit card debt rising at an alarming rate, it is also coming just as delinquencies spike higher!
The Consumer is Normalizing
Let’s revisit the prior two charts but use a different time horizon.
Credit Card Debt Remains Below Trend
Credit card debt rose at a steady pace from 2013 until late 2019. Then COVID, stimulus, work from home, and supply chain issues all seemed to coalesce into an amazing drop in credit card debt. While we can question whether credit card debt should have been rising at the rate that it was before COVID (and whether it was sustainable or not), we should just accept that it was. Maybe population growth has changed (or it was some other factor), but if you “strip out” the COVID phenomenon, we are basically back to trend. I do think that credit card balances are an issue, but it is an issue that we seem to have dealt with in the past.
On credit cards, I completely ignore any impact from Fed hikes because credit card interest rates have always been very high relative to any other rate. What drives credit card balances doesn’t seem to be a thoughtful analysis of rates. It has always been (at least to some degree) about instant gratification.
Bottom line is that while the trend may not be sustainable, the recent rise just brings us back to trend, which takes some of the sting out of the fact that the consumer is in dire trouble.
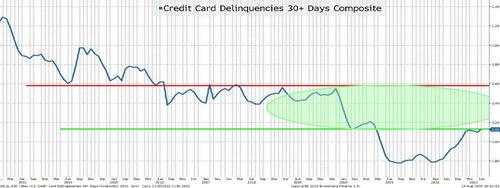
Delinquencies are Below the 5 and 10-Year Averages!
So, delinquencies aren’t even back to pre-COVID levels. This data series averaged 1.5% for the 5 years prior to April 2020, and was 2.1% for the 10-year period before COVID (and let’s not even think about where it was post GFC).
I’m not all warm and fuzzy about the consumer, but I’m not alarmed either.
Auto Loans
Auto loans are a bit trickier. From the consumer’s point of view, they tend to be at a fixed rate and many were entered into when rates were low. In fact, if memory serves me correctly, the average maturity of auto loans extended in recent years allowing consumers to lock in low rates for longer (hopefully the lenders hedged their rate exposure on those auto loans).
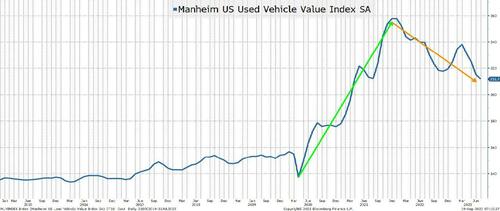
Used Auto Prices are Receding
Used car prices are declining from record highs. That may pose problems to lenders who calculated too much residual value on loans and leases to consumers who thought that we were in a brave new world where even used cars went up in value.
Having said that, the prices for used cars remain robust and my understanding is that it is still extremely difficult to buy the most popular new models (and they often fetch a premium to NAV). Nothing like in the heyday of the supply chain issues, but something that should “normalize” over time.
Auto dealers benefited from a lack of inventory, and I will be curious to see if they can retain their sales with low levels of inventory and (ultimately) pass some of those efficiencies through to the consumer.
With autos being such an important part of the economy, it is something that I watch, but much like the story we heard in credit cards, a lot of the negatives that I’m reading about are simply a “normalization” which may be healthy for generating not just a soft landing, but a sustainable soft landing. However, the “slowing” is something to think about.
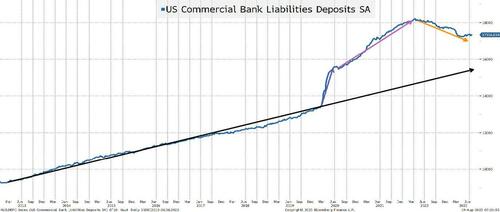
The Excess Savings Lie
I will spare you the agony of going through bank deposit charts on a short-term and long-term basis and just jump straight to the long-term chart. I used purple and orange arrows because I generally reserve green for good and red for bad and I’m not sure that these are “good” or “bad” deviations from trend.
Bank Deposits are Falling! But to Levels Still Around Trend.
I have argued that the “excess” in bank savings was never going to be put into the stock market (one of the bull cases, which may even still be floating around). I also think that there is a lot more than meets the eye about why there is so much in “excess” savings. Sure, without a doubt, COVID boosted savings. One thing that I “forgot” to mention earlier (or maybe I saved it on purpose) about the good things that happened to consumers during COVID is that there were many moratoriums placed on various types of debt service (i.e., student loans).
We can all agree that some amount of cash stayed in savings accounts because while savings accounts earned 0%, so did everything else. As people realized that they could earn more on their money market funds, some amount was going to be taken out of savings accounts paying little interest. Though, I do have to say that I was at the local bank branch a few weeks ago taking out money from the ATM and someone before me had left a receipt showing $99k in their bank account. I immediately thought “who does that?”, but there are obviously people who want bank accounts up to the FDIC limit.
My view has been (and will continue to be) that many people “earmarked” money that they would have to pay in the future and set it aside in a savings account. If you know moratoriums will end (and let’s not forget, these loans typically accrued interest during these periods), then it would be prudent to set aside some money for when those payments got turned back on.
If my theory is correct, you should see bank deposits decline faster as these moratoriums end and the money that was “earmarked” for certain payments is withdrawn to make those payments. Please see American Ingenuity. Not great for the economy or spending, but is “normalization” really bad?
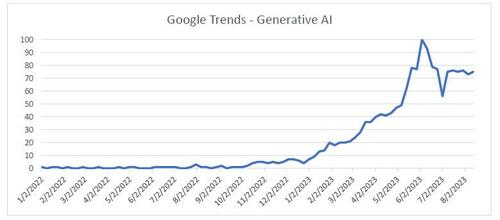
Generative AI
My intention is to use generative AI to help me do a report on “outliers”. This would include warning signs or positive things that the market may or may not be missing. After about an hour or so of brutally failed attempts this weekend, I gave up. I try to write these T-Reports with an estimate of how long it will take and how long the report will be but had absolutely zero clarity on whether the ChatGPT process would work. Hopefully I can make some interesting progress on the report early this week or I will declare it a failure. In any case, was Google trends (using generative AI) all you needed to buy or sell stocks successfully this year?
No one really cared about AI until February of this year. Yes, there were some searches, but very few. The Nasdaq 100 bounced in January, stagnated for a bit, and then started to do well from April until late July. It has sold off steadily since then. While not matching the trends in “generative AI” search, it might have been the best tool to use. The searches have stabilized and what will be interesting to see is if they peaked or if they increase as we end the summer and people are back at work fulltime across the board.
We will be focusing more on AI as Academy’s Advisory Board has grown the number of advisors with significant experience in the area and who are active today in the ongoing development of cyber and AI.
China
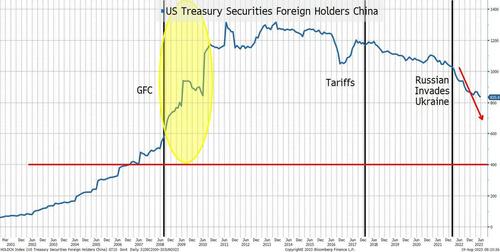
I promised that we’d get back to China, but for now I only want to highlight one chart. And, ironically, it is not a lie. It is the truth, and it is logical.
China’s Holdings of U.S. Treasuries
I highlight three periods.
Post GFC. When the U.S. economy was in tatters and much of the world was struggling, China was able to (or was willing to) accumulate more and more Treasuries. There is a lot of chatter about the decoupling of our economy from China’s right now, which is logical and will continue (the friction is real between the two nations and not getting better). I did, however, find it interesting that China accumulated so many Treasuries in the aftermath of the GFC. Prior to the GFC, the trend seemed obvious (U.S. was growing and buying stuff from China).
The tariffs sparked some discussion of potential retaliation from China, including the possibility that they would dump Treasuries. There was some decline in their holdings, but that could just as easily have been COVID related.
Since the Russian invasion of Ukraine and the decision to freeze Russia’s dollar holdings, there has been a steady decline in China’s Treasury holdings.
Some of the decline is due to the weakness in China’s economy and their potential need to prop up the property market (and maybe even those overly exposed to the “shadow banking system”).
Not only did we freeze Russia’s holdings (which tells me that we can do it again), but we have also been going after China on a myriad of fronts (most notably high tech, but increasingly for rare earths and critical minerals).
Our own debt ceiling issues and ratings may not help, but I’d be shocked if that entered into China’s calculus.
What I cannot tell from this chart is if it is an indication that China is successfully generating trade globally in yuan and has less need for dollars. That would fit my “shifting from made in China to made by China” view to a tee, but I’d be lying if I said that I could support that on this chart! Maybe generative AI will help me find evidence supporting that theory in places that I haven’t thought to look.
One thing that I think supports Treasury market bears is that there will be less of a global interest in holding Treasuries (with China leading the way).
Jobs
So much to do here and with or without AI, I will add more charts related to jobs later this week.
We have covered some of these areas in the past such as discrepancies in JOLTS between job openings and hires and the Establishment versus Household gaps. The fact that all these reports come in with declining response rates is another issue. It is difficult (mathematically) to accept the continuity of a data series when the response rate is declining without a serious investigation into why the response rate might be declining.
While we haven’t discussed it recently, the annual revisions always seem to dramatically reduce the published data for the prior year (but weirdly it doesn’t seem to have a market impact).
Today, I just bring up one chart because I find it fascinating in the lies, damned lies, and statistics theme.
The “Almost” Unbelievable Pattern of New Company Formation
The birth/death model is an estimate of jobs created or lost as new companies are formed or go out of business (or at least close enough for our purposes).
I challenge you to find any other jobs data that looks this “perfect”. It is a beautiful sawtooth pattern that looks almost uninterrupted! For most jobs data, the COVID period makes long-term charts almost impossible to review. The job losses and subsequent job gains are so large relative to any prior periods (or current periods) that these charts look like straight lines on either side of COVID.
Yet this chart seems almost perfect. This is a symmetrical “beauty”, but it is just a “plug”. It is something that clearly relies heavily on seasonality and I find it almost impossible to believe that this is so “predictable” (which makes me wonder how many other “plugs” or adjustments might be meaningless after the COVID shock). Meaningless, but this data is still used to determine policy and drive markets.
Inflation
I couldn’t be bothered. Sure, I will dig into this more, but I really don’t think that despite some Fed jawboning, anything (other than a large/sustained change in inflation) will do much to the Fed’s decision (which means that it will do little for bond markets). I am prepared to be wrong on this and will delve into it this week (with help hopefully from friends at ChatGPT), but inflation is low on my radar screen. However, there is one exception – will companies be able to grow earnings in the current inflation environment where it seems to be more difficult to push through final product price increases while input costs remain elevated?
Bottom Line
Seems like we are back to an “inflection” point where the debate between soft landing and “something less fun” is back on the table. The lag effect is regaining credibility (it always should have).
There are cases to be made for a variety of economic outcomes as we head into September and that is exciting from my seat!
I do think that we are in a period where price action drives what narratives we see: continued downward pressure on stocks will bring out more and more negative reports. One more short squeeze and suddenly AI, soft landing, and praise for Powell is all that we will see.
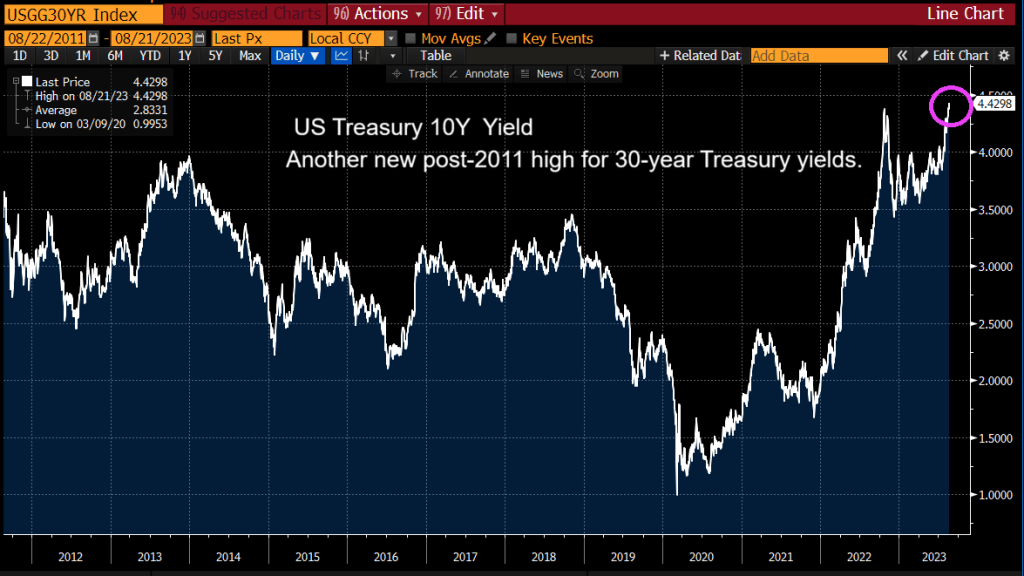
The US Treasury 10Y yield is now the highest post 2011 singaling further Fed rate increases.
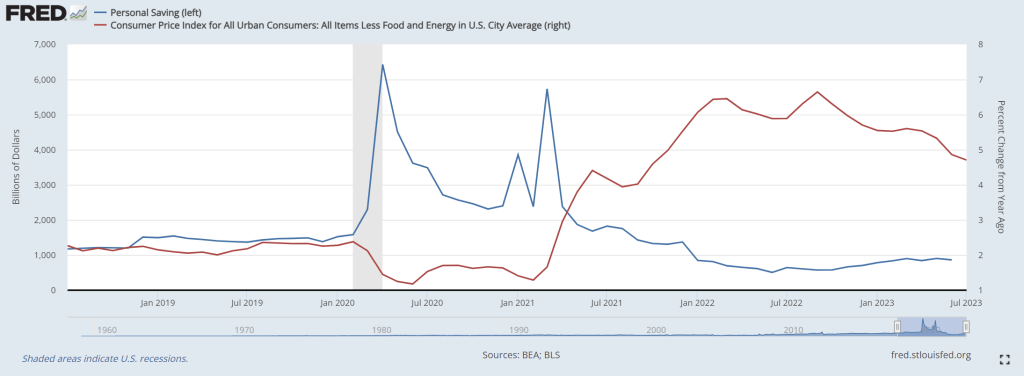
US personal savings are being exhausted as The Fed raises rates to fight inflation. I call this phenomenon “low riding” where consumers are being punished by The Federal Reserve and Biden Administration.
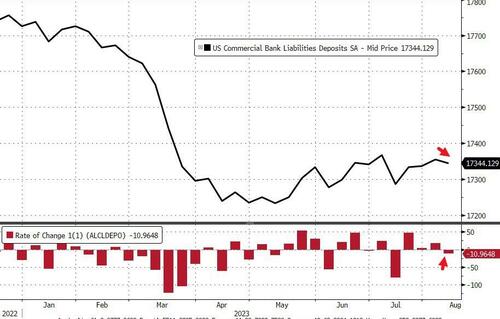
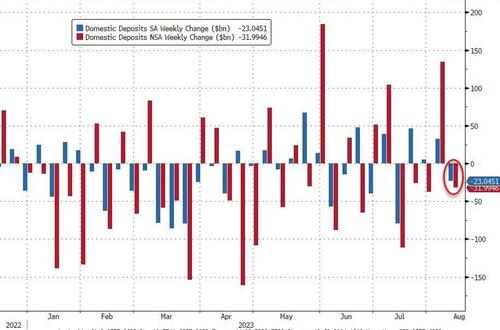
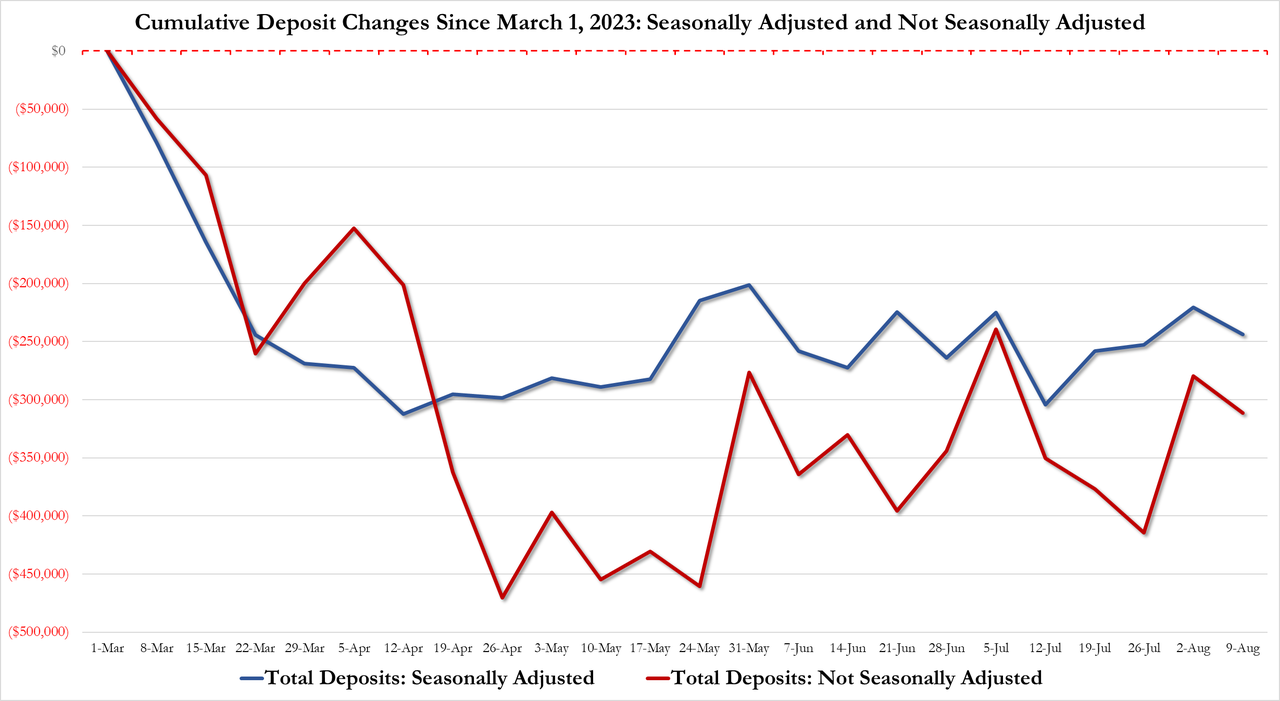
On a seasonally-adjusted basis, The Fed says that total deposits dropped $11BN last week (the first decline in 4 weeks). We also note that the prior week’s inflow was revised higher…
Source: Bloomberg
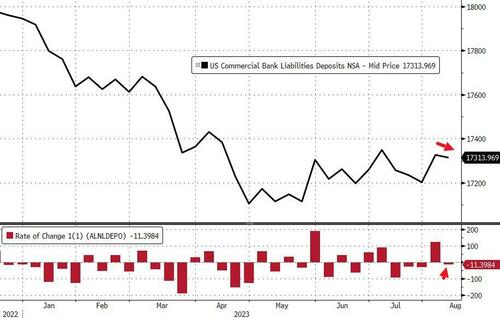
After last week’s enormous $121BN NSA deposits inflow, last week saw an $11BN outflow (on a non-seasonally-adjusted basis)…
Source: Bloomberg
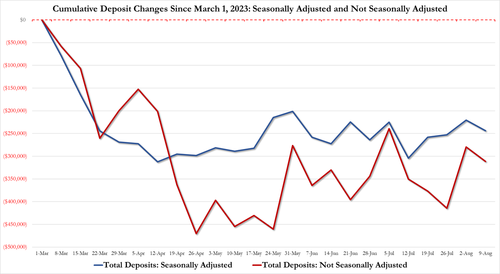
The gap between SA deposits and NSA deposits remains more manageable (until the next time The Fed decides to fiddle)…
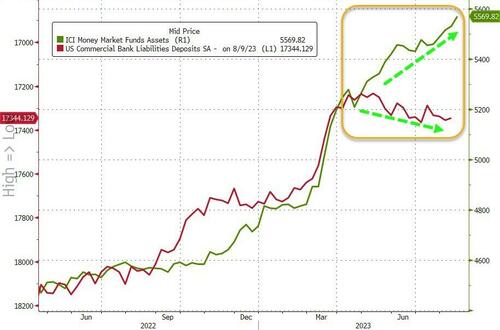
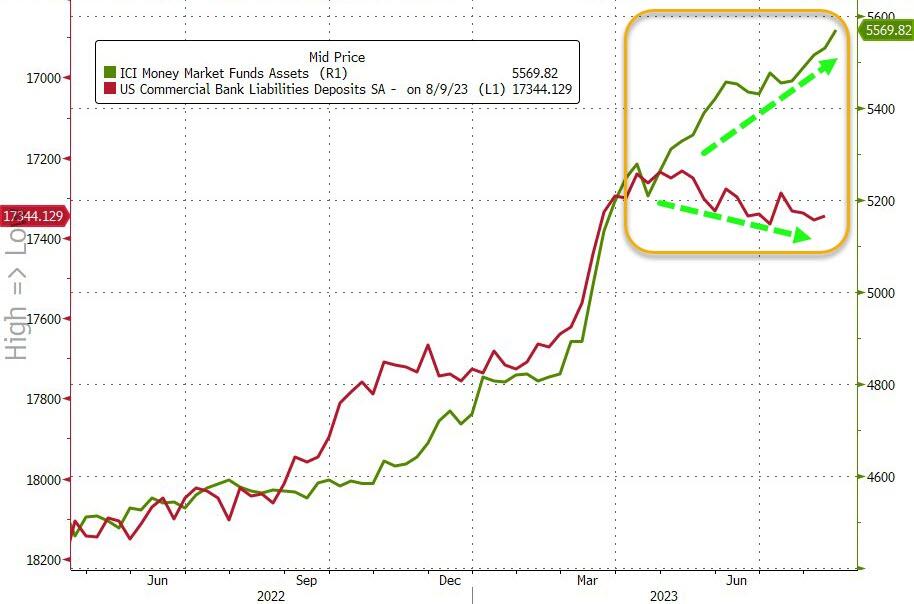
The divergence between money-market fund assets and bank deposits remains extreme…
Source: Bloomberg
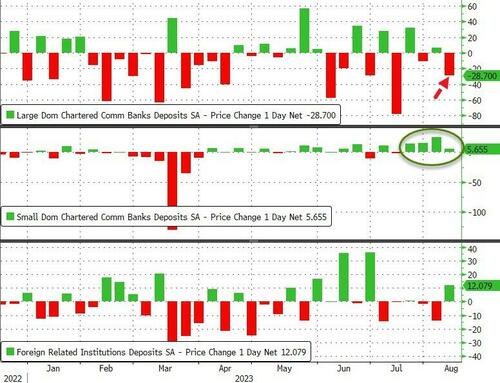
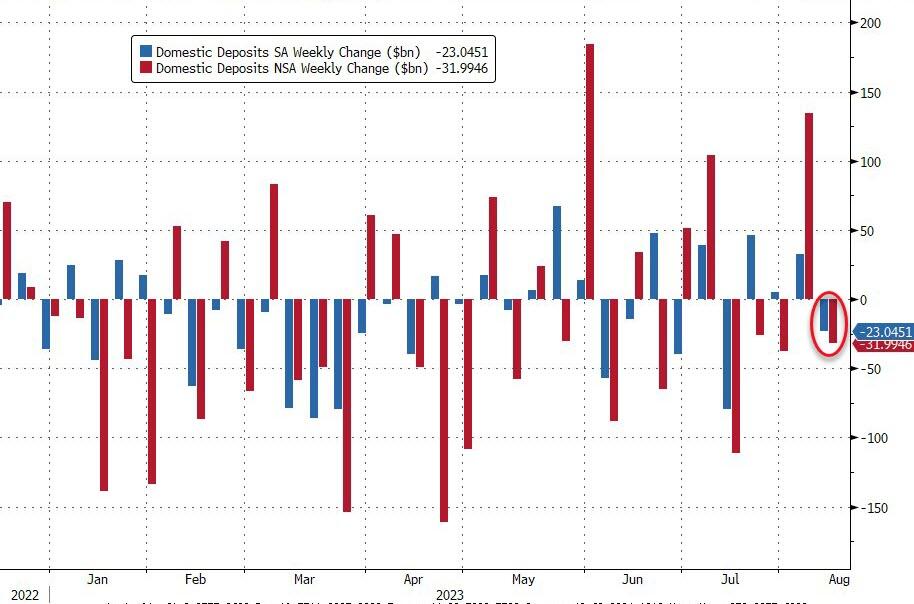
On a seasonally-adjusted basis, Small Banks saw $5.6BN deposit inflows last week while Large Banks suffered $28.7BN outflows (with foreign bank inflows of $12BN making up the difference)…
Source: Bloomberg
And so, for a nice change, everything is tidy with domestic US banks seeing deposit outflows on an SA and NSA basis…
Source: Bloomberg
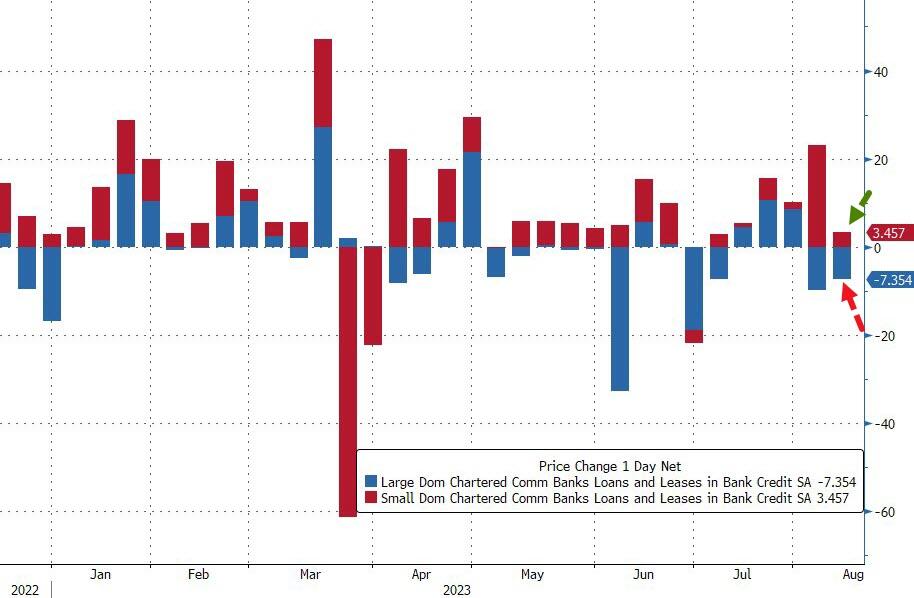
On the other side of the ledger, small banks continued to pump out loans (+$3.56BN, sixth straight week of increases), while large banks saw a $7.4BN contraction in loan volumes…
Source: Bloomberg
So, if The Fed’s data is to be believed, Small banks are ‘winning’ – deposit inflows and making loans; while large banks are leaking – deposit outflows and shrinking loans. All while Treasury prices tumble, stressing small bank balance sheets.
Just remember, the sitting US President Joe Biden goes under several psuedonyms like Robert Peters, Robin Ware, and JRB Ware in his email conversations about Ukraine with his son Hunter. But don’t forget another pseudonym: The Reverend Kane from Poltergeist 2!
Between The Federal Reserve’s outrageous overreaction to Covid (printing like there was no tomorrow), and Biden’s massive spending spree (lots of moldy (green) spending, we have see horrid inflation.
And The Fed trying (sort of) to combat inflation, we see that 30-year CONFORMING mortgage rate for 80% LTV or lower credit borrowers is up 163.5% under Bidenomics.
Under Bidenomics, public debt (owed by the US Treasury) is up 19% or greater than $5 triillion. Now wonder Biden throws are billions like it is water.
I seriously want the Biden Administration (and almost every member of Congress) why we are sending billions of dollars to Ukraine while barely giving Maui fire victims barely anything. The US is already $33 trillion in debt with >$193 trillion in unfunded liabilites. I want to ask Biden and Congress HOW the US is going to afford $193 trillion in unfunded liabilites?
Of course, NO ONE wants to face the reality of the disastrous fiscal poliicies of Washington DC politicians. Not McConnell, not McCarthy, not Schumer and especially not Billions Biden. Remember 10% for The Big Guy where Democrats argue that is meaningless. Or mini-me, Robert Reich (Clinton’s labor secretary) who claimed that the US economy is the best he has ever seen! Yes, Reich, for the top 1%. Of couse, no one will ask fools like Reich how we will pay for $33 trillion in debt and the $193 trillion in unfunded liabilies … and fund a war in Ukreiane in seeming perpetuity.
On Monday, Argentina’s central bank raised #interestrates to 118% as Argentina 30-year mortgage is now at a record 82.2%.
There is a record 350 Argentine Pesos for each US Dollar. All courtesy of Argentina’ version of Bidenomics … top down direction of spending and regulation and an out of control Central Bank.
The themesong of Bidenomics is Randy Newman’s “Mr. President,” Have pity on the working man instead of paying off green energy BIG donors.
The massive green enegy spending spree by Biden and Congress (disguised as Inflation Reduction Act) is the keystone of Bidenomics. Or loadstone.
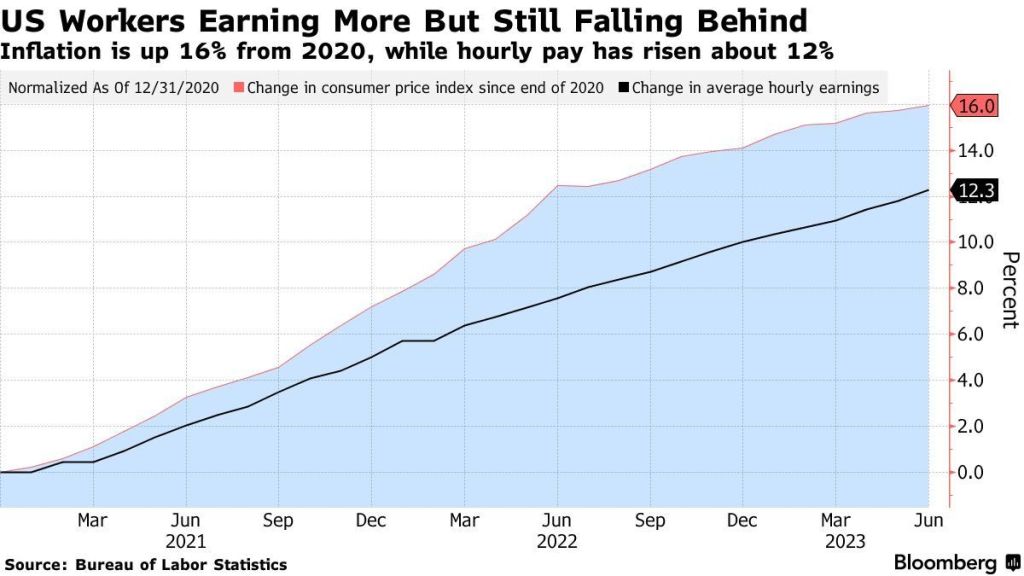
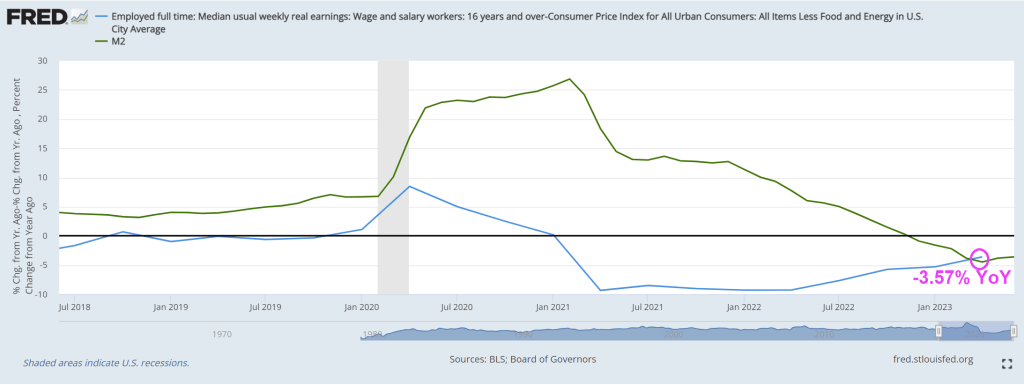
Since Biden became President, hourly pay has risen 12%! Unfortunately, Bidenomics spending spree (along with endless Fed monetary stimulus) has caused inflation to rise 16%. That is a net -4% decline in REAL earnings.
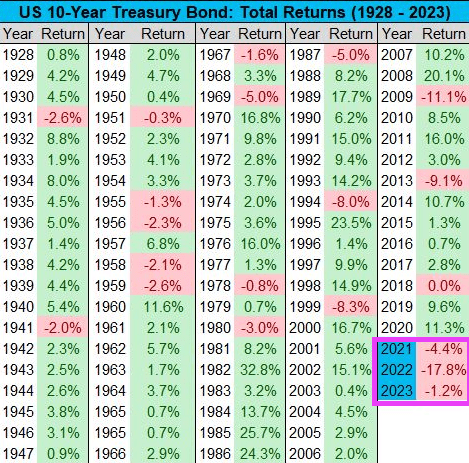
10-Year Treasury Yield is now 4.28%, the highest level since October 2007. From a total return perspective, the 10-Year Treasury Bond is now down 1% in 2023, on pace for its third consecutive negative year. With data going back to 1928, that’s never happened before. BUT we’ve never had Joe Biden as President before 2021.
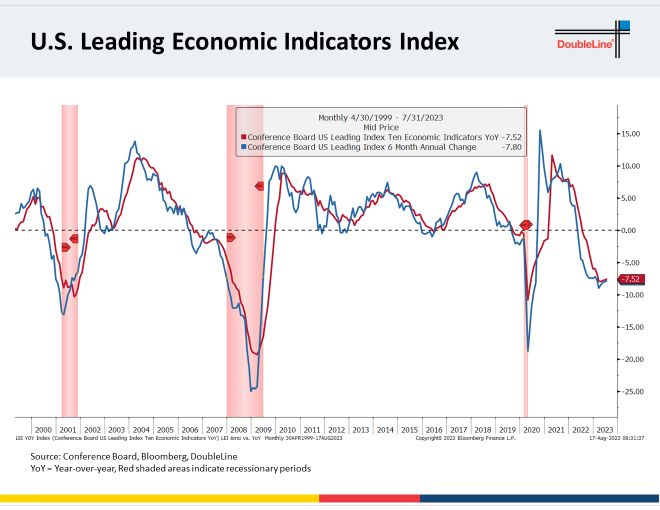
And then we have the Conference Board’s Leading Economic Idicators, sucking wind.
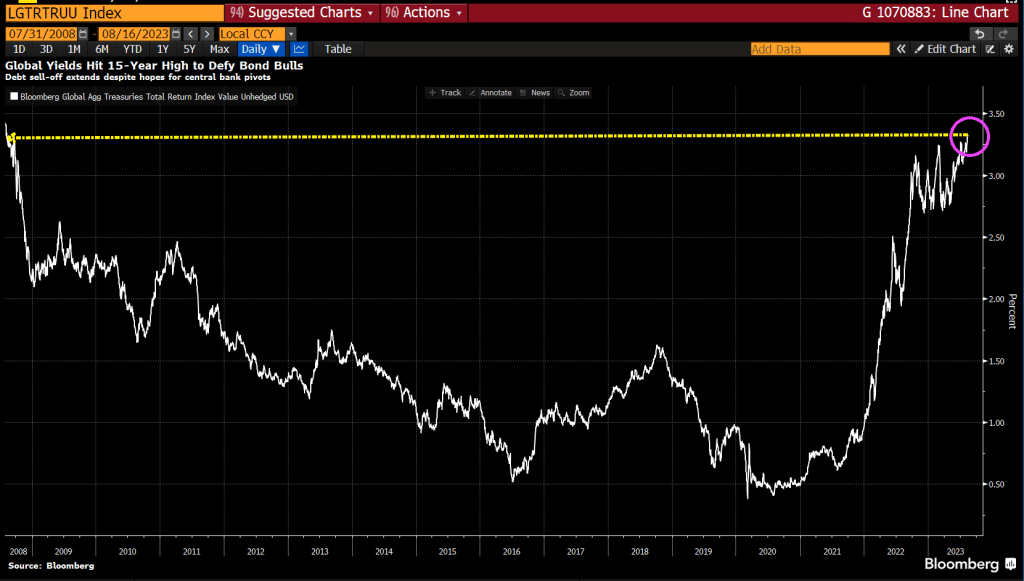
This is very strange. Global Treasury Yields just rose to a 15-year high (2008). This is primarily due to Central Bank moneta
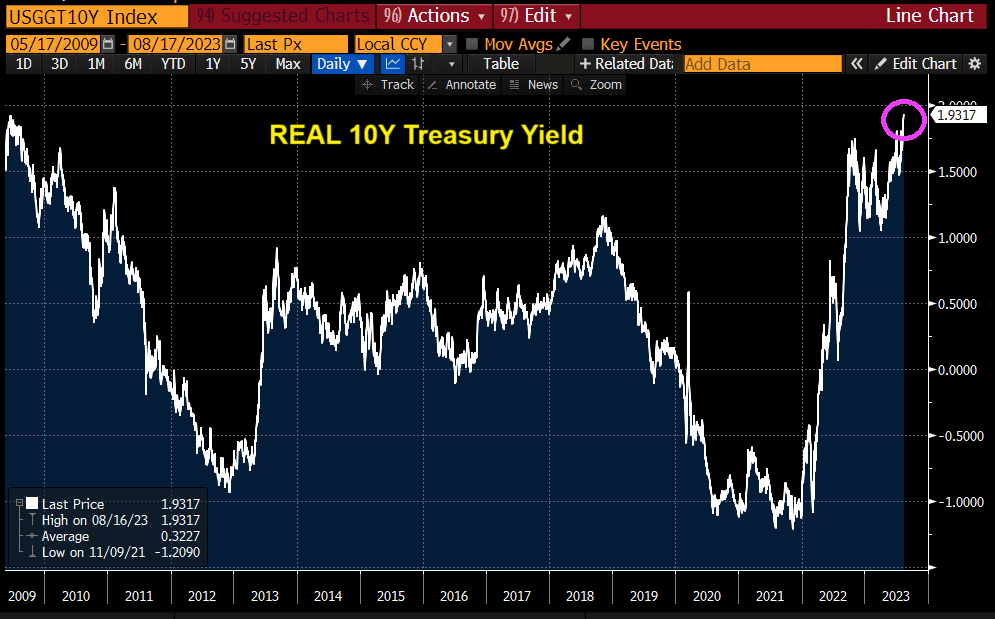
And REAL 10-year Treasury yields also the highest since 2009.
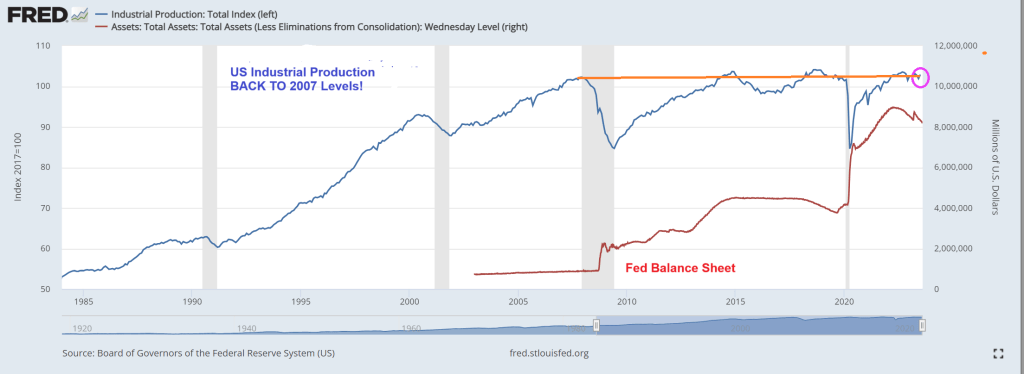
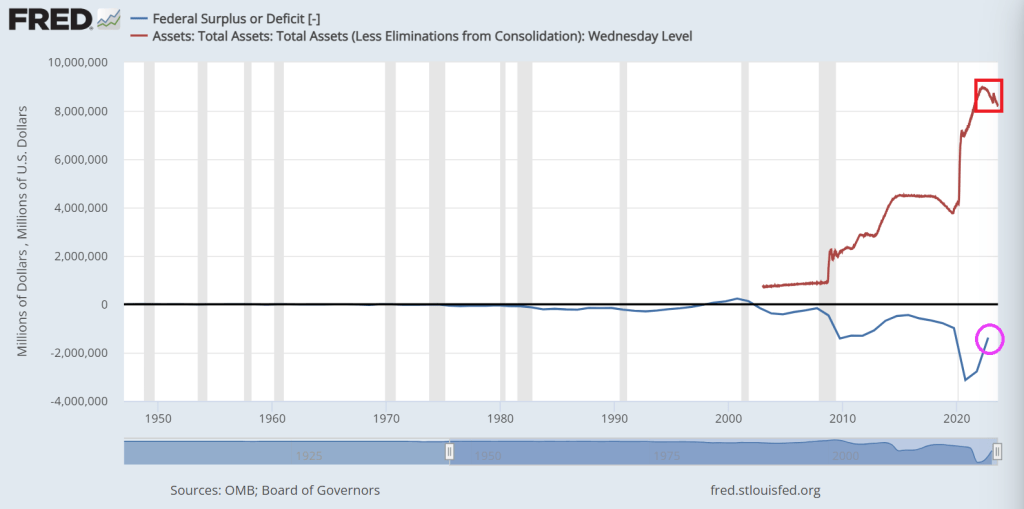
At the same time, US industrial production is at the same level as pre-financial crisis (2007). Despite Federal Reserve monetary stimulypto (remember, The Fed’s balance sheet remains abouve $8 trillion.
This is Obama/Biden/Yellenomics. Trillions of dollars of fiscal (green) stimulus and monetary stimulus only to have industrial production be at the same level BEFORE The Great Recession and financial crisis.
Well, its now August 2023 and US Industrial Production for July increased … to 2007 levels. This comes after the massive spending out of Washington DC and massive Federal Rerserve stimulus.
Is that all there is??
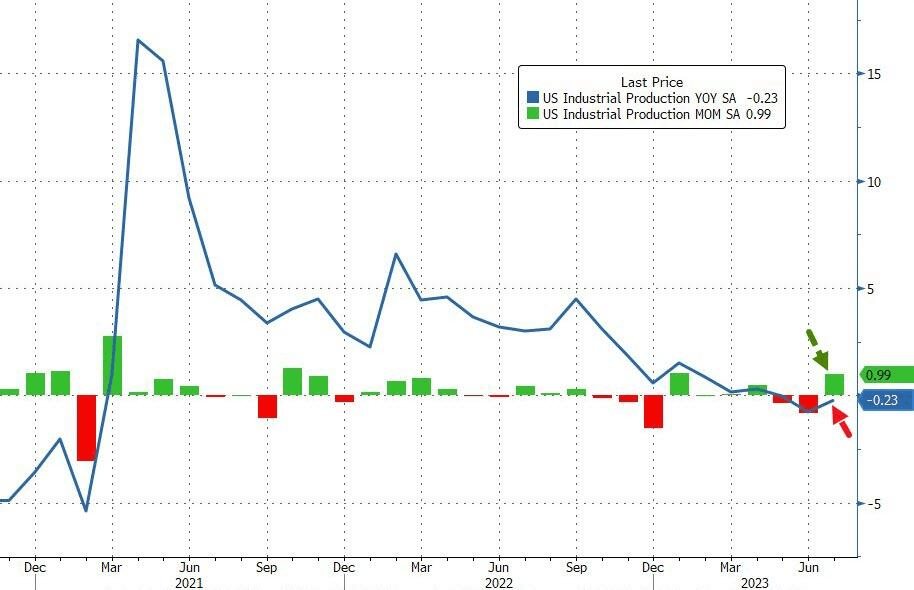
US Industrial Production is DOWN -0.23% YoY while up slightly in MoM terms.
As I said a couple of days ago, the Obama/Biden economic model is a Soviet/Chinese Communist Party (CCP) style of COMMAND economics, not free market DEMAND economics.
“Ice Cream Joe” Biden is at Lake Tahoe for a week, probably to avoid being asked questions about his tin-ear respoonse to the tragic Maui fires that have killed 106 people so far. Instead, Joe is inappropriately chuckling (showing he doesn’t care!) and taking photo ops of him eating ice cream. The Biden administration angered a lot of people when it was announced that households that have been affected by the fires would only be getting a one time emergency aid payment of $700 while he gives billions for Ukraine.
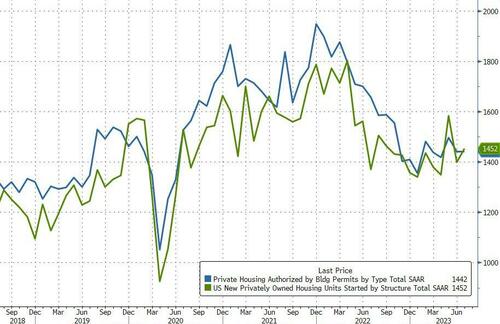
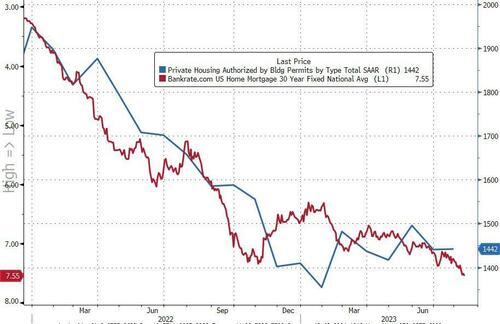
At least housing starts were up 6% year-over-year (YoY).
However, the picture was more mixed with starts rising 3.9% MoM (vs +1.1% exp), but that was impacted by a notable downward revision in June (from -8.0% to -11.7%).Building Permits rose just 0.1% MoM (well below the 1.5% MoM expected).
On a SAAR basis, Permits disappointed (1.442mm vs 1.463mm exp) while Starts were in line at 1.452mm (up from a significantly downwardly-revised 1.398mm in June).
Source: Bloomberg
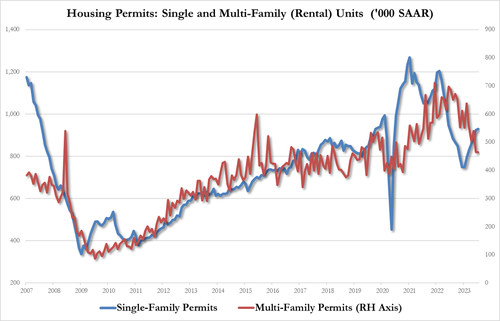
On the Permits side, single-family rose as multi-family fell:
Single-family up to 930K from 924K, highest since June 2022
Multi-family down to 464K from 465K, lowest since Oct 2020
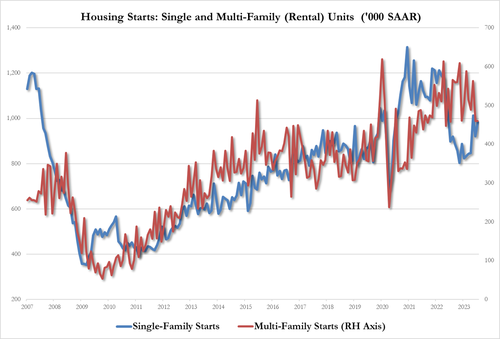
July Housing Starts data followed the same trajectory with rental units growth underperforming single-family:
single-family housing up 6.7% to 983K, up from 921K, highest since May
multi-family housing unch at 460K, tied for lowest since July 2022
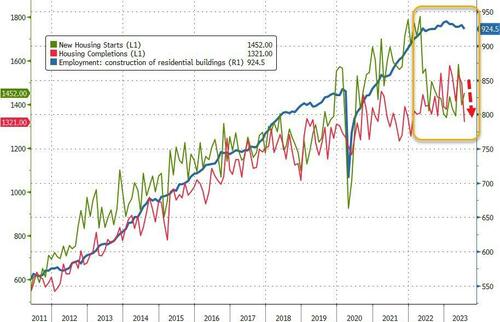
Additionally, we note that while Housing Starts and Completions remain well off their 2022 highs, Construction Jobs remain very close to those highs…
Source: Bloomberg
Finally, we note that Mortgage Bankers Association data released earlier this morning showed applications for home purchases dropped again last week (back near 1996 lows) as the contract rate on a 30-year fixed mortgage surged above 7% (highest since Dec 2001).
Source: Bloomberg
This won’t end well.
Speaking of not ending well, mortgage applications decreased 0.8 percent from one week earlier, according to data from the Mortgage Bankers Association’s (MBA) Weekly Mortgage Applications Survey for the week ending August 11, 2023.
The Market Composite Index, a measure of mortgage loan application volume, decreased 0.8 percent on a seasonally adjusted basis from one week earlier. On an unadjusted basis, the Index decreased 2 percent compared with the previous week. The Refinance Index decreased 2 percent from the previous week and was 35 percent lower than the same week one year ago. The seasonally adjusted Purchase Index decreased 0 percent from one week earlier. The unadjusted Purchase Index decreased 2 percent compared with the previous week and was 26 percent lower than the same week one year ago.
Before I look at Berenson’s plea for more inflation, let’s see where Federal spending and Fed Monetary policies have left us. As of this morning, the REAL US Treasury 10-year yield (nominal yield less inflation), is now the highest since two crises ago, meaning The Great Recesssion and the first major overreaction of The Federal Reserve in late 2008.
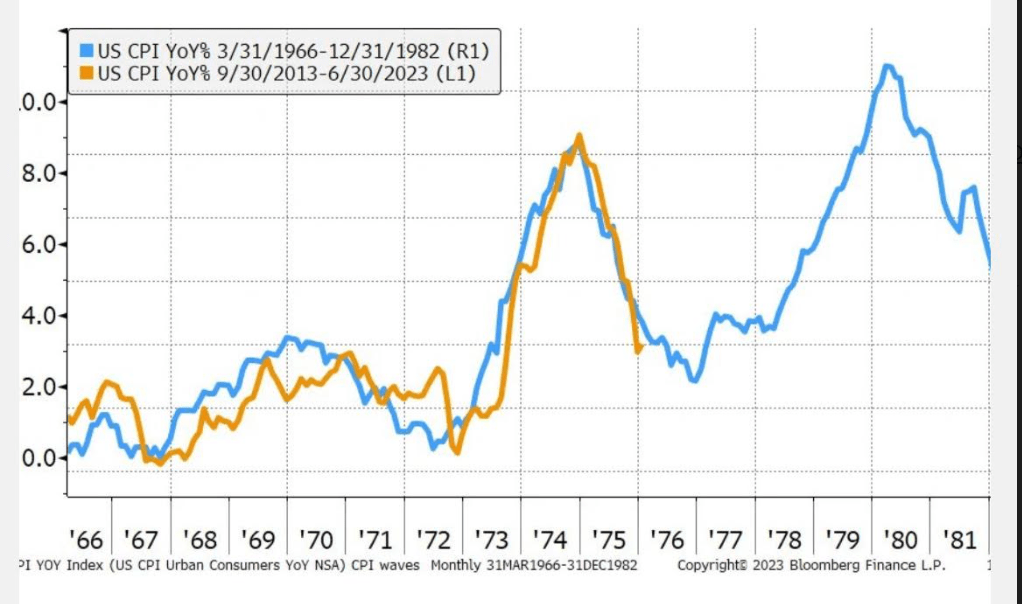
Here is Berenson’s chart showing changes in inflation (CPI YoY) from 1966-1982 compared with recent inflation (orange) from 9/30/2013 – 06/30/2023. A charist might get confused and assume that inflation is will start rising again. But it is far more complicated than a simple projection.
Since 1982 and the Carter recessions, we have seen incredible growth in Federal spending and when the proved insufficient, a massive increase in Fed monetary stimulus in late 2008 and then again in 2020 due to Covid. Remember Winston Churchill’s quote regarding water, “Never let a good crisis go to waste.” That has morphed into a battle cry for more government spending and regulation, not to mention Federal Reserve monetary policies.
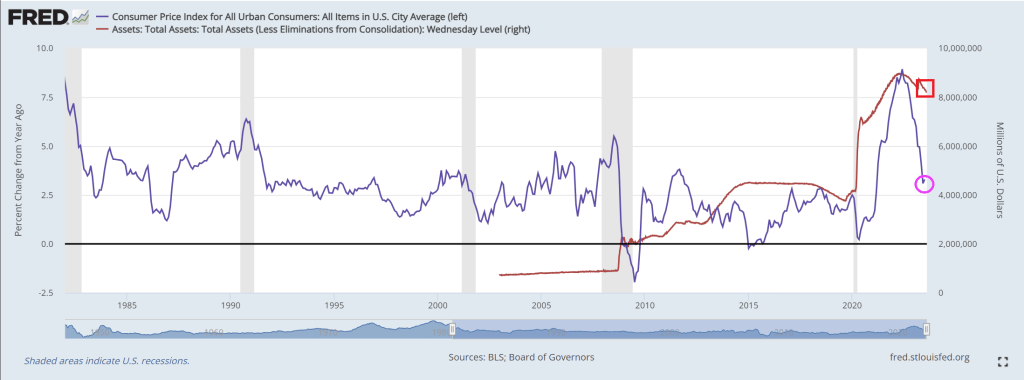
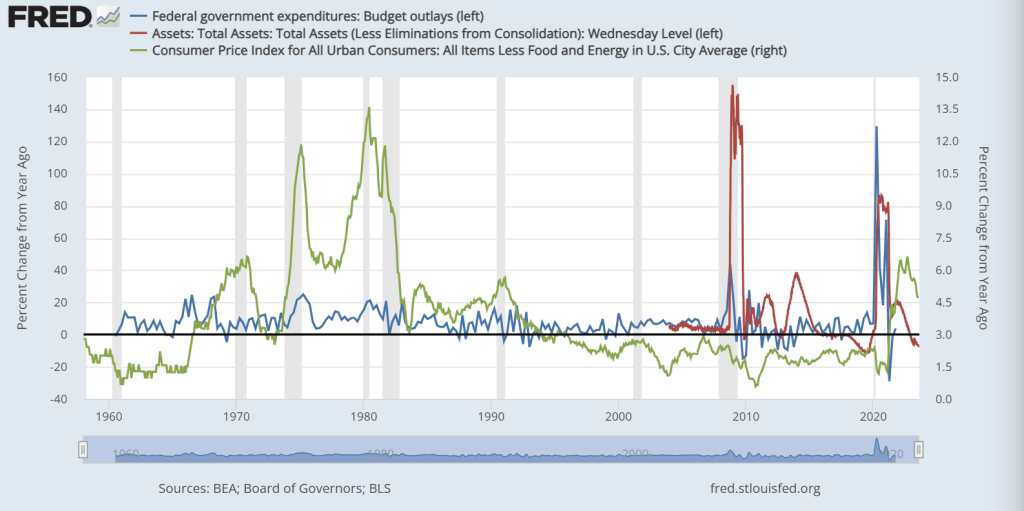
Notice that core inflation under Carter (green line) was gut wrenching (yet Berenson just shrugs it off). Core inflation is still at a horrible 4.7% YoY. But you can see the spikes in Federal spending (blue line) and Fed Monetary stimulus (red line) associated with the financial crisis of 2008-2009 and Covid 2020-2021.
Then we have the Federal budget deficit, still over $1 trillion (despite perpetually confused President Biden claiming he got rid of the deficit). Meanwhile, The Federal Reserve still has over $8 TRILLION in monetary stimulus sloshing around the financial system.
Inflation is a horrifying by-product of Federal spending and Fed monetary policy (especially under Fed Chair Janet Yellen). Unfortunately, Yellen is now the US Treasury Secretary. For example, REAL average hourly earnings are declining thanks to inflation.
Berenson closes his piece with this sobering statement: “Ultimately, this pattern is why inflation is so problematic. It is addictive, and breaking the addiction means damaging the economy.”
Its Federal spending that addictive, and eventually Congress has to cut its insane spending levels. Even if it lowers GDP and increases unemployment. Take a look at China, a command economy, that is really suffering despite massive government spending.
Berenson is saying “all the Biden defenders are saying we’ve won the battle with inflation. But how can that be so with how much we’ve spent?” I agree, but will Washington DC ever learn? I doubt it.
Under Obama/Biden, the US economy is transitioning from a demand economy to a Soviet/Chinese-style command economy where central government directs economic traffic. We need to bite the bullet and return to a deamnd economy.


You must be logged in to post a comment.