President Jimmy Carter is usually the bar for terrible Presidents. Under Carter, the US experienced economic stagnation and soaring inflation. At least it led to the election of Ronald Regan!
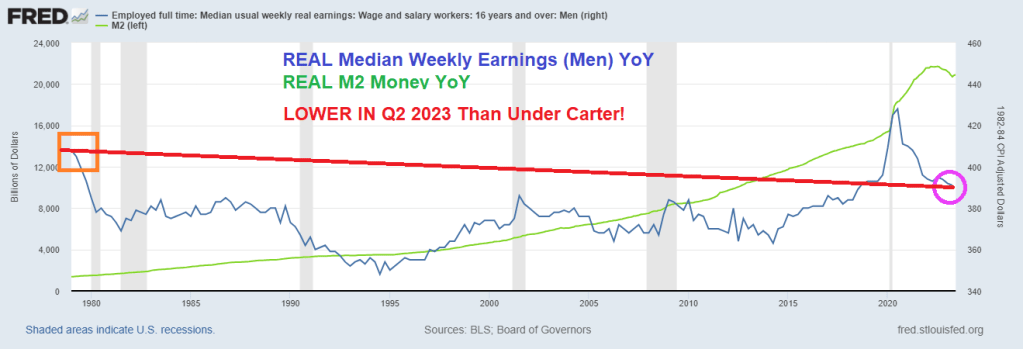
So, Biden’s much mentioned Bidenomics have produced REAL MEDIAN WEEKLY EARNINGS FOR MEN that is currently below 1979 levels under Jimmy Carter.
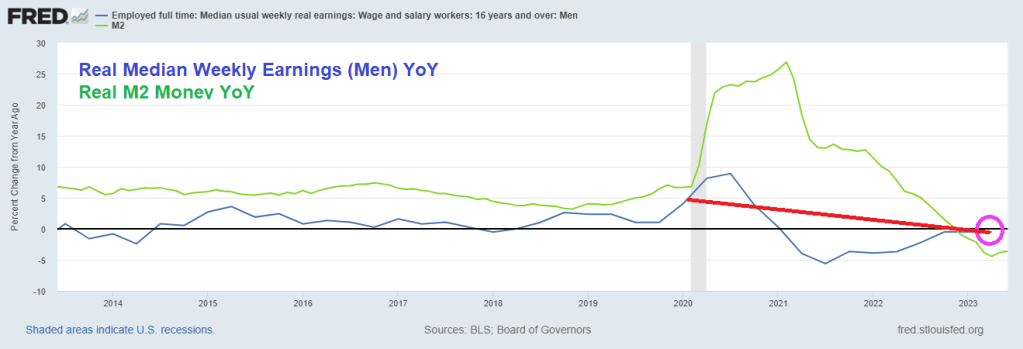
Even worse for Bidenomics, REAL MEDIAN WEEKLY EARNINGS GROWTH FOR MEN was -4.45% In April 2023, while the last reading prior to Covid under Trump was 6.674% YoY in February 2020. So, Bidenomics isn’t even back to Trump levels for men.
I like this chart which I call “Yellenomics” because it illustrates The Fed’s Folly of money printing and its impact on real earnings. After the Trump wage growth boom, real median weekly earnings for men has been steadily declining.
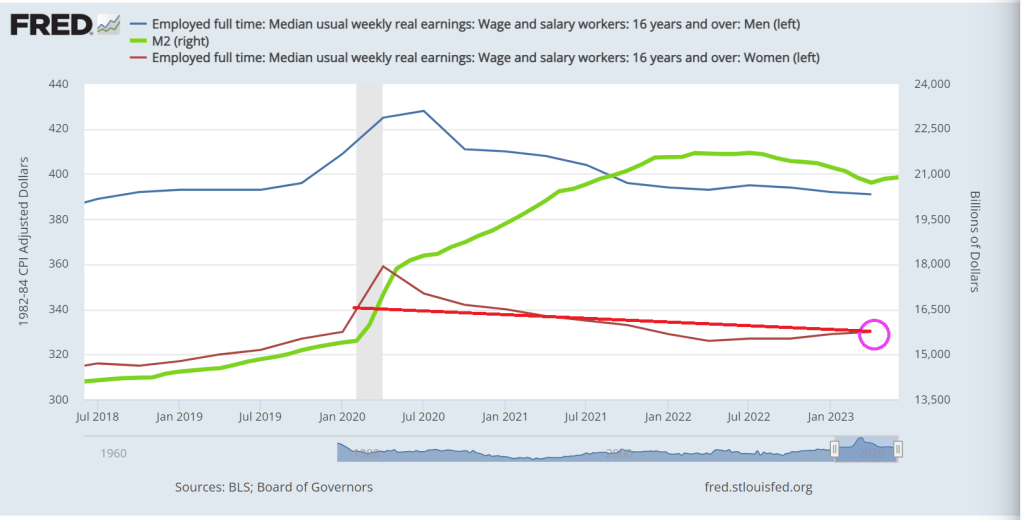
Women, on the other hand, did show a gain since Carter, but still lower than the last month before Covid struck. Women’s real median weekly earnings growth YoY since Q2 2021 are down -5%. So, Bidenomics has been less sucky for women than men.
Reminds me of The Yardbird’s classic “I’m A Man.” Worse off under Biden than under Jimmy Carter. Although The Yardbird’s “Over Under Sideways DOWN” is more emblematic of Bidenomics.
Bidenomics should be renamed Corruptionomics given Biden’s habit of selling government influence to anyone willing to waive a few million.
Bidenomics, aka the Federal government takeover of the US economy with Soviet-style economic central planning, is highly dependent on loose Federal Reserve monetary policy (Janet Yellen and Powell’s wild overreaction to the massively inappropriate Covid shutdowns),
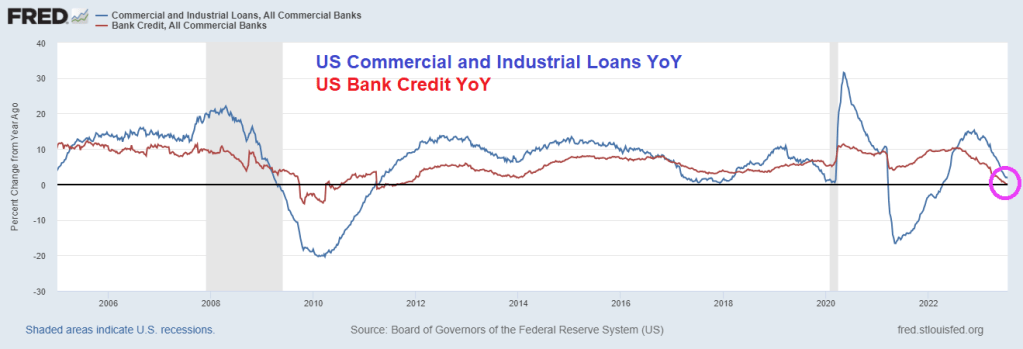
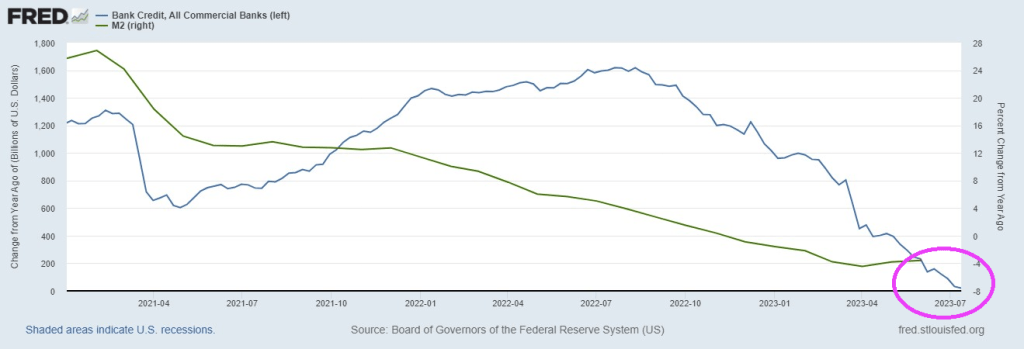
So, how is Bidenomics working out? On the bank lending front, commercial and industrial (C&I) lending growth is crashing along with bank credit growth YoY.
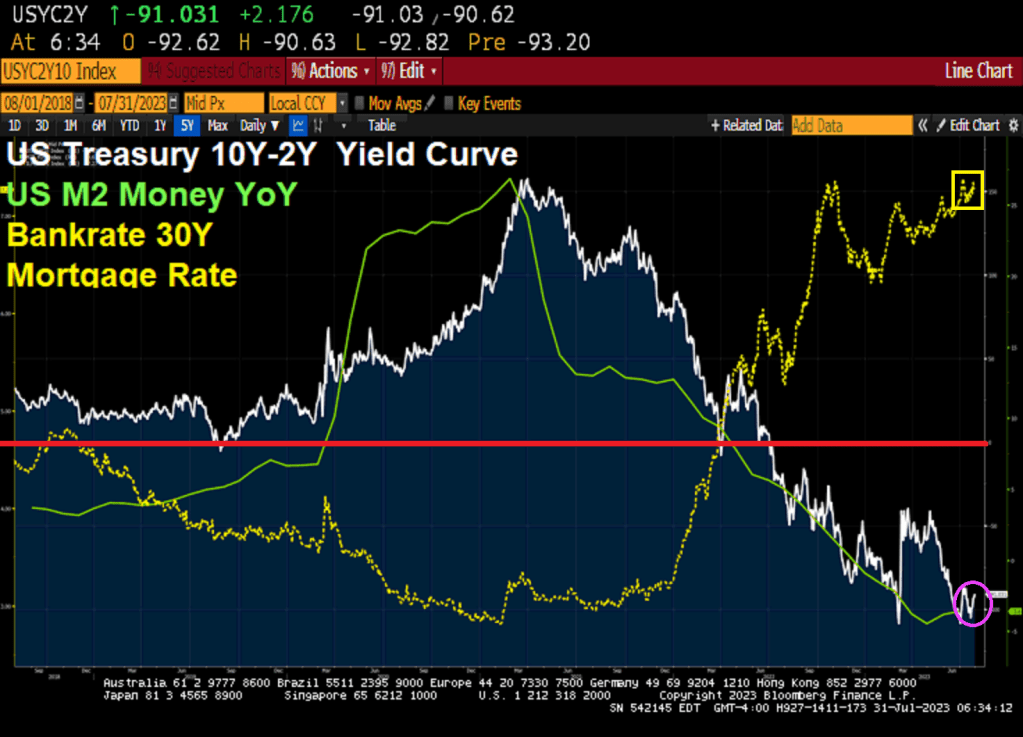
The US Treasury 10Y-2Y yield curve remains deeply inverted at -91.031 basis points and M2 Money growth has crashed. The 30 year mortgage rate is hovering around 7.27%.
Commercial real estate (CRE), particularly office space, reminds me of the Arthur Brown tune “Fire!” except that Jerome Powell of The Federal Reserve is the God of Hellfire! While fighting inflation caused by … The Federal Reserve and insane Federal spending (aka, Bidenomics). Call this the Over, Under, Sideways Down economy. The top 1% are doing quite well, while the lower 50% of net worth households are struggling.
The Q1 2023 NCREIF Office property (value) index shows declining office value since Q2 2022 as The Fed began raising its target rate to combat inflation.
From Trepp, we have this shocking table showing the decline the average total value loss over the span of around a decade. The oldest buildings experienced the largest reduction in value of 60%, and the newest experienced the least (but quite substantial) reduction of 52%. Although the newest buildings performed the best relatively, their 52% value reduction is easily the most concerning, and displays truly how much distress is present in the office sector. This group has the highest percentage of Class A buildings, but its reduction value over the past decade is still approximately on par with buildings constructed over half a century prior. With north of $150 billion in securitized maturities beyond 2023, these trends set a gloomy tone for their future and the performance of office properties as a whole.
Then we have this alarming headline from Trepp: “Commercial Mortgage Sector Faces Another Wall of Maturities as $2.75 Trillion Rolls by 2027.” An estimated $528.7 billion of commercial mortgages mature this year, according to Trepp data, which projects that next year, maturities will increase to $532.8 billion. The projections are based on data for the first quarter compiled using the Federal Reserve’s flow of funds and made various assumptions regarding loan terms for each of the major lender categories. The data would indicate that the market is facing a wall, if not a mountain of maturities that would make the 2015-2017 wall of maturities look almost inconsequential. During that period, roughly $1.1 trillion of loans were scheduled to come due. But attention was focused on the CMBS market, as more than $335 billion of loans were set to mature during the period.
Well, REAL gross domestic income fell -0.8% YoY in Q1 2023 as M2 Money growth crashes. Not a good sign for the US economy or commercial real estate.
Of course, office properties are suffering from almost out-of-control crime in major American cities and the desire of workers to work from home rather than commute to work in cubicles.
But never fear! We have massively corrupt and compulsive liar Joe Biden as President!! He is the President of The 1%! Not the other 99%.
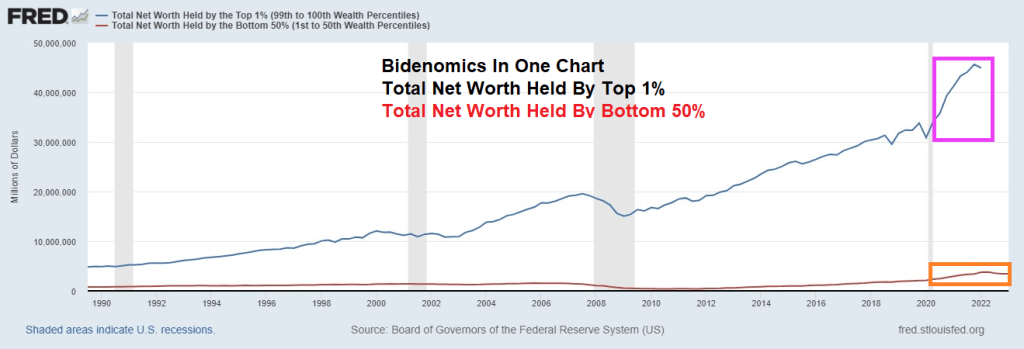
Bidenomics, massive spending on green energy mandates while curbing fossil fuel consumption, has been a true wonder for the top 1% of net worth (let’s call them The Elites). And Bidenomics, like Obamanomics, relied on super generous Federal Reserve money printing.
The result? Total Net Worth held by the top 1% has grown rapidly since the Covid outbreak and Fed monetary expansion (plus Congress going wild spending). The bottom 50%? They improved in terms of net worth
So, The Elites (top 1%) want The Fed to keep on printing money, since their net worth soars.
Meanwhile, US bank credit is crashing as The Fed slows M2 Money growth.
Not only is credit growth grinding to a halt, but unrealized losses on bank investment securities continues to worsen.
If you didn’t see this, then check out House testimony of extraterrestrial visitations to Earth. This has been happening since the 1950s (allegedly), so why NOW is there sudden interest in aliens? Deflection away from the horrible scandal of Biden taking money from foreign actors? Likely answer? Biden and Mayorkas will send Treasury Secretary Janet Yellen to negotiate with alien invaders giving them anmesty, free school, free food, free healthcare and directions on how to register to vote. And giving aliens preferential trade status. All for “10% for The Big Guy!”
The Biden Administration is gushing about Q2’s Real GDP report of 2.4% QoQ. Wow, after trillions of dollars of stimulus spending and The Fed going wild with monetary stimulus, all we got was 2.4% growth??
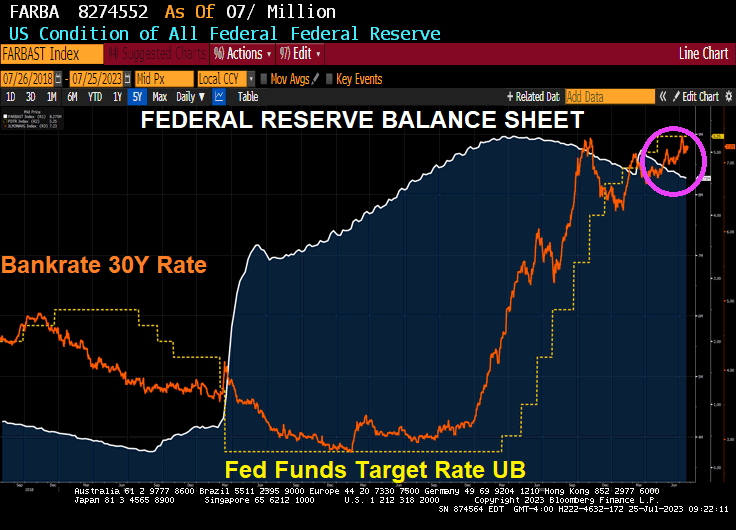
Both The Federal government and Federal Reserve went wild with stimulus surrounding the Covid economic shutdown in 2020. The excessive reaction function is still working its way through the economy and we finally got Q2 Real GDP QoQ of 2.4%! But seriously, is that all we got from an increase in public debt of 39% since January 2020, and M2 Money increased 36%. And, of course, The Federal Reserve double their balance sheet from 2020 to today … and are slow walking its removal. So, with Biden’s insane green spending and Powell’s monetary stimulytpo, all we got was 2.1% Real GDP growth YoY??
And US public debt to GDP is now over 120%, thanks in part to Federal spending and Fed monetary stimulus related to the Covid economic shutdowns.
New home sales in June fell -2.5% from May to June to 697k units sold. But on a year-over-year (YoY) basis, new home sales are up 23.8%. Thanks largely to The Federal Reserve slow walking the shrinking of their massive balance sheet.
Too much monetary stimulus and The Fed’s failure to remove the Covid stimulus is now hitting new home sales.
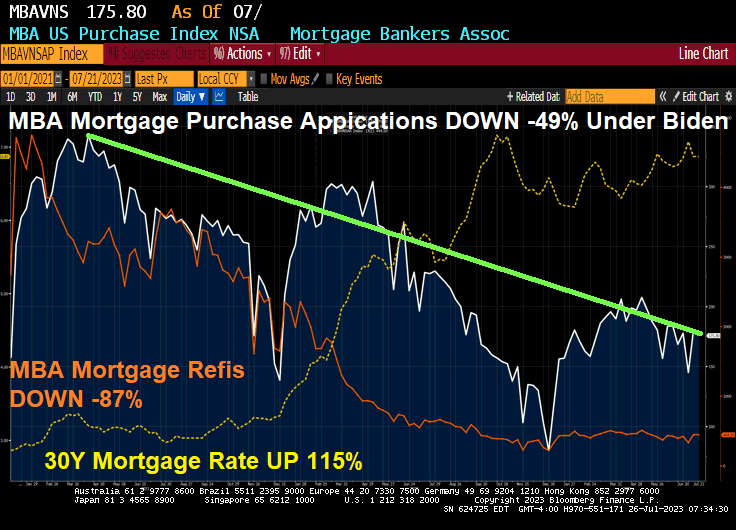
Mortgage applications decreased 1.8 percent from one week earlier, according to data from the Mortgage Bankers Association’s (MBA) Weekly Mortgage Applications Survey for the week ending July 21, 2023.
The Market Composite Index, a measure of mortgage loan application volume, decreased 1.8 percent on a seasonally adjusted basis from one week earlier. On an unadjusted basis, the Index 1.5 percent compared with the previous week. The Refinance Index decreased 0.4 percent from the previous week and was 30 percent lower than the same week one year ago. The seasonally adjusted Purchase Index decreased 3 percent from one week earlier. The unadjusted Purchase Index decreased 2 percent compared with the previous week and was 23 percent lower than the same week one year ago.
Since April 2021, purchase mortgage demand is down -49%, refi mortgage demand is down -87% as mortgage rates are up 115%.
Biden Press Secretary KARINE JEAN-PIERRE: “The American people are beginning to feel Bidenomics”
Prices are up 16.6% and real wages are down 3% since Biden took office.
Well, at least Jean-Pierre didn’t claim like her boss Joe Biden claimed that he “ended cancer as we know it.”
But getting back to Jean-Pierre’s claim that “The American people are beginning to feel Bidenomics.” She is right (for once). Americans are REALLY feeling Bidenomics. And it hurts SO BAD!!!
What hurts so bad? Food (CRB Foodstuffs) are up 56% under Bidenomics. Real weekly wage growth is down -90% since Biden assumed office. Regular gas prices are up 52%. And the 30Y mortgage rate is up a staggering 153%. Yes, Karine, this hurts so bad!
While real wages are down -3% under Biden and the real average weekly wage growth is down -90%. That REALLY hurts so good.
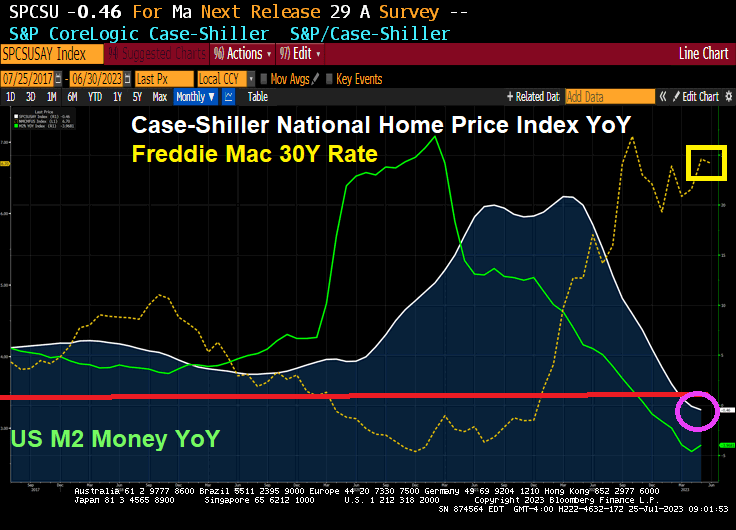
The Case-Shiller home price numbers are out for May. The national home price index is down -0.46% YoY as The Fed slows M2 Money growth into negative growth territory. No doubt Biden (and Karine Jean-Pierre) will take credit for slowing home price growth, although The Federal Reserve slowing monetary stimulus is mostly responsible.
The Fed is still slow walking shrinking its enormous balance sheet. Although The Fed is cranking up their target rate.
The Taylor Rule suggests a 10.42 target rate to cool inflation. They are only half way there!!!


You must be logged in to post a comment.