M2 Money Velocity (GDP/M2 Money) peaked in Q3 1997, but after several bouts of Fed money printing, M2 Money Velocity is near the all-time low at 1.1216 In Q1 2022. And M2 Money stock is still growing at a torrid pace of 9.9% YoY. But the massive overreaction of The Federal Reserve in response to the Covid outbreak has led to near zero money velocity.
Now with The Federal Reserve considering removing the monetary stimulus, what will happen to US GDP left to survive on its own?
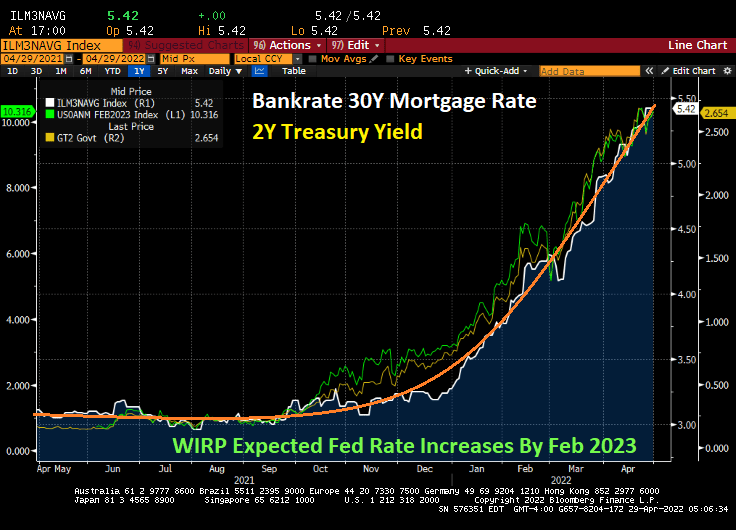
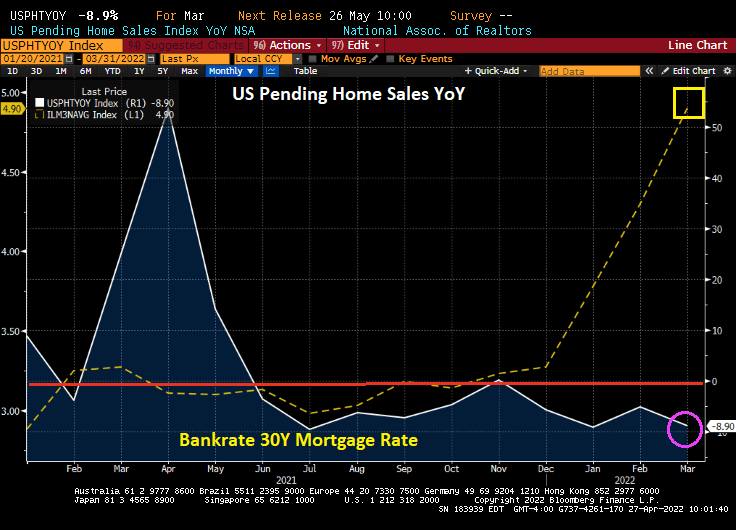
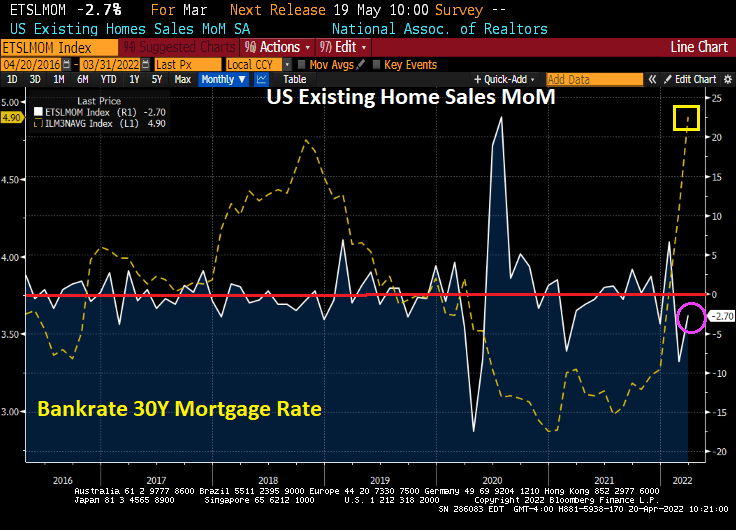
An example of how The Fed’s expected tightening of monetary policy can be seen in the meteoric rise in mortgage rates.
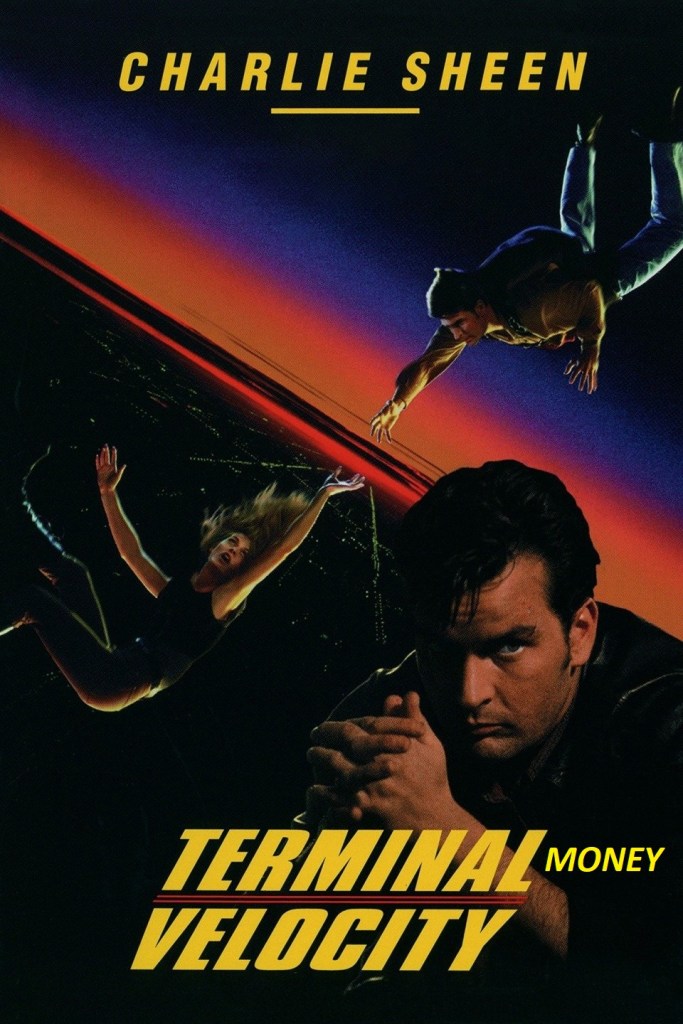
So, the US has hit terminal money velocity. I wish The Fed lots of luck going forward.
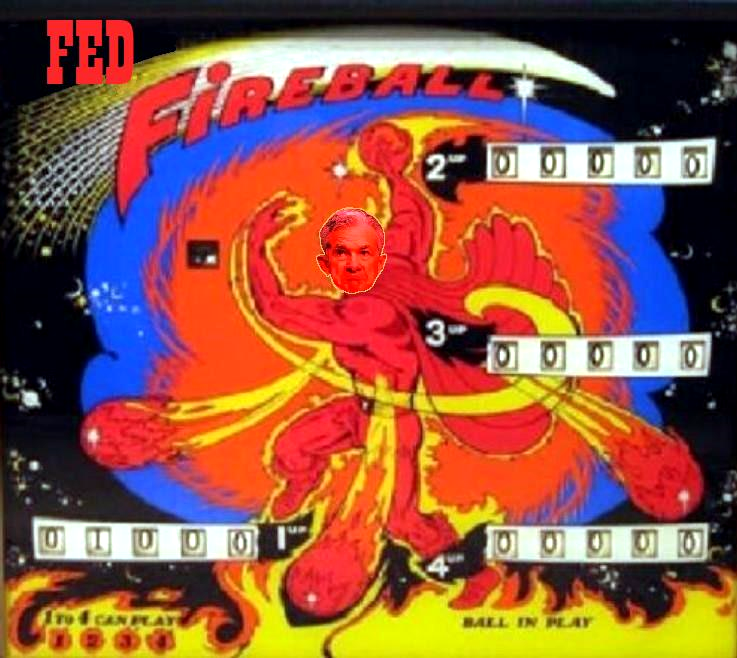
Is Charlie Sheen the Chairman of The Federal Reserve Board of Governors?? That must be Lael Brainard falling out of the sky with Charlie Sheen (aka, Jerome Powell).
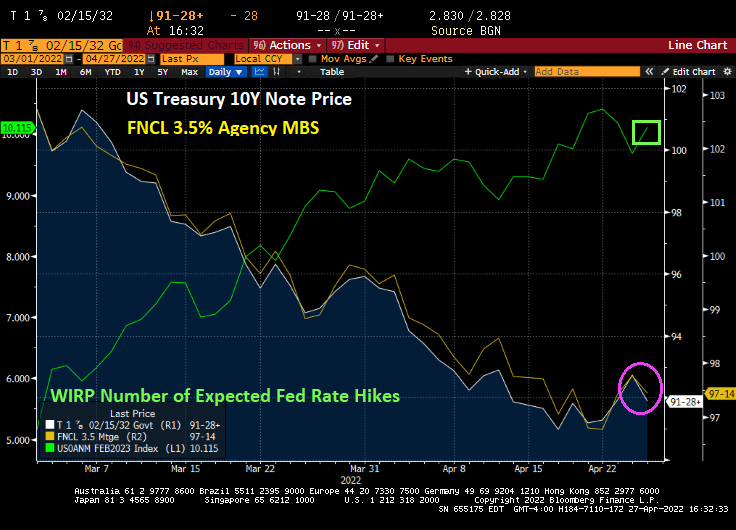
Particularly if you are a pension fund and hold US Treasuries and Agency Mortgage Backed Securities.
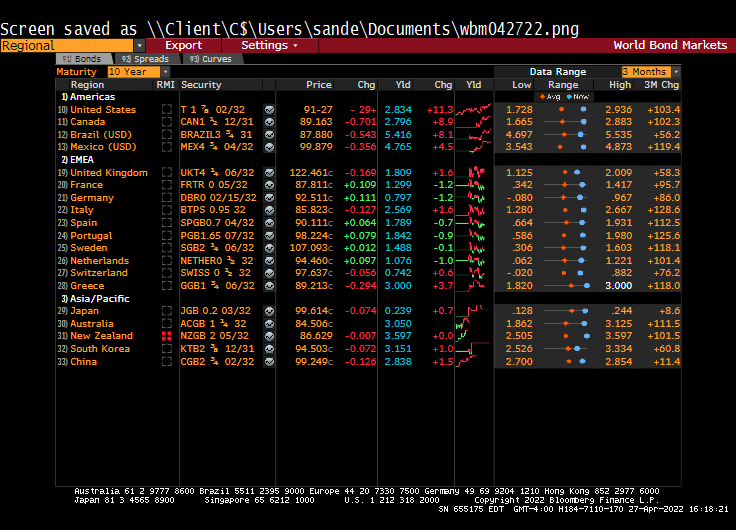
The bad news is that the 10-year US Treasury Note declined in price, sending the yield up over 10 bps today.
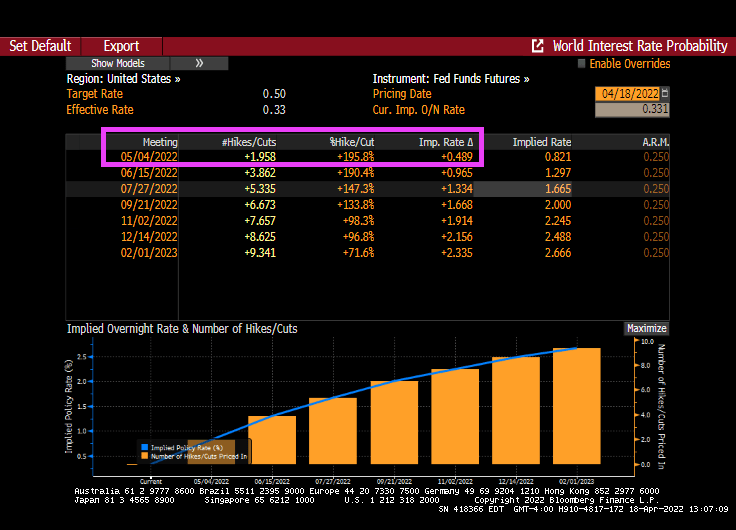
As The Fed is projected to raise its target rate over 10 times by February 2023, 10-year Treasury Note prices and agency MBS 3.5% prices continue to decline.
Heartaches in heartaches. US GDP growth for Q2 has stumbled to 0.446% as The Fed is launching quantitative tightening (QT) to fight the inflation that they caused in the first place.
According to the Atlanta Fed’s GDPNow real-time GDP tracker, US GDP growth has stumbled to a meager 0.446%. Despite the massive stimulus from The Federal Reserve and Washington DC’s massive fiscal stimulus.
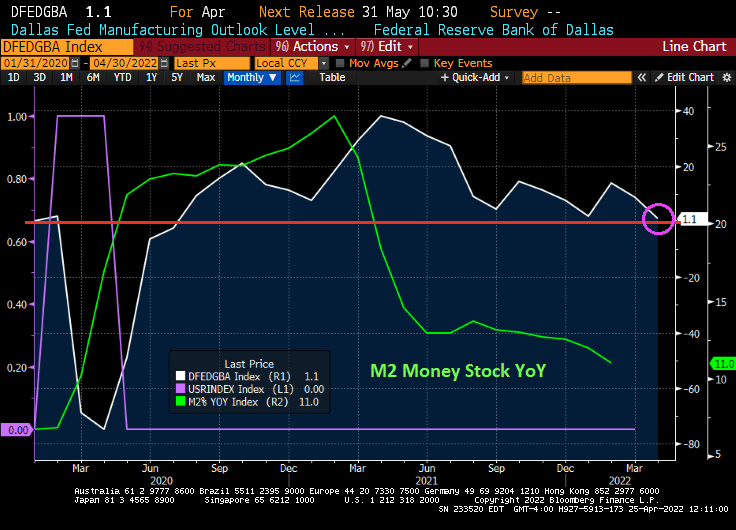
M2 Money stock YoY skyrocketed during the Covid mini-recession, peaking at 21% during February of 2021. The Dallas Fed manufacturing outlook grew to 38.1 in March 2021.
However, as M2 Money growth has slowed 11%, the Dallas Fed manufacturing outlook has plunged to near zero.
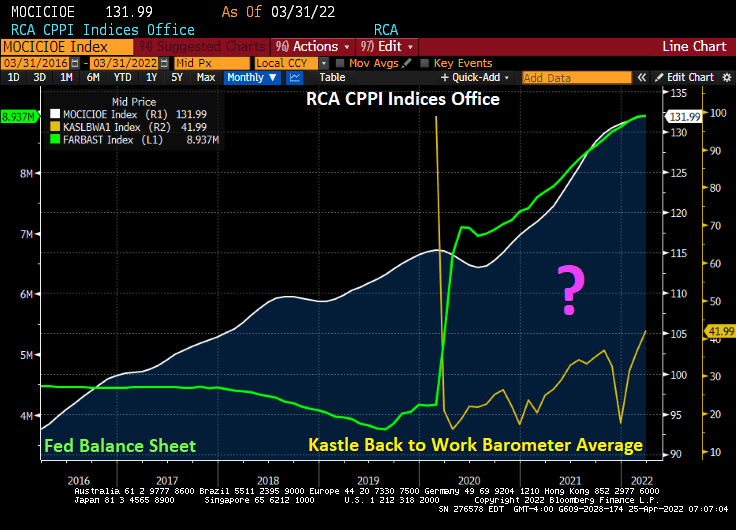
Do you want to see a magic trick? Like how governments shut down the US economy resulting in collapsing office occupancy rates while the price of office buildings rose dramatically (+16.3% since Q2 2020)?
Kastle’s “Back to work barometer” is showing that the 10 city average occupancy rate in the US is now only 42.8% as remote working has caught on. And the fear of yet another Covid mutation is keeping office occupancy below 50%.
Even Washington DC, home of Dr. Anthony Fauci, has only a 37.5% occupancy rate. Of the top 10 cities, Austin TX has the highest office occupancy rate at 62.4%.
So, the magic trick is not why America is so slow to return to the office, but why commercial office prices are rising so fast. Ah, Federal government STIMULYTPO! Aka, The Federal Reserve has been overstimulating the economy since 2008 and particularly since 2020 and Covid.
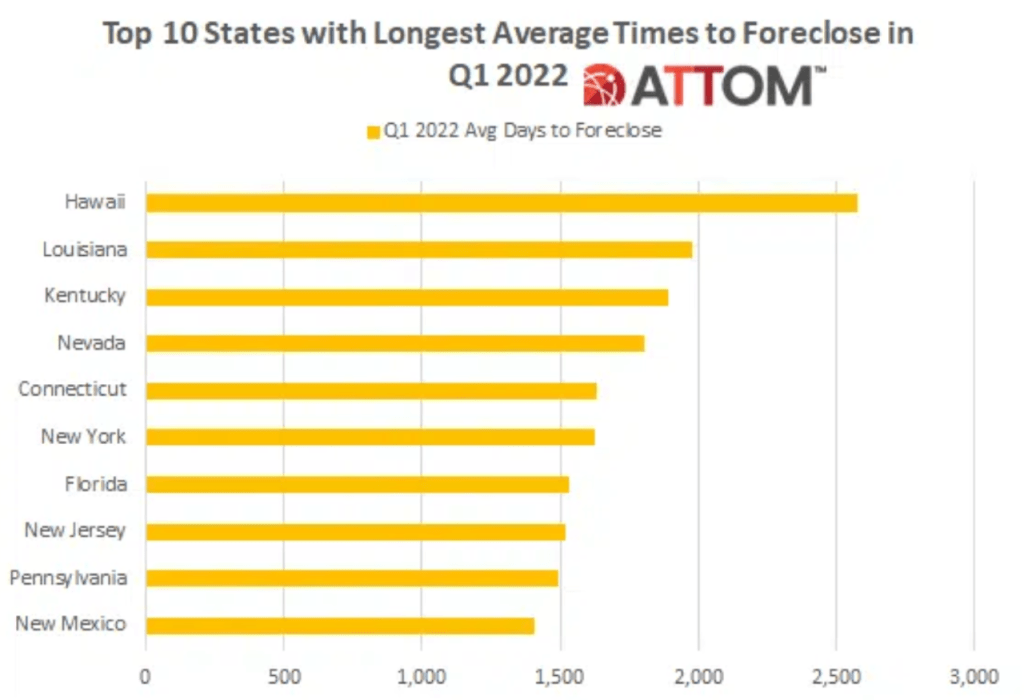
Speaking of a magic trick, here is how government’s make the average time to foreclosure up to over 7 years in Hawaii and 4.4 years in New York. In simple terms, you can buy a home in New York, never make a mortgage payment and live rent free for an average of 4.4 years.
So, the government’s magic trick is to 1) shut down local economies in fear of Covid, 2) provide excessive fiscal and monetary stimulus to combat the shutdown, 3) watch office building prices soar with stimulus as office occupancy remains below 50%.
Do you want to see a magic trick? Watch The Fed try to tighten monetary easing and NOT crash the economy.
Update for 04/25/2022. 10Y Treasury yields DOWN 8.7 bps.
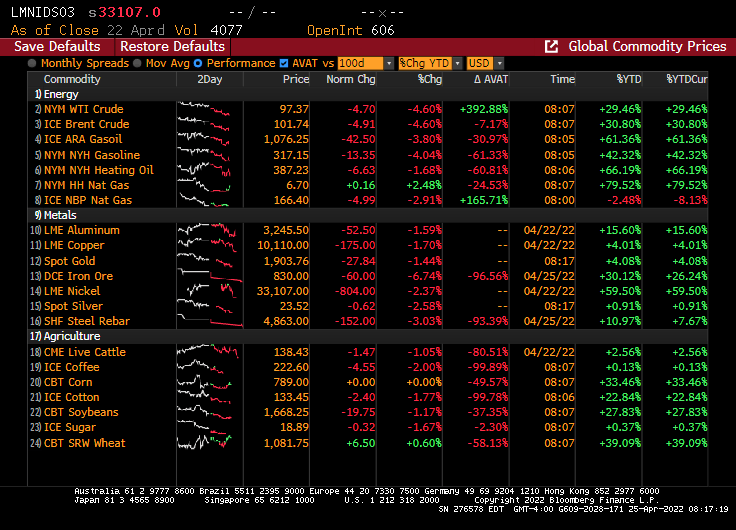
And commodities are tanking. WTI oil is down 5%, iron ore is down almost 7%.
And the Dow is diving with increased expectations of Fed monetary tightening, but the expectations (green line) have been declining this morning.
Its Saturday and I am dreading markets opening on Monday. But here is where we sit today.
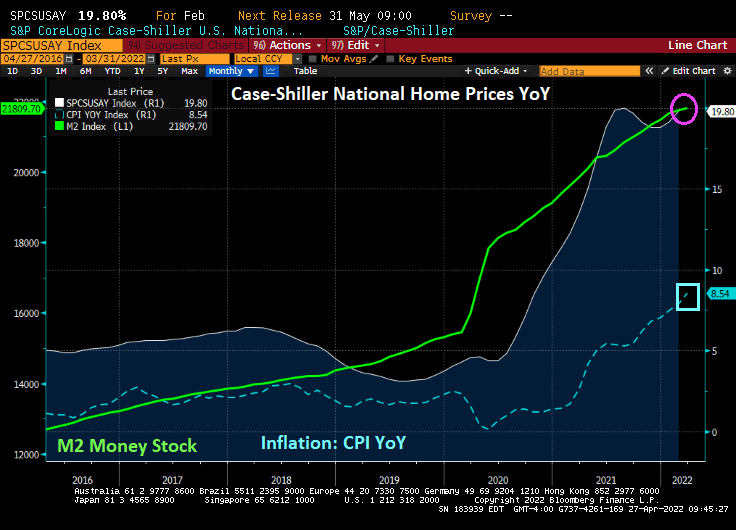
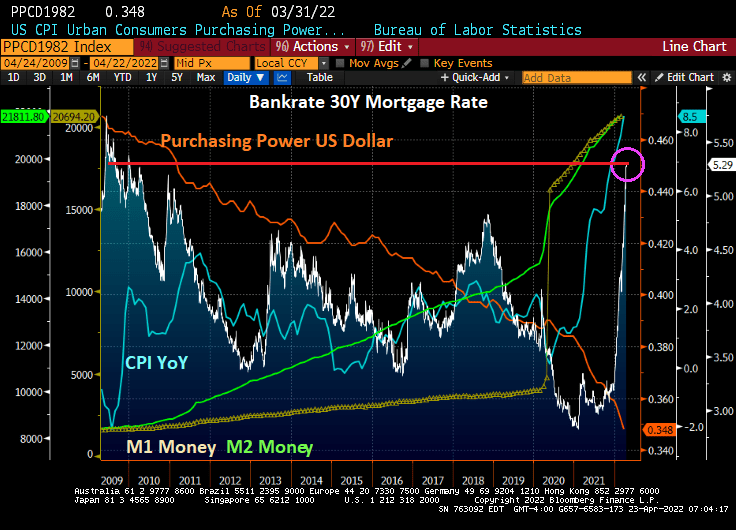
The 30-year mortgage rate has soared to 5.29%, the highest level since 2009 at the beginning of Obama’s Presidency. Since 2009, we have seen the purchasing power of the US Dollar decline further (orange line) while inflation (blue line) has soared. M1 (yellow) and M2 (green) has been growing since the financial crisis, but really took-off with the Covid outbreak in 2020 and The Fed’s massive overreaction coupled with Federal government stimulus.
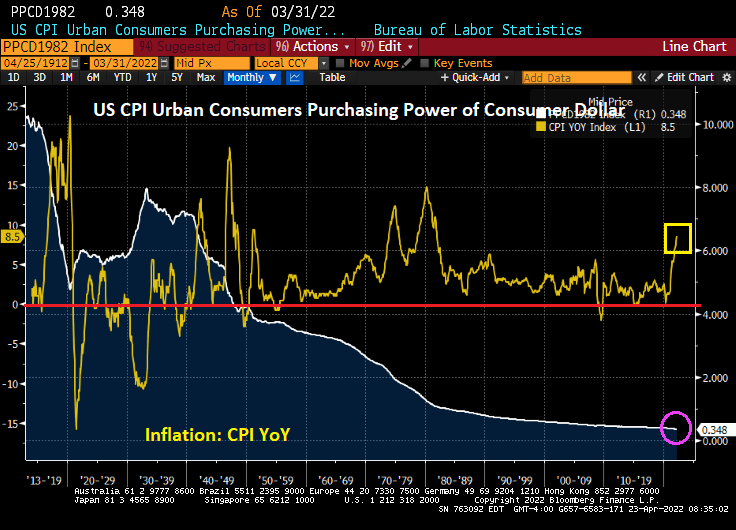
Since the creation of The Federal Reserve System under President Woodrow Wilson, the purchasing power of the US Dollar has collapsed so much that $10 in 1913 in worth 34.8 cents today. But notice that since 1949, the CPI YoY has rarely been negative meaning that prices are pretty much only going up.
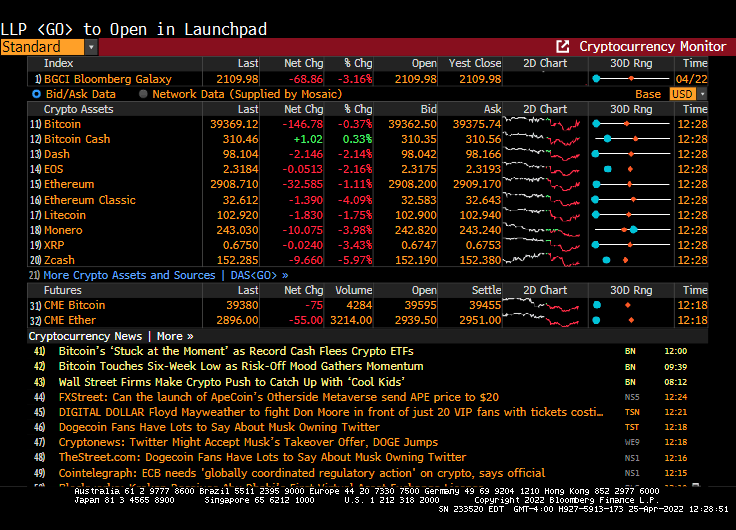
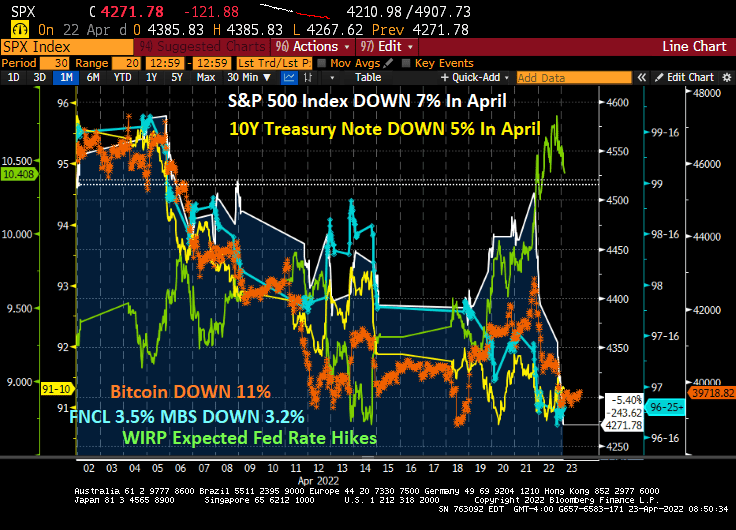
Instead of April showers bring May flowers, it is April expected Fed rate hikes (now 10.408 rate hikes by February 2023) bringing declining assets prices. In April so far, the S&P 500 index is DOWN 7%, the 10-year Treasury Note price is DOWN 5%, Bitcoin is DOWN 11%, the 3.5 coupon agency MBS price is down 3.2%.
We are seeing increased volatility in both the equity and bond markets.
Well, Powell and The Fed are hurling fireballs at mortgage rates and asset prices in April.
Under President Biden’s Reign of Error, inflation is the highest in 40 years. But Powell and The Fed are still overstimulating the economy, and Congress is contributing to the inflation disaster with short-sighted political policies and spending (flooding the economy with stimulus spending helping to drive up prices). Even Democrat US Senator Elizabeth Warren gets it.
Here is Biden’s inflation scorecard in one chart. Under Inflation Joe, foodstuffs are up 58%, gasoline is up 72%, diesel fuel is up 154%, and green energy element Lithium is up 645% (no wonder electric car manufacturer Telsa is raising their prices 10%). Of course, The Federal Reserve keeps on expanding its balance sheet, UP 50.3% under Inflation Joe.
House price growth is up 69% and the 30-year mortgage rate is UP 83.3% and currently is at 5.28%. The orange line is the growth path.
Yes, prices have risen even more after Russia Invaded Ukraine on February 24, 2022. But most of the inflation was baked-in prior to the Russian invasion. Sorry Jen Psaki, but you are wrong about inflation being all Putin’s fault.
The Covid epidemic was bad enough with the government shutdowns and deaths. But was even worse is that all the Fed monetary stimulus and Federal government stimulus “relief” led to a reversal of fortune. In that, the share of net worth held by the top 1% grew and the gap between the 1% and bottom 50% hit an all-time high.
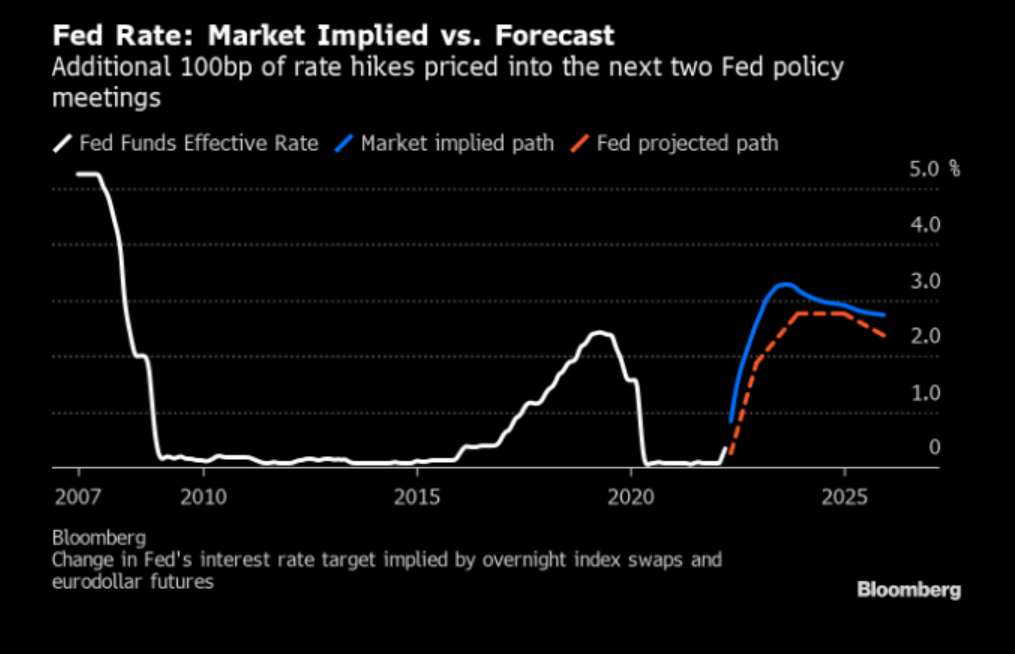
Now that the 1% have fed at the Federal trough, The Fed is anticipated to raise rates by 100 basis points at the next two meetings.
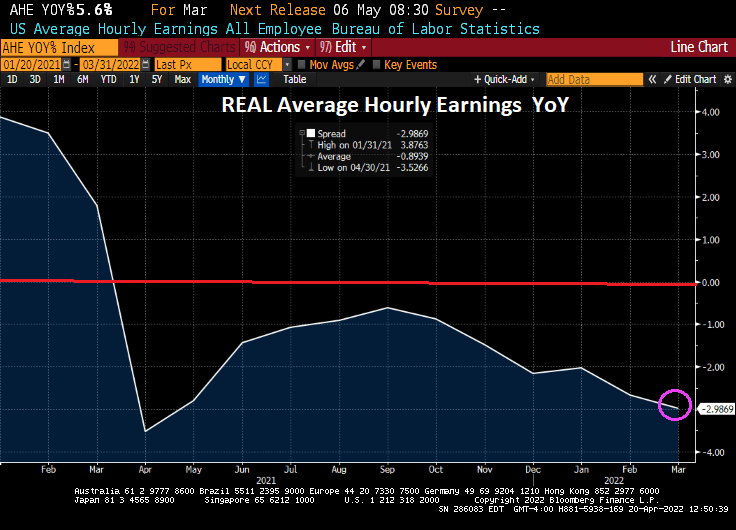
Remember, REAL average hourly earnings are getting crushed under Biden and his pro-1% policies.
This is a nightmare for the American middle-class and lower-wage households.
Fortunately, I refinanced my home mortgage while Trump was still President. When Biden was installed as President, the 30-year mortgage rate was 2.88% (according to Bankrate). It has now risen to 5.25%.
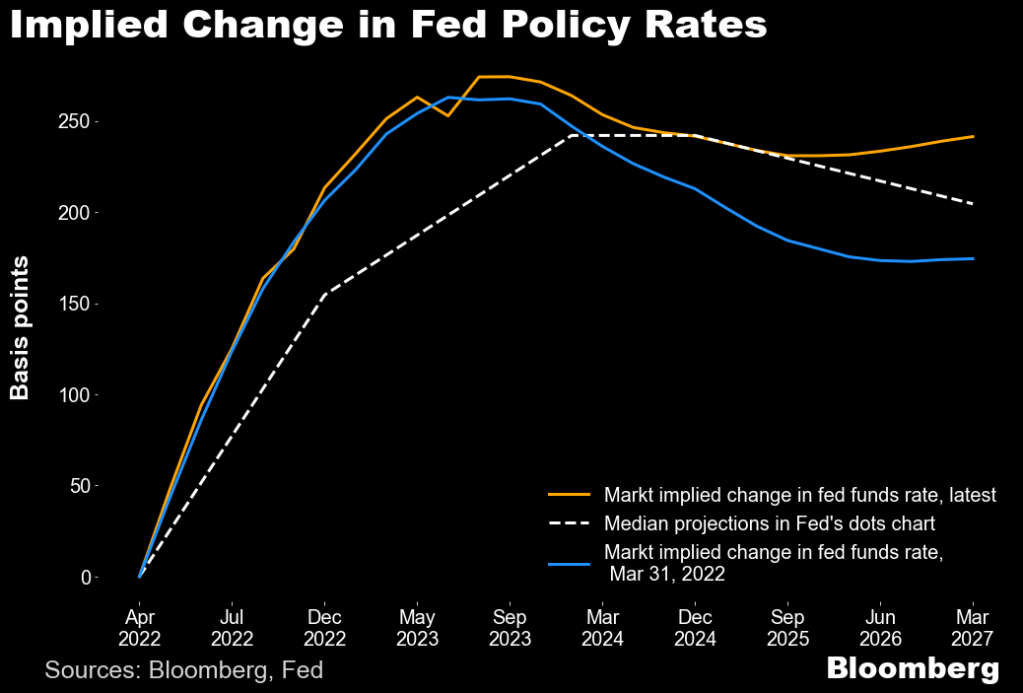
The Federal Reserve is now expected to raise their target rate as much as 50 basis points at the next meeting on May 4, 2022. This chart shows the anticipated rate hikes coming our way, peaking in summer 2023.
Fed Funds Futures are pricing in a 50 bps rise at the May meeting.
The good news is that the US Treasury actives curve is upward sloping, but is showing fatigue in the forward rates between 7Y and 10Y.
On the hard asset front, precious metals are up over 1% with silver and platinum leading the way.




















 Confounded Interest - Anthony B. Sanders
You must be logged in to post a comment.