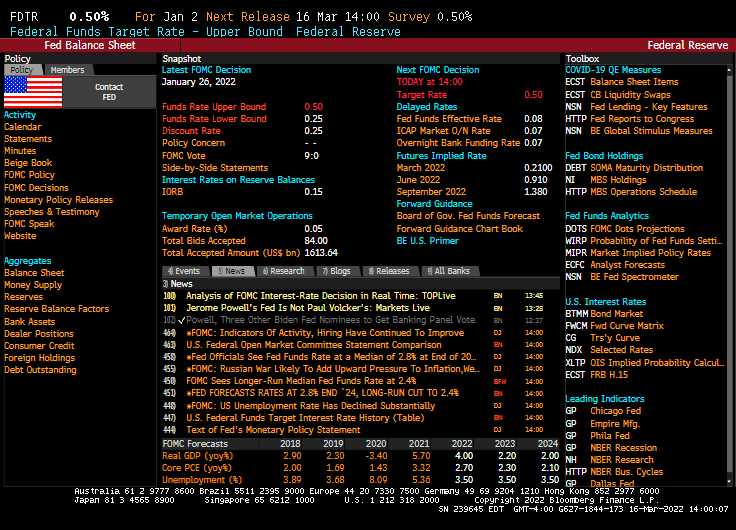
So, The Federal Reserve raised their target rate by … as expected … 25 basis points to 50 basis points.
The Taylor Rule suggests that the target rate should be 11.96%. So, Powell and The Gang are getting closer! /sarc
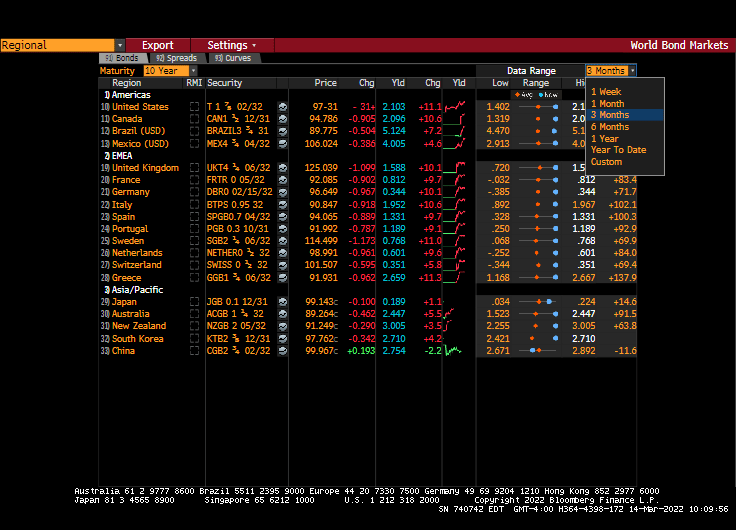
The short-term reaction to the measly rate increase? The Dow declined (but still in positive territory for the day) and the benchmark 10-year Treasury yield spiked to 2.23%.
On Powell’s surrender to inflation, the US Treasury 10Y-2Y curve continued to flatten.
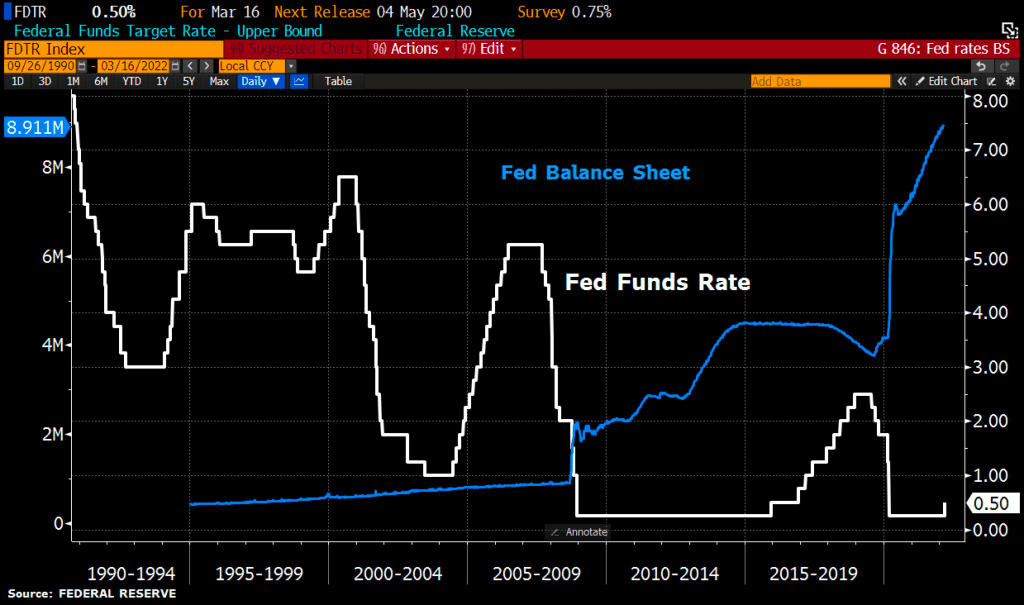
You can see The Fed’s sloth-like response to blood-curdling inflation in the lower right-hand part of the chart.
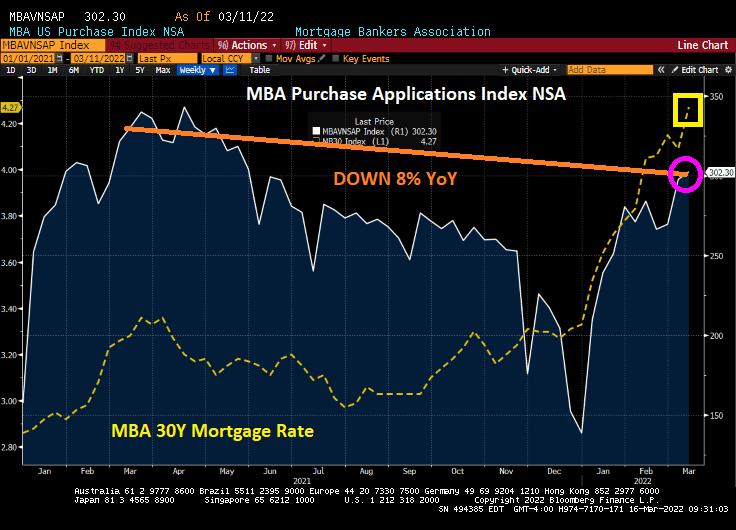
Mortgage applications decreased 1.2 percent from one week earlier, according to data from the Mortgage Bankers Association’s (MBA) Weekly Mortgage Applications Survey for the week ending March 11, 2022.
The seasonally adjusted Purchase Index increased 1 percent from one week earlier. The unadjusted Purchase Index increased 2 percent compared with the previous week and was 8 percent lower than the same week one year ago.
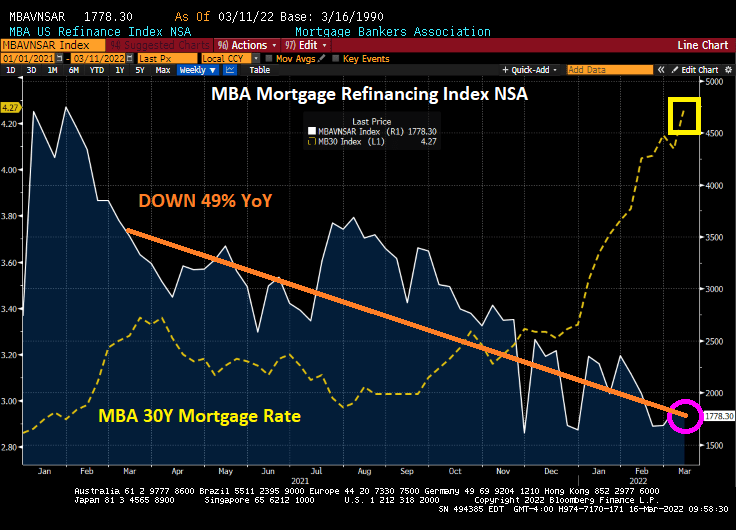
The Refinance Index decreased 3 percent from the previous week and was 49 percent lower than the same week one year ago.
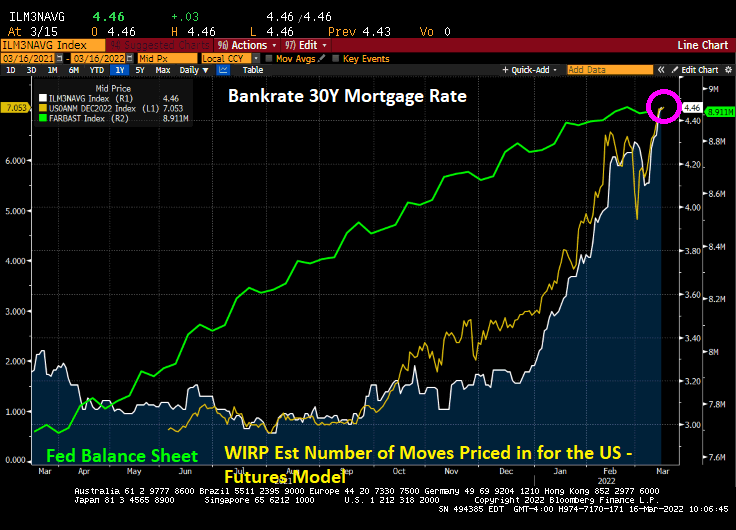
Bankrate’s 30-year mortgage rate has surged to 4.46%.
Here is a photo of alligators in Great Falls, Virginia, up-river from Washington DC. They are likely congregating for the Fed Open Market Committee (FOMC) announcement today.
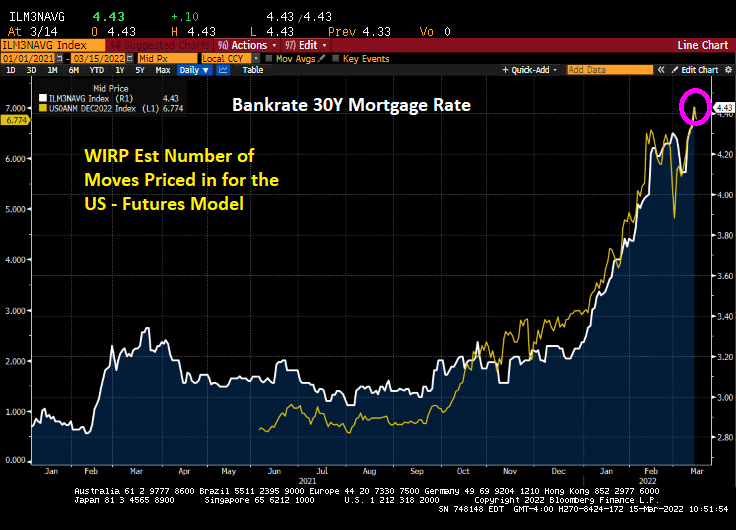
Bankrate’s 30-year mortgage rate rose to 4.43%, up 55% under Biden/Pelosi/Schumer’s reign of error. Thanks to the rising Fed rate hikes priced-in the market.
The US Producer Price Index (PPI) final demand rose 10% YoY in February, further evidence of spiraling inflation under Biden/Pelosi/Schumer’s reign of error.
And speaking of Senate Majority Leader Chuck Schumer (D-NY), the Empire State Manufacturing Survey (General Business Conditions) crashed to -11.8.
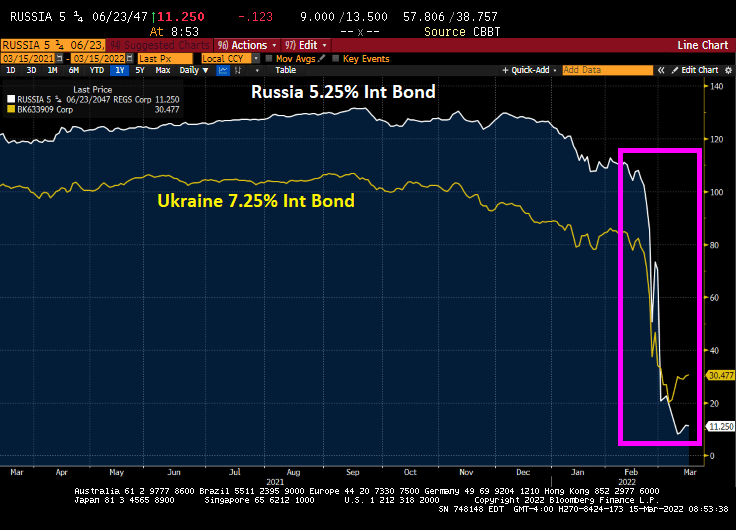
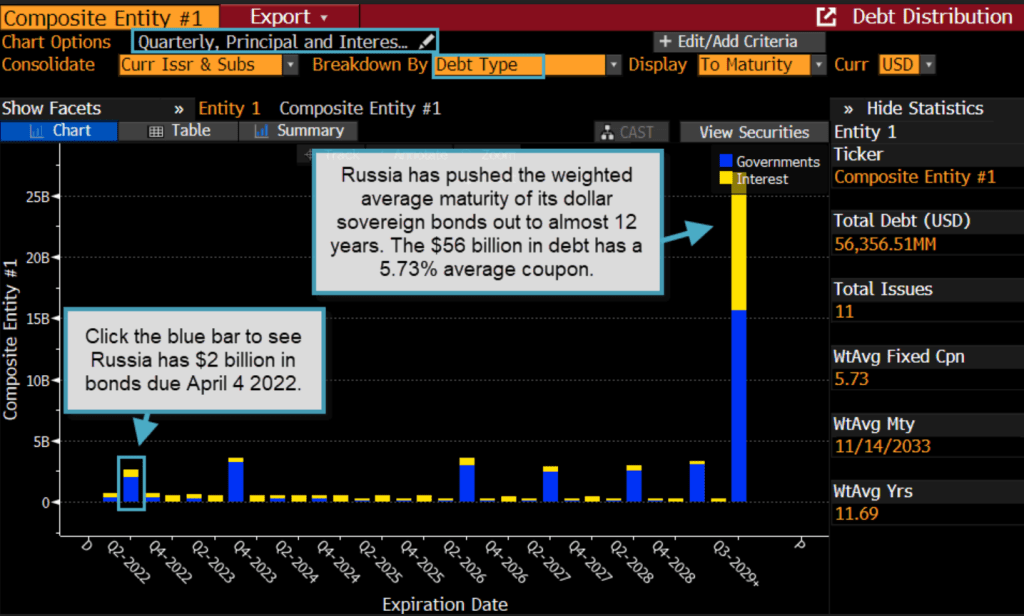
And Russia is losing the economic demolition derby with Ukraine (at least for sovereign debt).
I am still trying to figure out what House Speaker Nancy Pelosi (D-San Francisco) meant by “When we’re having this discussion, it’s important to dispel some of those who say, well it’s the government spending. No, it isn’t. The government spending is doing the exact reverse, reducing the national debt. It is not inflationary.”
Really Nancy?
Here is a chart of Federal government outlays and inflation. Massive expenditures and growth in Federal debt and the resulting inflation. Nancy?
Yes, it is the much anticipated Fed Week! The Fed Open Market Committee (FOMC) will announce it decision (probably the first rate hike under Biden of 25 basis points).
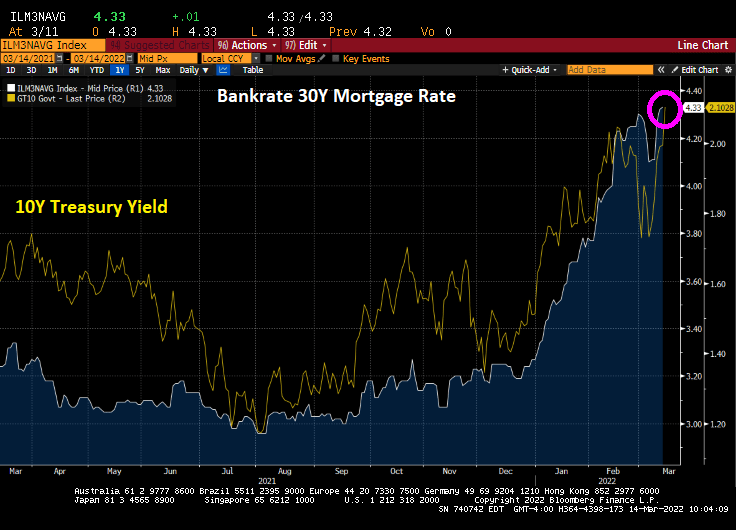
This morning, the 10-year Treasury yield rose by 11.1 basis points and the Bankrate 30Y mortgage rate rose to 4.33%.
Actually, sovereign yields are up around 10 basis points in the US, Canada, and across the pond.
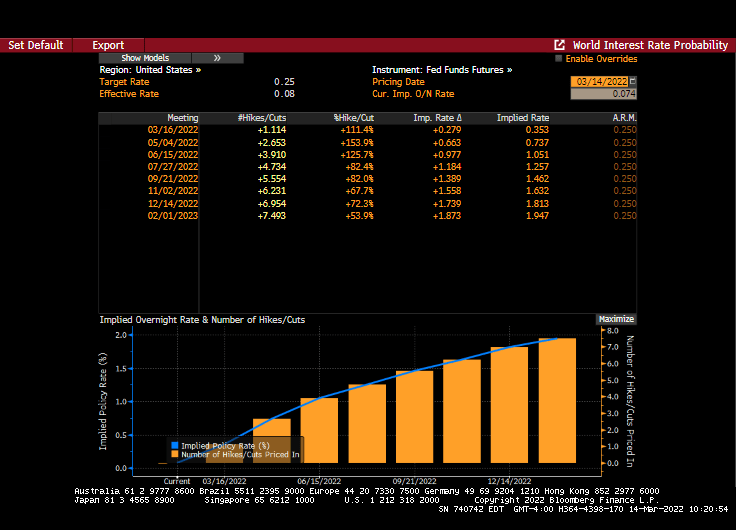
Fed Funds Futures are pointing to 7 rate hikes over the next year with 1.114 rate hikes on Wednesday. That means The FOMC may raise rates MORE than the 25 basis points expected my many (including me).
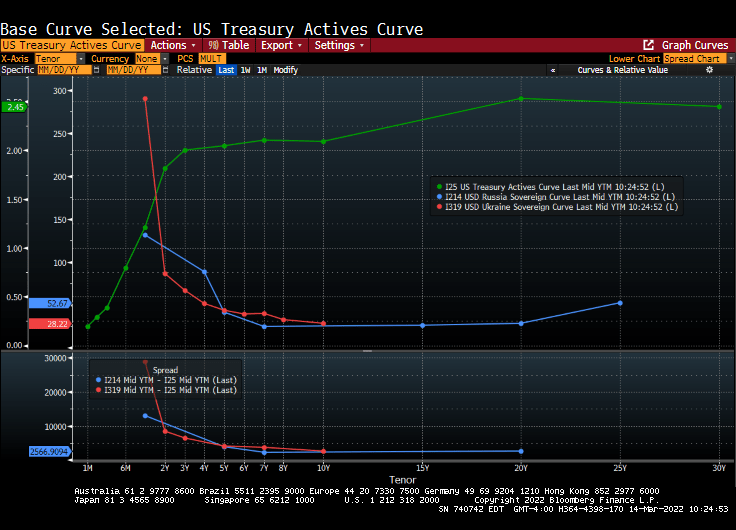
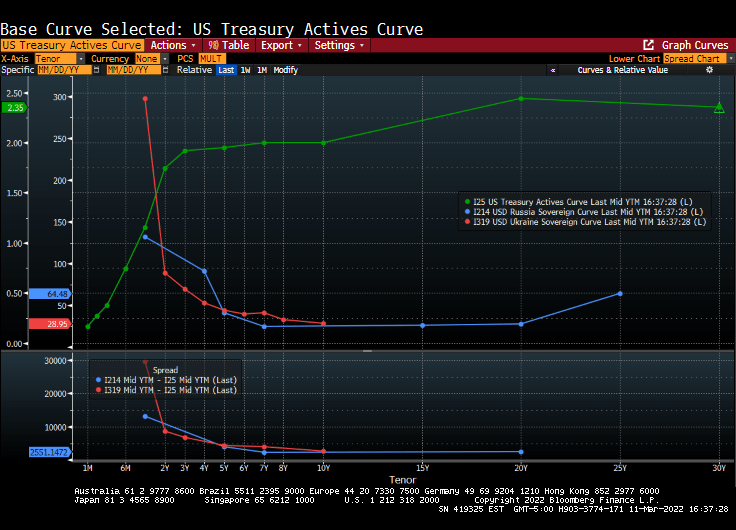
The US Treasury actives curve remains steeply upward sloping while both the Russian and Ukraine sovereign curves are steeply inverted and crashing.
Russia has pushed the weighted average maturity of its dollar sovereign bonds out to almost 12 years.
The most hilarious headline of the day is a Bloomberg opinion piece: “Fighting Inflation May Require the Fed to Be Brutal: Clive Crook” How about the Biden Administration relaxing oil drilling and pipeline restraints? Otherwise, brutal translates into causing a recession. Great suggestion, Clive! … NOT!
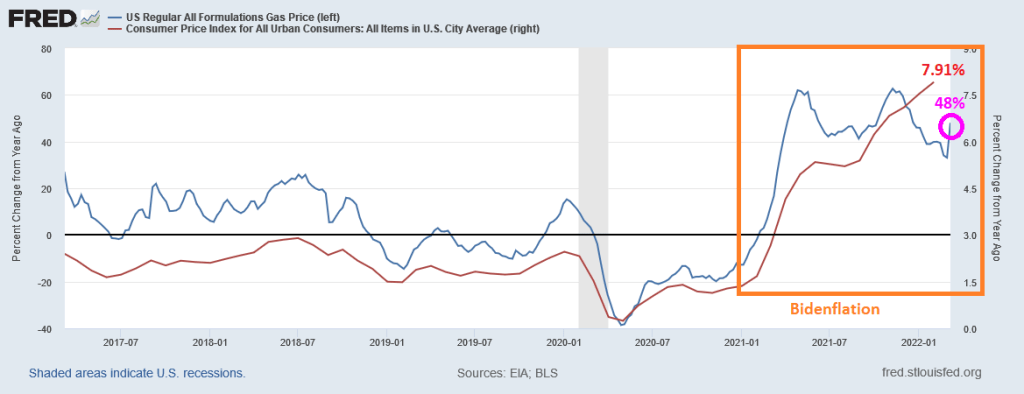
Well, so much for rising gasoline prices being the fault of Vlad “The Ukrainian Impaler” Putin and Russia invading Ukraine. In fact, gasoline prices were rising at a 62% YoY pace in April 2021, well before Russia’s invasion of Ukraine.
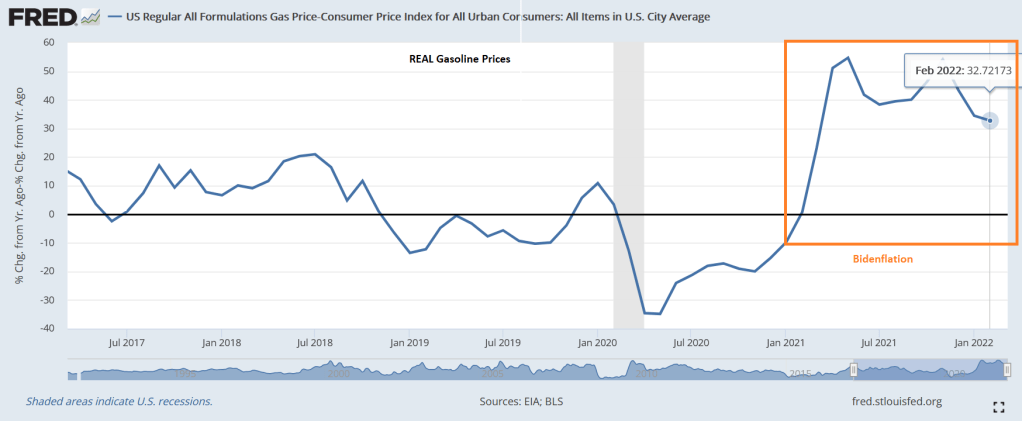
REAL gasoline prices (nominal gasoline prices less inflation) are up 32.72% YoY in February.
Press secretary Jen Psaki can take the opportunity to proclaim that REAL gasoline prices have actually declined in February.
I keep waiting for the Biden Administration and Congress to launch price controls and supply rationing rather than simply allow the Keystone Pipeline to be built and allow drilling on Federal lands.
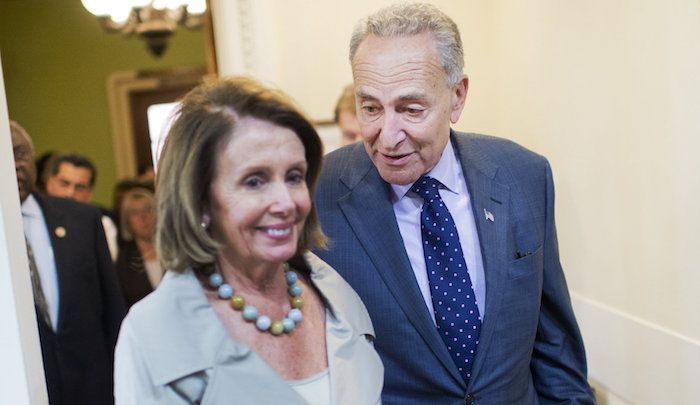
US Speaker of the House and American Oligarch Nancy Pelosi together with Senate Majority Oligarch Charles Schumer passed yet another massive spending bill that seemingly benefited them and not the American middle class.
This legislation would provide $774.4 million for the Members Representational Allowance, known as the MRA, which funds the House office budgets for lawmakers, including staffer salaries. This $134.4 million, or 21 percent, boost over the previous fiscal year marks the largest increase in the MRA appropriation since it was authorized in 1996, according to a bill summary by the House Appropriations Committee. For paid interns in member and leadership offices, the House would get $18.2 million.
This is especially unfortunate given at inflation is growing at 7.9%. If we remove food and energy (two important categories for consumers and retirees), core inflation is growing at 6.4% YoY. As such, Social Security COLA doesn’t even keep pace with CORE inflation, let alone food and energy costs.
In August, Speaker Nancy Pelosi announced staffers’ salaries could exceed those of lawmakers. Members in both the House and Senate, with the exception of leadership, make an annual salary of $174,000. Staffers can make up to $199,300.
After an 11-year drought, congressional earmarks are back with vengeance.
The $1.5 trillion, 2,741-page omnibus spending package is loaded with funding for lawmaker pet projects, some of which could help incumbents in this fall’s elections.
The legislation includes more than 4,000 earmarks, according to a list of projects provided to The Hill by a Senate Republican aide that spanned 367 pages.
One of the biggest winners was New York — thanks to Senate Majority Leader Charles Schumer (D-N.Y.), who is up for reelection this year.
Schumer’s name is attached to 59 earmarks totaling nearly $80 million in the omnibus’s transportation and housing and urban development (HUD) section alone, according to a review by The Hill. He successfully requested funding for the projects either individually or with other lawmakers from his home state.
Is wild-spending Pelosi actually “The Bride of Chucky (Schumer)”?
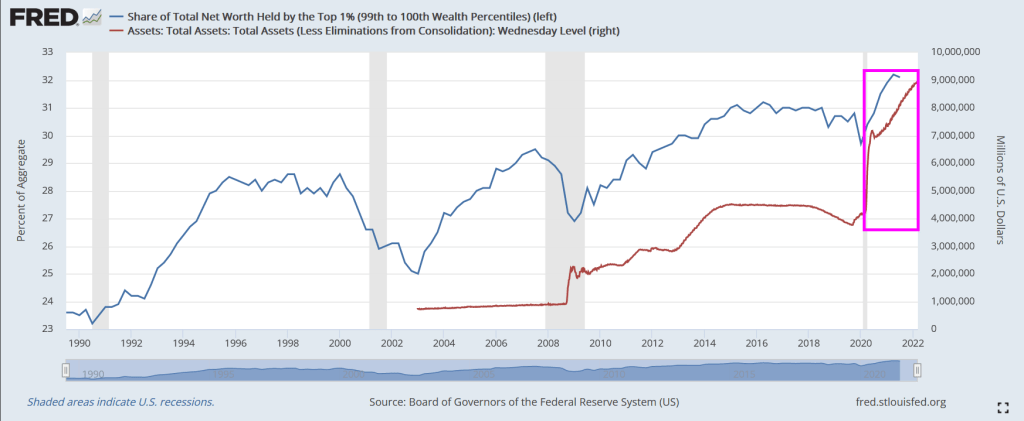
Following the financial crisis of 2008/2009, The Federal Reserve began their dramatic purchase of assets such as Treasuries and Agency mortgage-backed securities (AgencyMBS). And then Covid struck and The Fed went berserk with asset purchases.
So, who benefited the most? The top 1% or the bottom 50%?
Answer? The top 1%. The share of total net worth spiked dramatically after the Fed infusion.
Even the bottom 50% benefited with The Fed’s Covid stimylpto, but no where near how the top 1% benefited.
World Economic Forum’s elitist Klaus Schwab approves of this message!
On an unrelated note, the US Treasury yield curve is strongly UPWARD sloping, while Russia’s and Ukraine’s yield curves are inverted and collapsing.
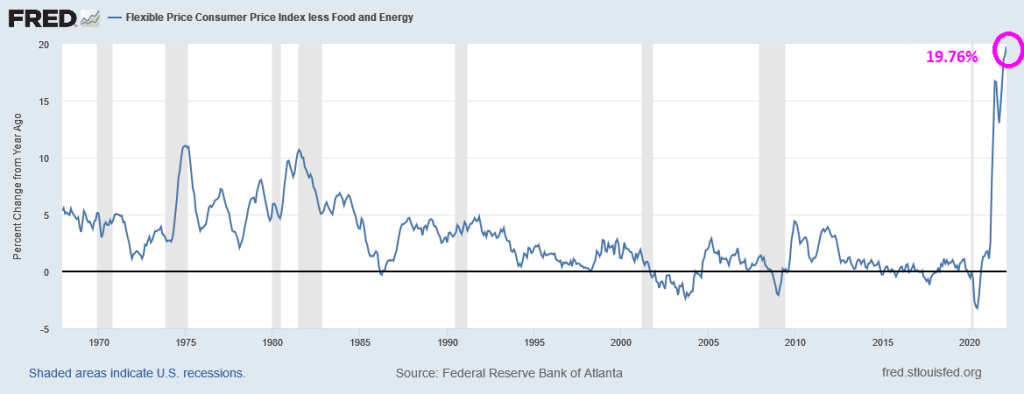
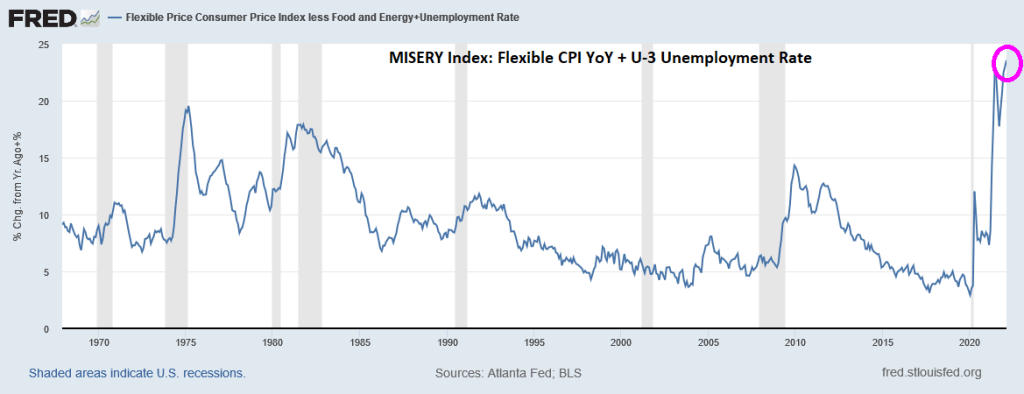
The flexible cut of the CPI—a weighted basket of items that change price relatively frequently—increased 19.76 percent (annualized) in February.
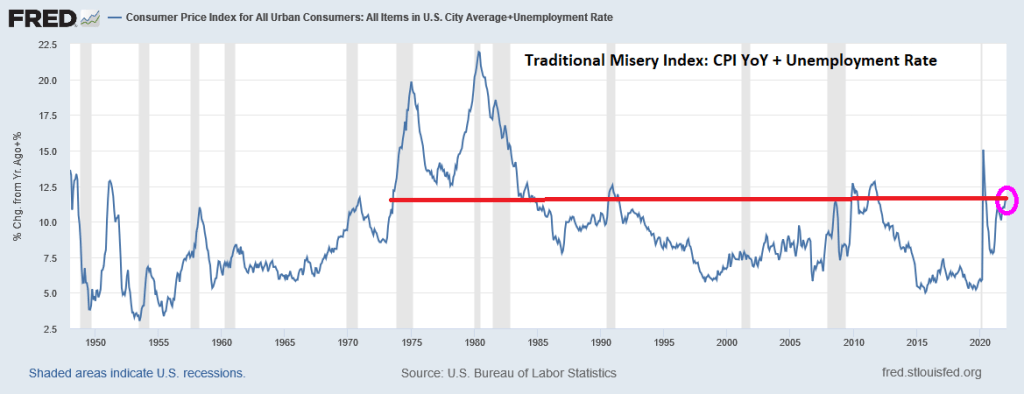
If we added the U-3 unemployment rate, we get a MISERY Index under Biden of 23.56%, the highest in modern history. Worse than Carter-era inflation and malaise.
Bear in mind that the traditional use of the misery index is CPI YoY + U-3 unemployment rate, we see that Biden’s misery index is similar to the early years of Obama (following the financial crisis) but lower than the Ford/Carter years.


You must be logged in to post a comment.