No, Joe Biden isn’t Joltin’ Joe Di Maggio (the Yankee Clipper). Joe Biden is a Socialist who loves government and hates free markets. I feel like Biden and his junta are emuilating the old Soviet Union and Communism. Those of us who still love free markets are back on the chain gang.
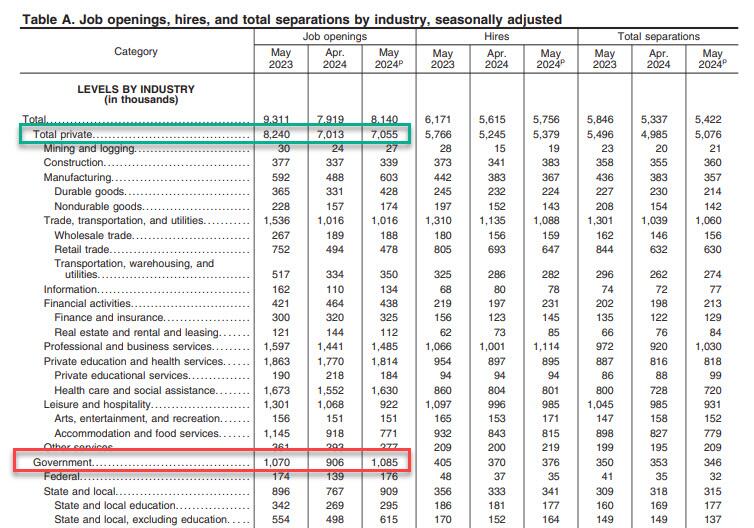
After two months of sharp declines in the number of job openings, moments ago Biden’s highly politicized Department of Labor reported that in May, the number of job openings unexpectedly spiked by a whopping 221K, to 8.140 million – far above the 7.950 million estimate – from a downward revised April print of 7.919 million, down 140K from the original print of 8.059 million.
Job revisions aside, there was only a 2.8% increase in private sector job openings in May. On the other hand, nonproductive job openings (aka, government) were up a staggering 20% in May.
C’mon man, hiring government workers doesn’t grow the economy in an organic way. Just a Soviet way.
Gimme two steps to sell my house. Are people getting out of dodge?? Calfornia Gpvernor “Greasy Gavin” Newsom sold his Sacramento home and moved to Marin County for better schools. Sacrramento active housing inventory is up 65.6% YoY.
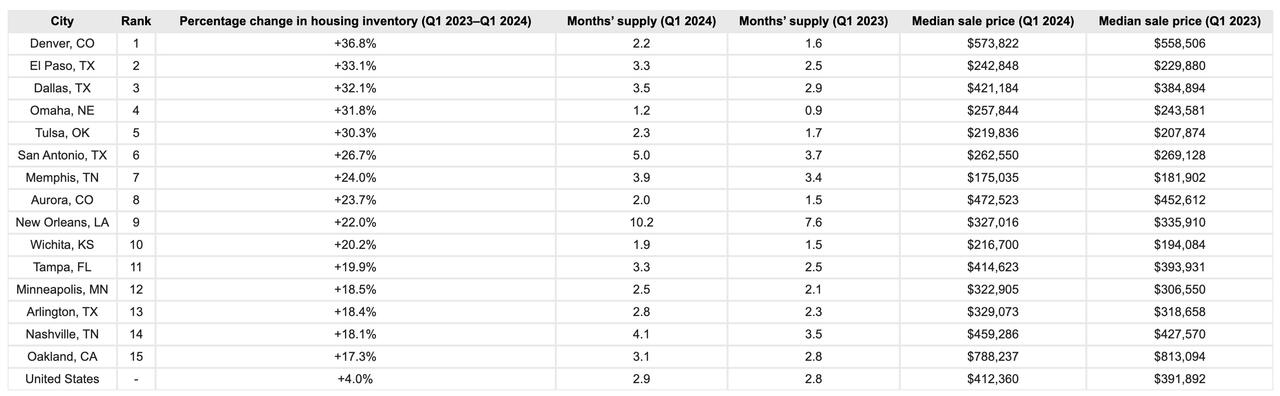
Active housing inventory in May is up 27.5% YoY nationally, with Denver leading at 75.2% YoY. I highlight Columbus Ohio at +32.9% since that is where I live.
A new report from Construction Coverage has revealed where the largest increases in real estate inventory in the U.S. are taking place.
The report notes that the current housing shortage—which is now estimated to be between four million and seven million homes—can trace its beginnings to long before the COVID-19 pandemic. In the 10 years following the Great Recession, the United States constructed fewer new homes than in any other decade since the 1960s.
They write that the lack of housing affects certain areas more severely than others. Researchers ranked locations based on the percentage change in the average monthly housing inventory—the total number of active listings plus pending sales at the end of the month—between Q1 2023 and Q1 2024.
Data from a national level showed that U.S. housing inventory decreased from more than two million in 2012 to a low of approximately 630,000 at the start of 2022.
Over the same period, months’ supply—a measure of how long it would take existing inventory to sell if no new homes came on the market—plummeted from a national high of 7.5 months to a historic low of 1.1 months, the report adds.
It also noted that inventory has rebounded slightly since early 2022: throughout the first quarter of 2024, the national inventory hovered around 970,000 homes for sale, marking a 4.0% year-over-year increase.
Despite this uptick, existing inventory would sustain the current sales pace for just 2.9 months—a marginal increase from the 2.8 months’ supply recorded last year.
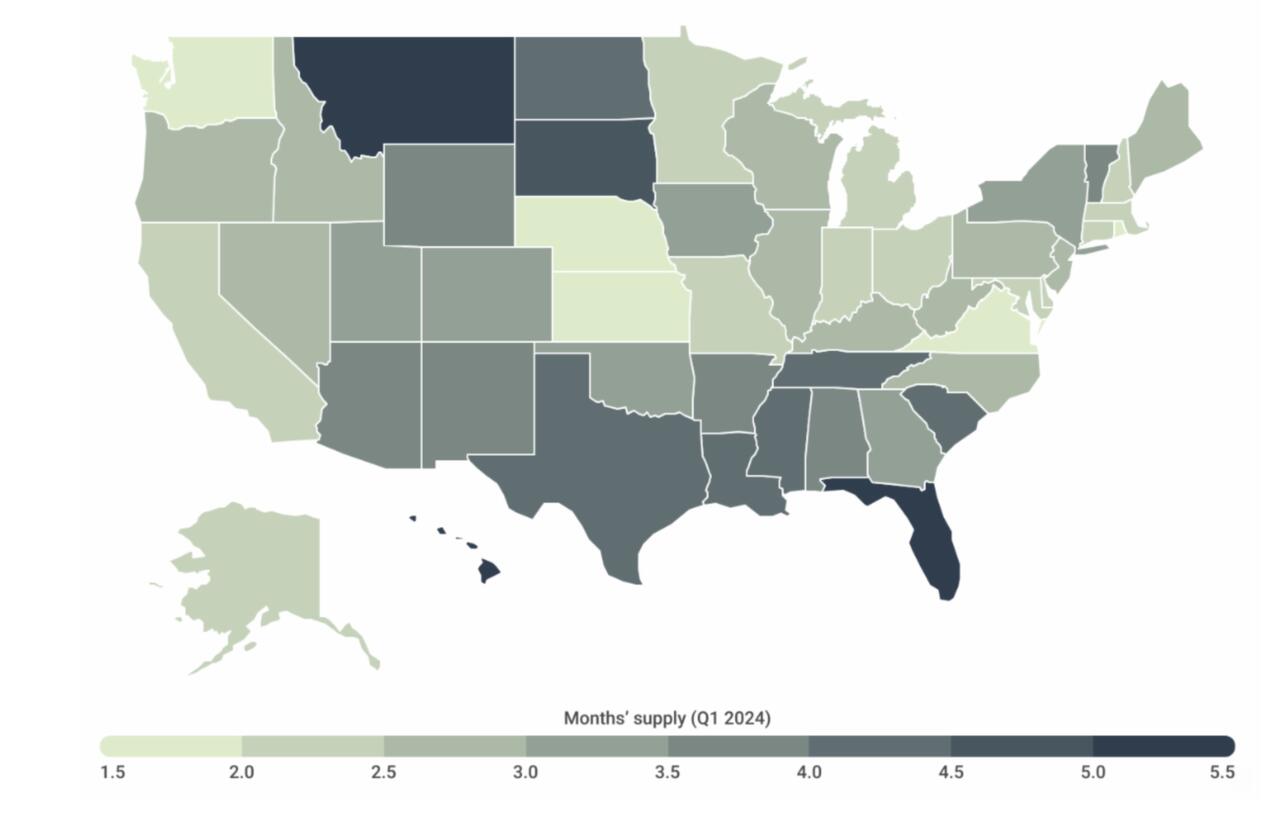
The report broke down trends by cities and states, finding that as of the first quarter of 2024, states with the lowest levels of supply are concentrated in and around the Midwest (such as Kansas with 1.5 months of supply) and the Northeast (including Rhode Island with 1.8 months of supply).
However, Washington also stands out for having some of the lowest levels of available housing nationally, with just 1.9 months of supply.
In contrast, several states in the South, led by Florida (5.2 months of supply), along with Hawaii (5.2 months) and Montana (5.1 months), present notably more favorable conditions for buyers.
Among the nation’s largest cities, Denver, El Paso, and Dallas recorded the largest year-over-year increases in housing inventory. At the opposite end of the spectrum, Las Vegas, Raleigh, and Chicago recorded the biggest declines.
The data is hardly a 2008-style collapse, but that doesn’t mean it isn’t noteworthy.
While the ‘turning of the tide’ still remains muted, the housing market is so large it rarely corrects swiftly. It’s important to notice, however, that rising inventory ticking higher – combined with mortgage rates now over 7% – could easily be telegraphing a correction in prices heading into 2025.
During the first three months of 2023, U.S. office vacancy topped 20 percent for the first time in decades. In San Francisco, Dallas, and Houston, vacancy rates are as high as 25 percent. These figures understate the severity of the crisis because they only cover spaces that are no longer leased. Most office leases were signed before the pandemic and have yet to come up for renewal. Actual office use points to a further decrease in demand. Attendance in the 10 largest business districts is still below 50 percent of its pre-COVID level, as white-collar employees spend an estimated 28 percent of their workdays at home.
A new report from Moody’s offers yet another grim outlook that the commercial real estate downturn is nowhere near the bottom. Elevated interest rates and persistent remote and hybrid working trends could result in around 24% of all office towers standing vacant within the next two years. The office tower apocalypse will result in more depressed values that will only pressure landlords.
“Combining these insights, with our more than 40 years of historic office performance data, as well as future employment projections, our model indicates that the impact on office demand from work from home will be around 14% on average across a 63- month period, resulting in vacancy rates that peak in early 2026 at approximately 24% nationally,” Moody’s analysts Todd Metcalfe, Anthony Spinelli, and Thomas LaSalvia wrote in the report.
In a separate report, Tom LaSalvia, Moody’s head of CRE economics, wrote that the office vacancy rate’s move from 19.8% in the first quarter of this year to the expected 24% by 2026 could reduce revenue for office landlords by between $8 billion and $10 billion. Factor in lower rents and higher costs, this may translate into “property value destruction” in the range of a quarter-trillion dollars.
In addition to remote working trends, Moody’s analysts pointed out that the amount of office space per worker has been in a “general downward trend for decades.”
At the peak of the Dot-Com boom, office workers used an average of 190 sq ft. The figure has since slid to 155 sq ft in 2023.
“The argument for maintaining or even increasing remote work practices remains compelling for many businesses,” the analysts said, adding, “If productivity remains stable and costs can be reduced by forgoing physical office spaces, the rationale for mandating in-office attendance diminishes.”
Related research from the McKinsey Global Institute forecasts that office property values will plummet by $800 billion to $1.3 trillion by the decade’s end.
Moody’s expects vacancy rates to top out as office towers are demolished or converted to residential ones in the coming years.
“Right-sizing will continue over the next decade as the market shakes out less efficient space for flexible floorplans that support our relatively new working habits,” they said.
Earlier this year, Goldman analyst Jan Hatzius pointed out that a further 50% price decline would make office tower conversions financially sensible.
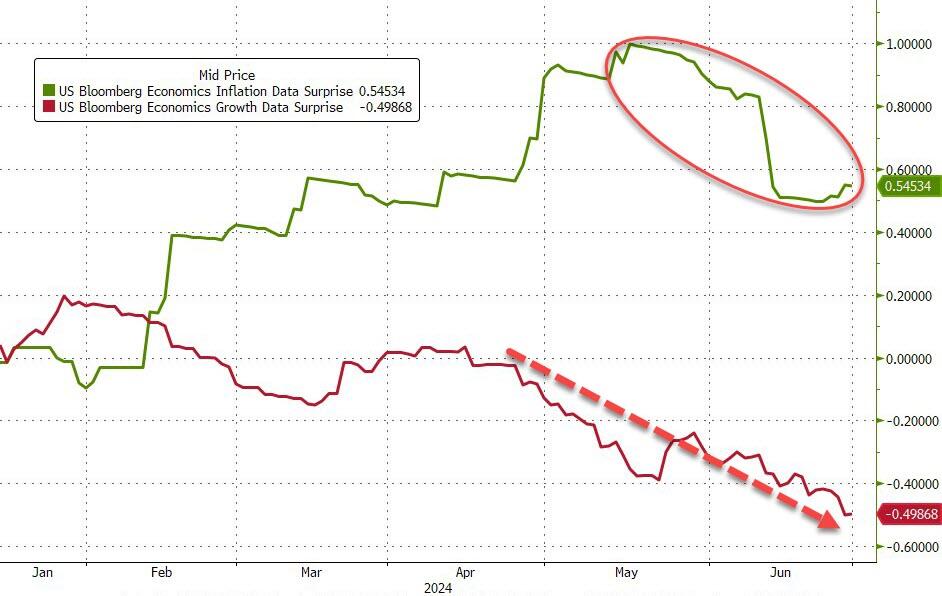
…which, many believe, will also drag down inflation (and it has been)…
Source: Bloomberg
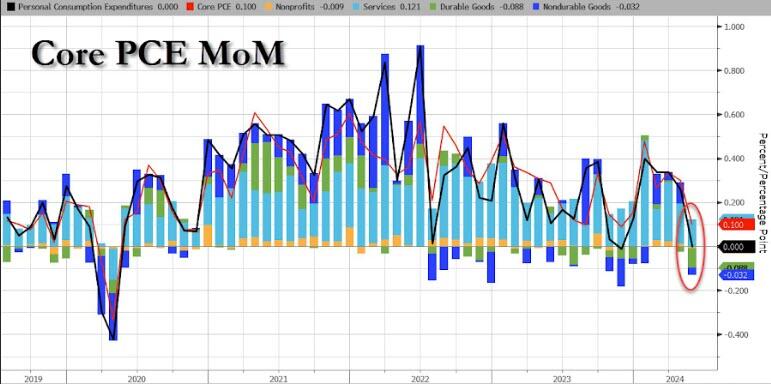
Today, we get to see The Fed’s favorite inflation indicator – Core PCE – which rose 0.1% MoM in May (after a revised +0.3% MoM for April) and in line with expectations. The headline PCE Price Index was unchanged MoM as expected as Durable Goods deflation trumped surging Services costs…
Source: Bloomberg
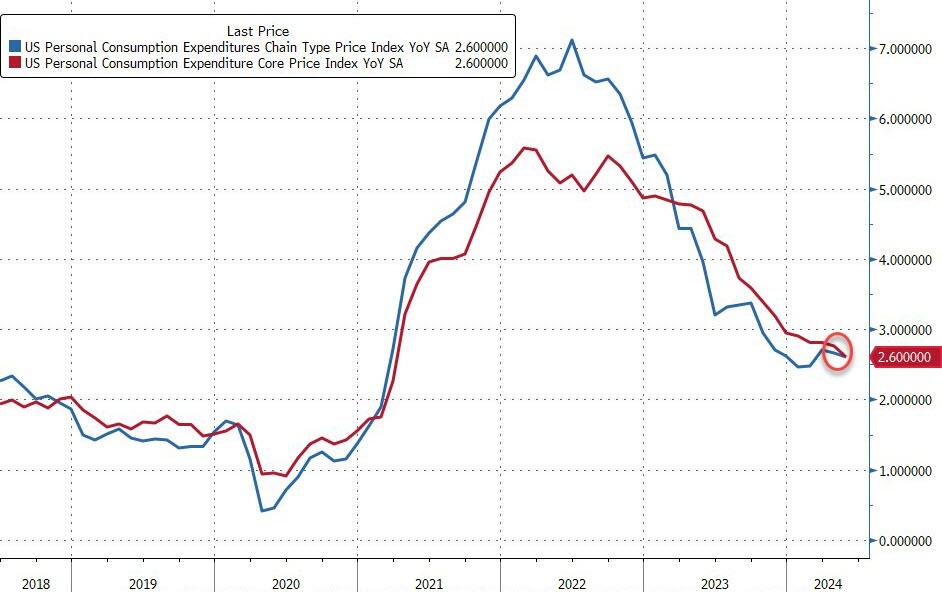
On a YoY basis, both headline and core PCE declined…
Source: Bloomberg
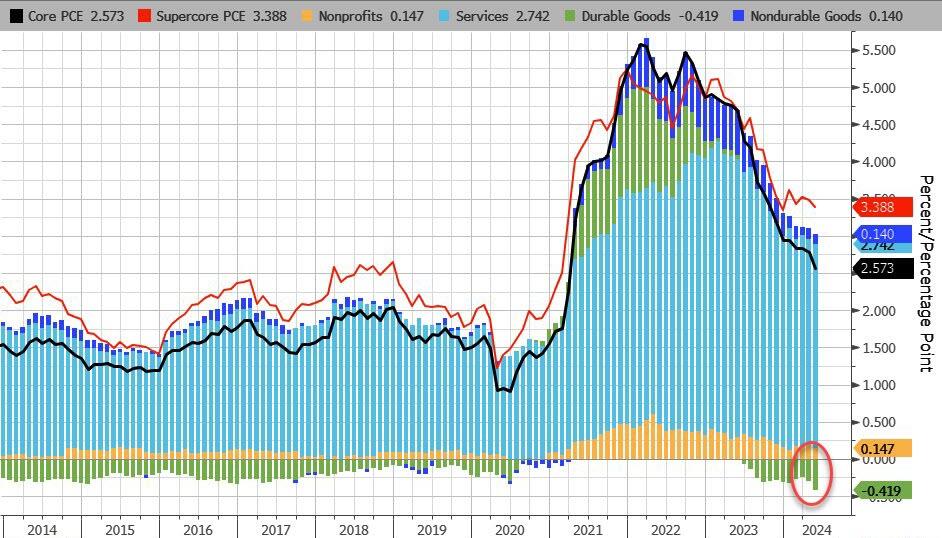
On a YoY basis, Durable Goods deflation is at its strongest in at least a decade…
Source: Bloomberg
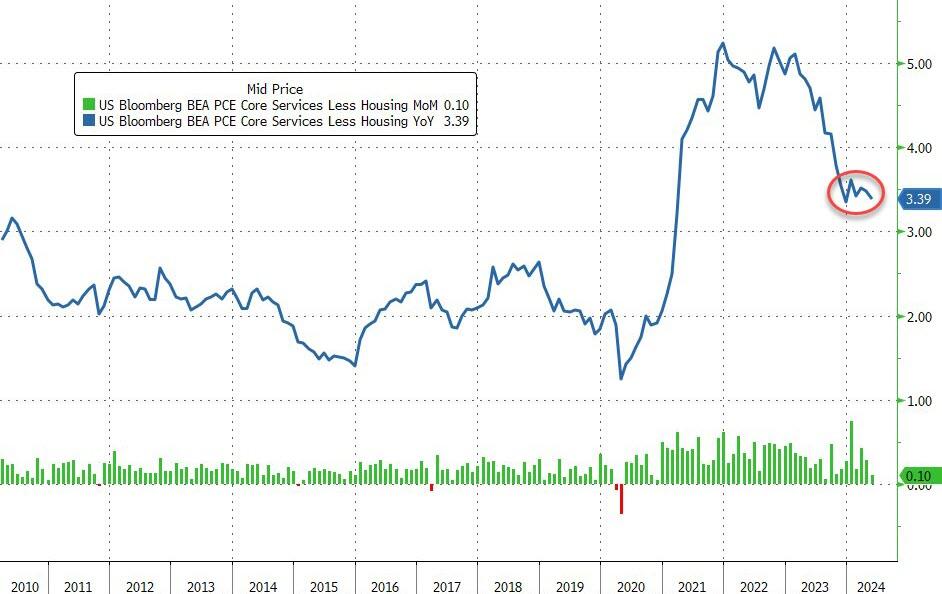
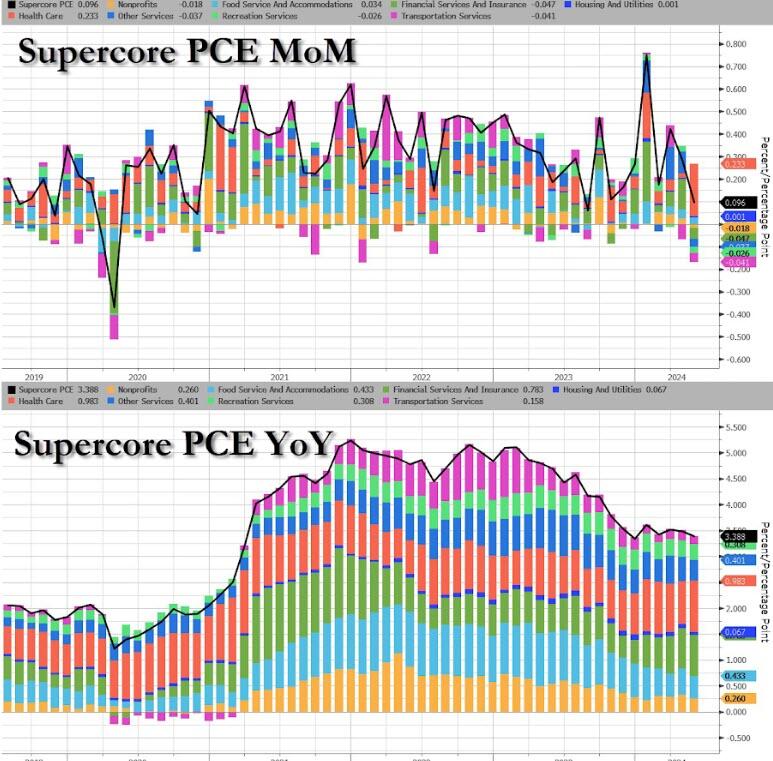
More notably, the so-called SuperCore PCE rose 0.1% MoM, which saw YoY slow to 3.39%… which is awkwardly stagnant at elevated levels…
Source: Bloomberg
That is the 49th straight monthly rise in SuperCore prices with Healthcare costs soaring…
Source: Bloomberg
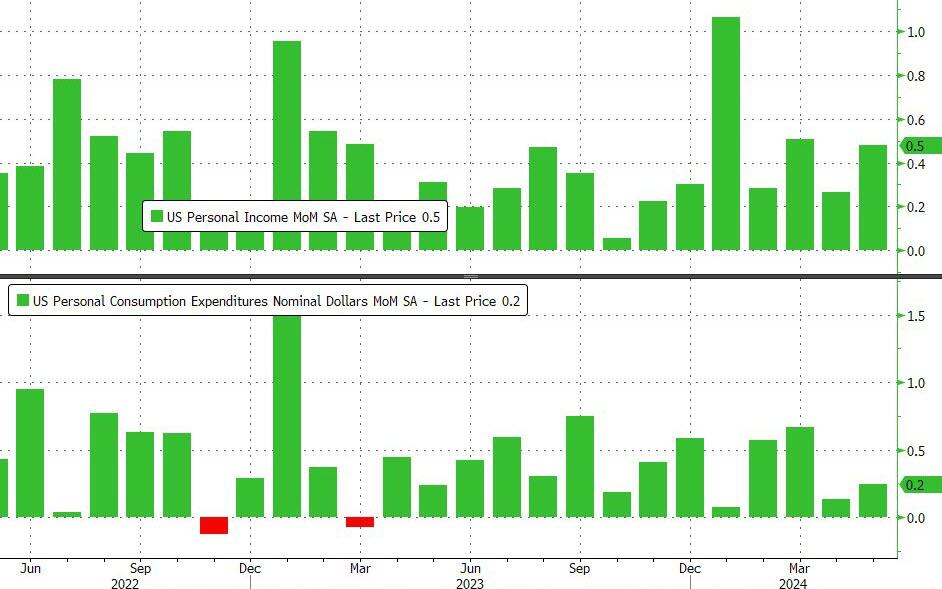
On a MoM basis, Income grew more than expected (+0.5% vs +0.2% exp) while spending rose less than expected (+0.2% MoM vs +0.3% exp)
Source: Bloomberg
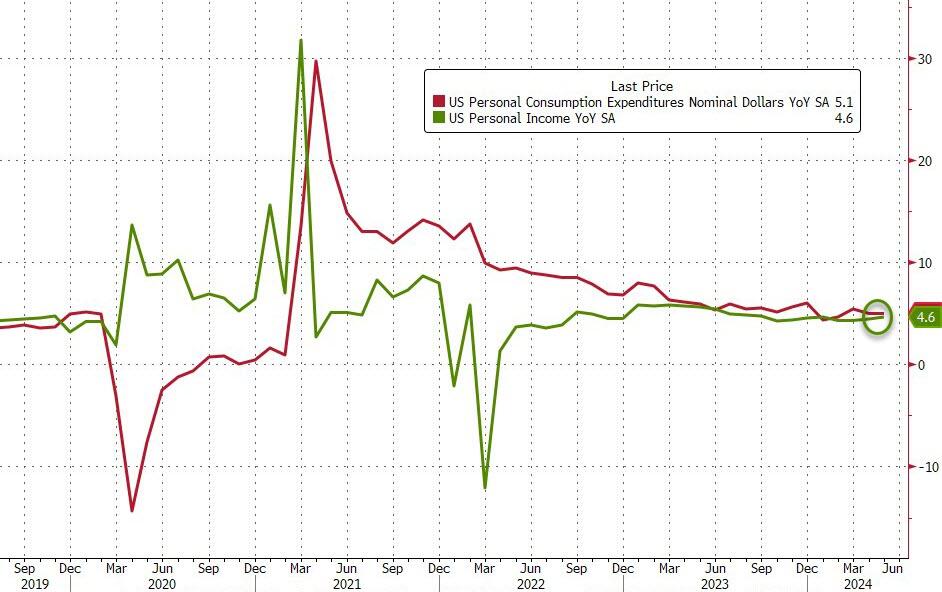
Which accelerated both income and spending on a YoY basis (with the latter outpacing the former, of course)…
Source: Bloomberg
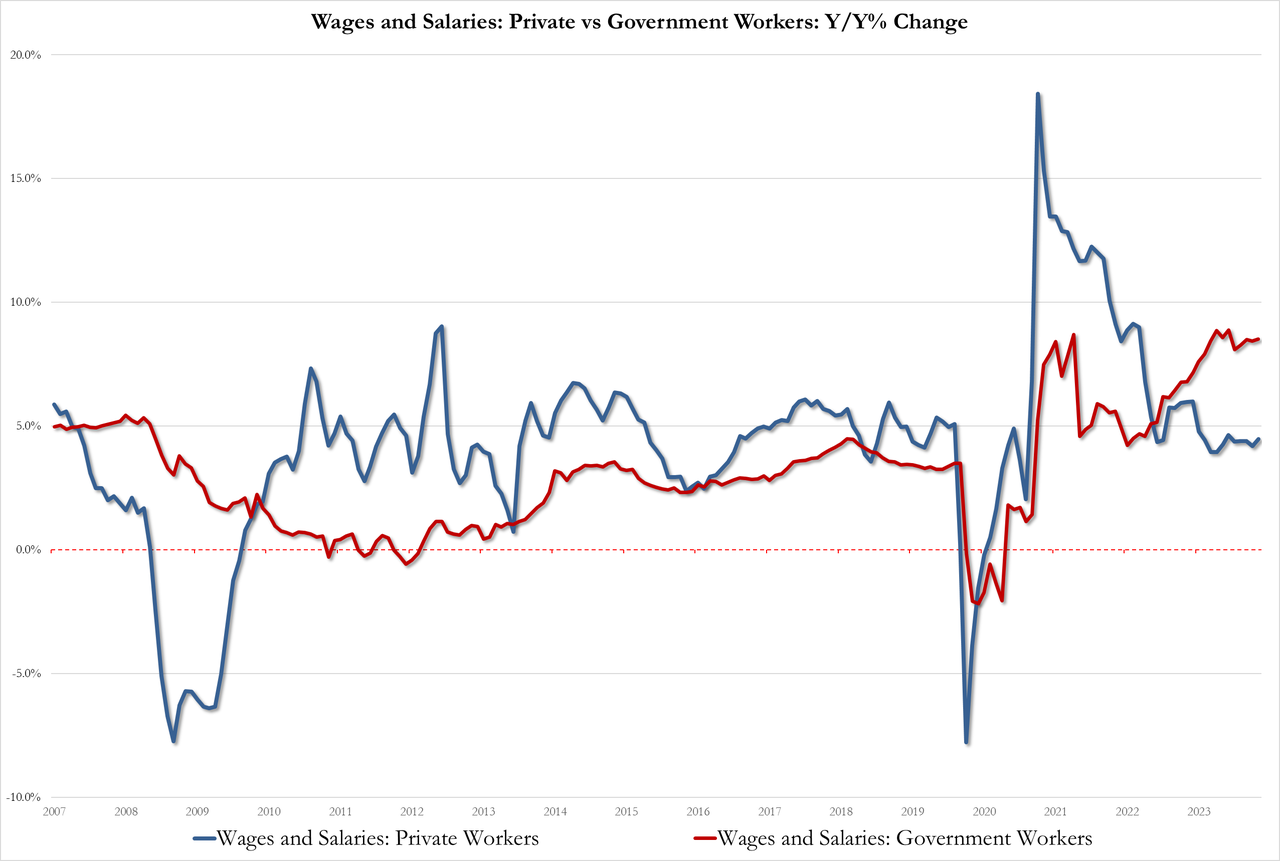
With wage pressures rising once again…
Government 8.5%, up from 8.4% but below the record high of 8.9%
Private 4.5% up from 4.2%
Source: Bloomberg
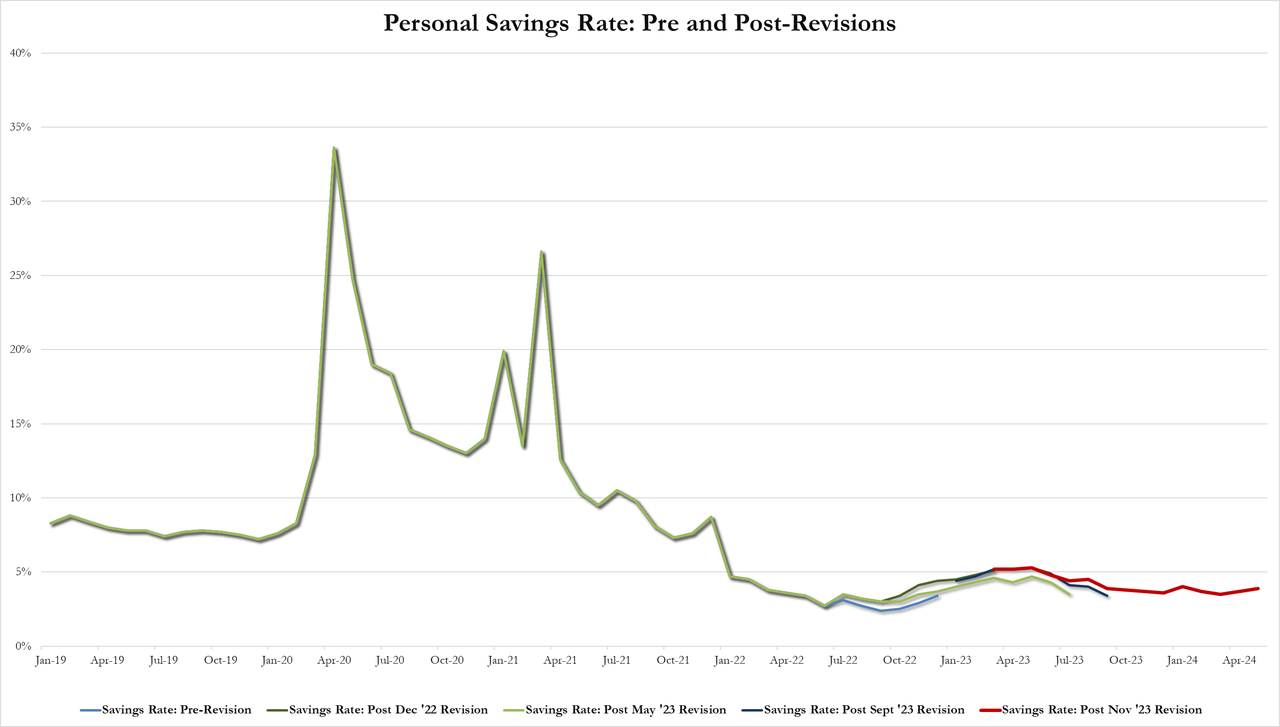
And after a series of revisions, the savings rate ticked up to 3.9% of DPI (from 3.7%) – the highest since January…
Source: Bloomberg
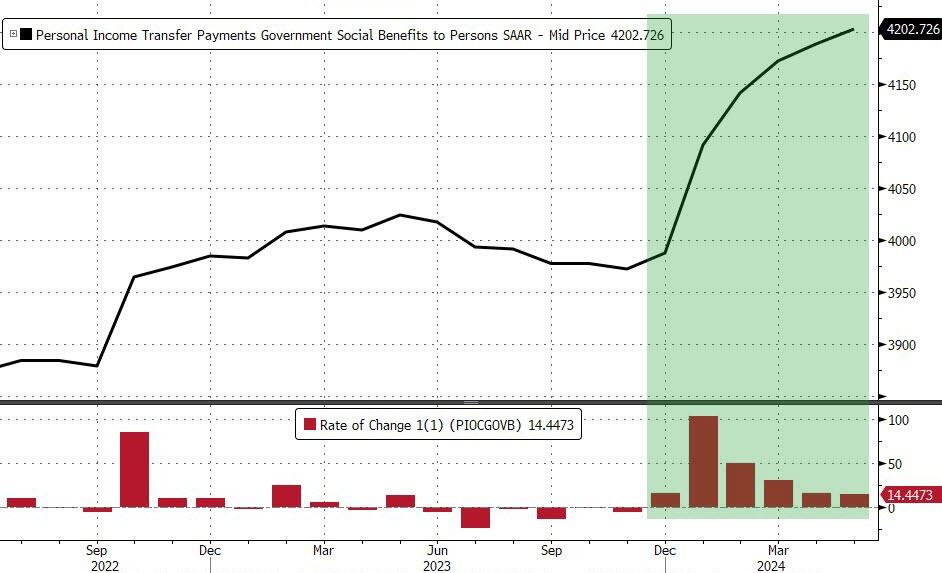
All of which takes place against a background of the sixth straight month of rising government handouts (well it is an election year after all)…
Source: Bloomberg
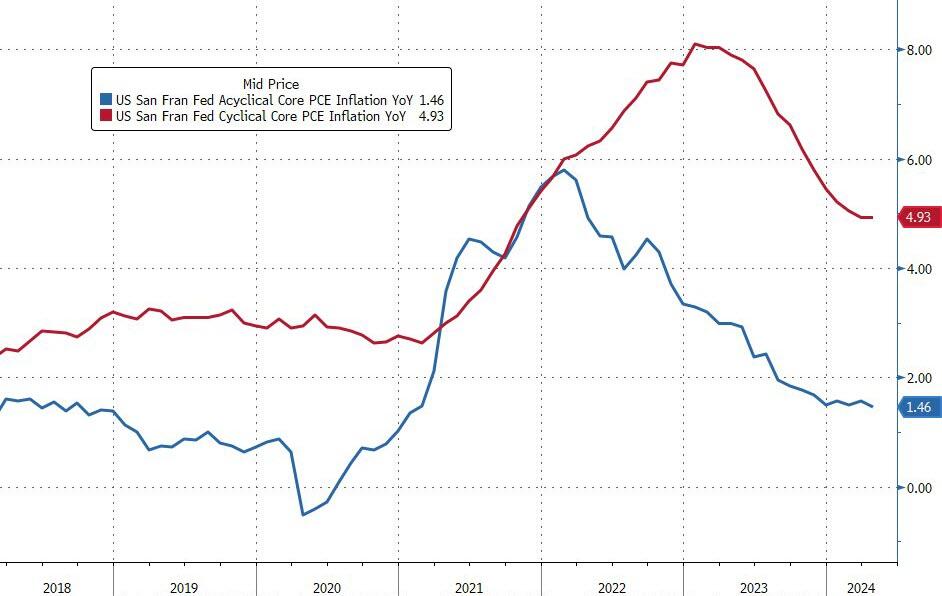
Finally, while acyclical inflationary pressures continue to drift lower, cyclical inflationary pressures remain extremely elevated…
Source: Bloomberg
A very mixed bag but nothing screams ‘automatic’ rate-cuts… and SuperCore refuses to budge.
The jointly signed letter, first reported by Axios, says the economic agenda of U.S. President Joe Biden, a Democrat, is “vastly superior” to Trump’s, the former Republican president seeking a second term.
Read the source article from Reuters for the rest of the Marxist clown show. What Joe Stiglitz and other Leftist economists are cheerleading in the excessive post Covid spending spree that Biden and Congress went on. There is a different between a free market system and government directed spending, usually on large donors.
One source of crippling inflation under Biden is (wasteful) government spending, up 37.7% under Biden. Federal debt is up a nauseating 50% under Biden. These levels of spending and debt are NOT sustainable!
Another souce of inflation under Biden has been The Federal Reserve. With Covid. The Fed entered like gangbusters dropping their target rate to 25 basis points and massively increasing their balance sheet. Call this BIDEN 1. Then to squelch inflation, The Fed raised their target rate and slowly started to unwind the balance sheet. We saw a slowing of inflation. Nothing to do with Biden, although I am sure he will take credit for it at Thursday’s debate with Trump.
Inflation was growing rapidly in Biden 1, but inflation started to slow (Biden 2) as The Fed rapidly raised their target rate.
Where the jobs aren’t! Calfironia under Gavin Newsom and their Marxist elected officials.
Based on the most recent release of the early benchmarks, payroll jobs declined by 32,000 from September 2023 through December 2023. On the contrary, the preliminary monthly reports showed a solid increase in job growth (+117,000 jobs) at the time. With the fourth quarter revision, calendar year 2023 saw essentially no net job growth (+9,000 jobs overall). Data since January 2024 has not yet been rebenched. As such, the figure includes the Early Benchmark Revision for these recent months growing at the same rate as the official CES estimates.
Given Calfornia’s burdersome taxes and regulations, not to mention $20 per hour for fast food workers, it is not surrprising that job growth in California has been minimal.
Joe Biden is a dishonest politician, so it is no wonder that he ignores actual data. Like claiming that crime is down under his leadership, when it is actually large cities like New York and Los Angeles not reporting their crime data to the FBI.
Take the May jobs numbers. The BLS reports that 272k jobs were added. However, the more accurate Household Survery reported a loss of -408k jobs in May.
While the Establishment Survey did indeed report that 272K “jobs” were added, this number also included multiple job holders; stripping those out, we get that the actual number of “employed” workers plunged by -408K.
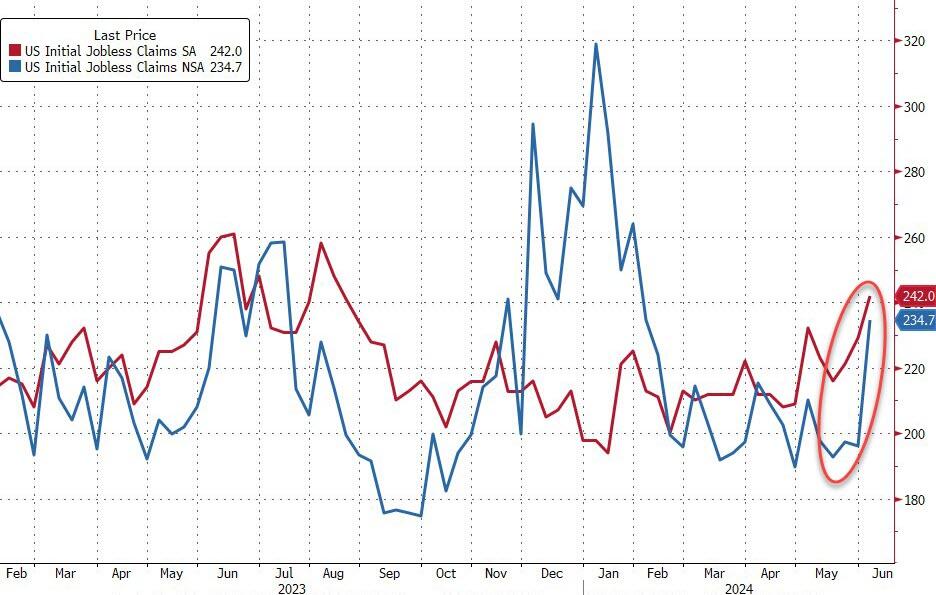
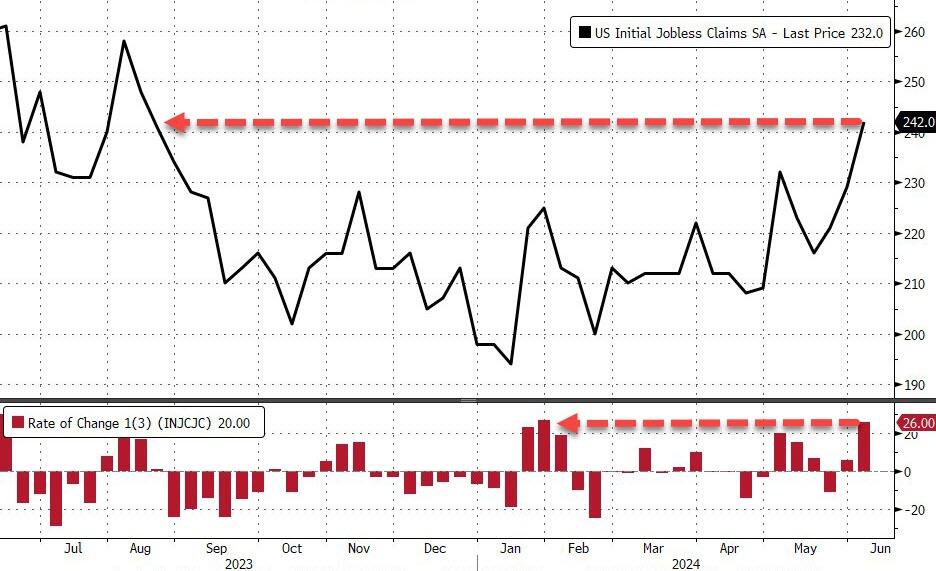
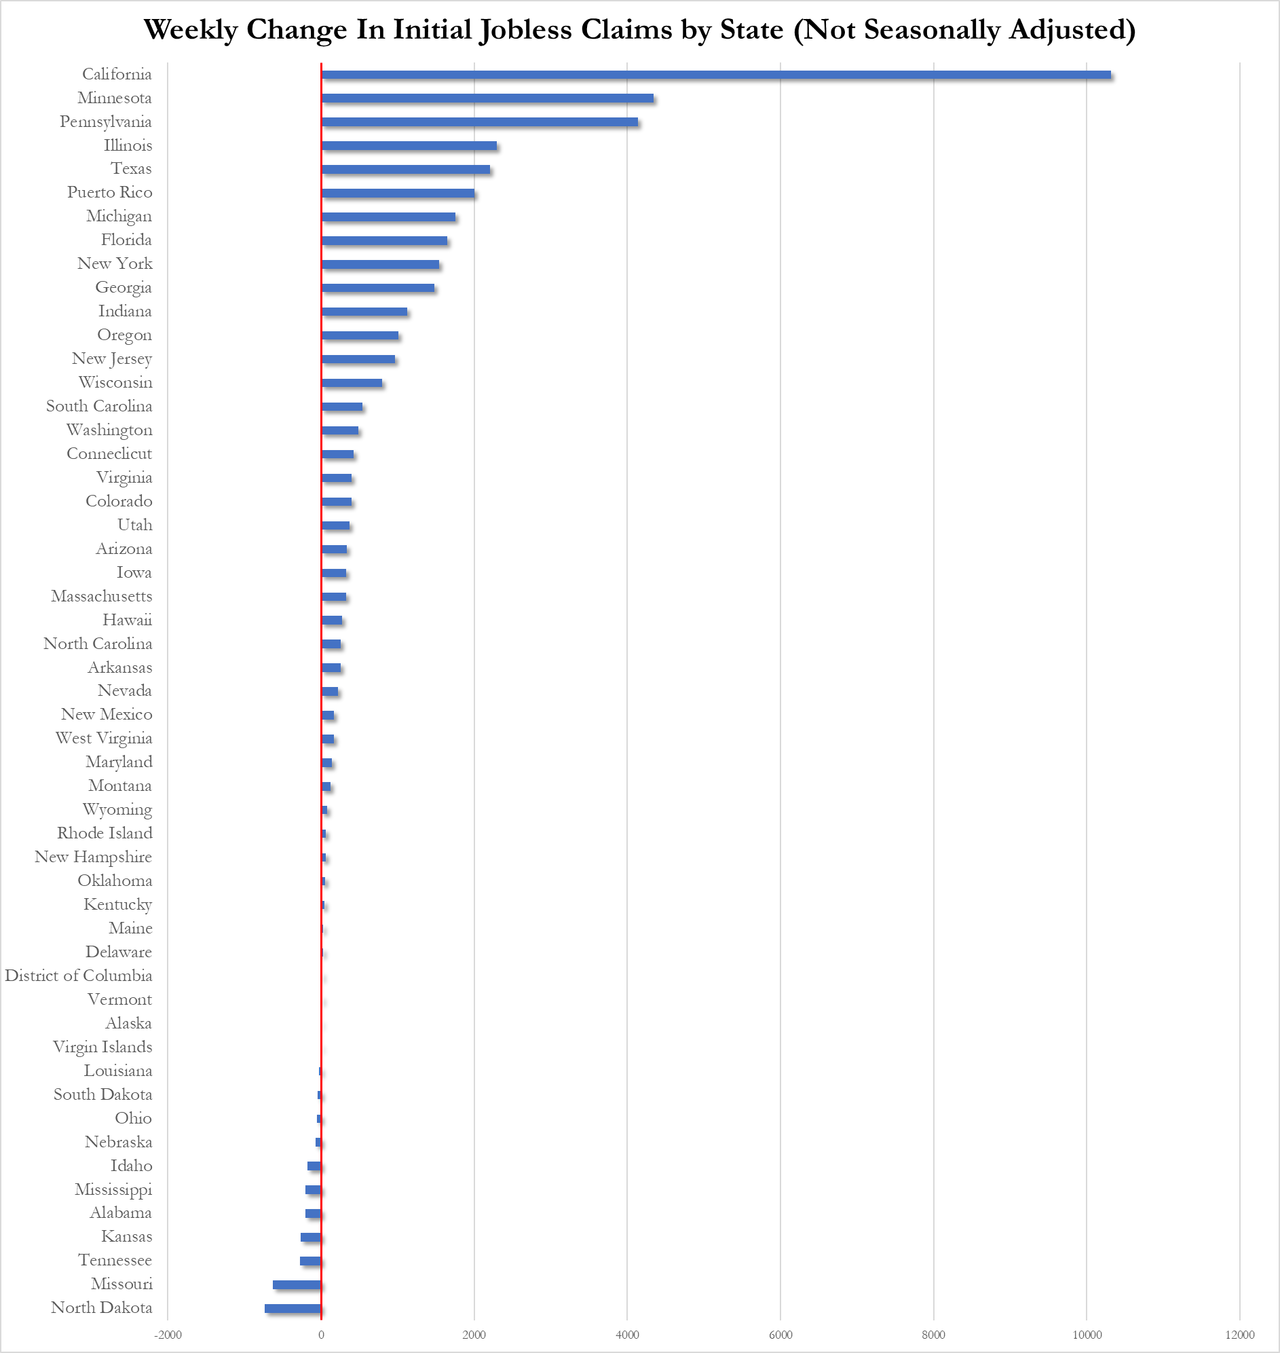
On the jobless claims side, the number of Americans applying for jobless benefits for the first time surged last week to 242k (up from 229k and well above the 225k exp). That is the highest since August 2023…
Source: Bloomberg
On an NSA basis, claims exploded higher.
The last three weeks have seen the largest surge in claims since January…
Source: Bloomberg
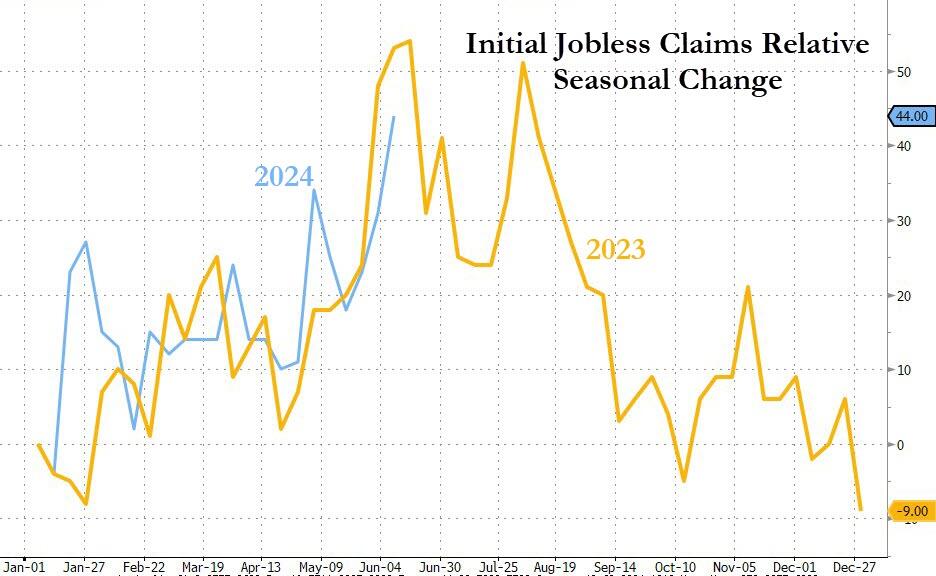
Notably this surge is very VERY similar to what we saw last year (but not the prior few years, so not a ‘seasonal’ pattern per se)…
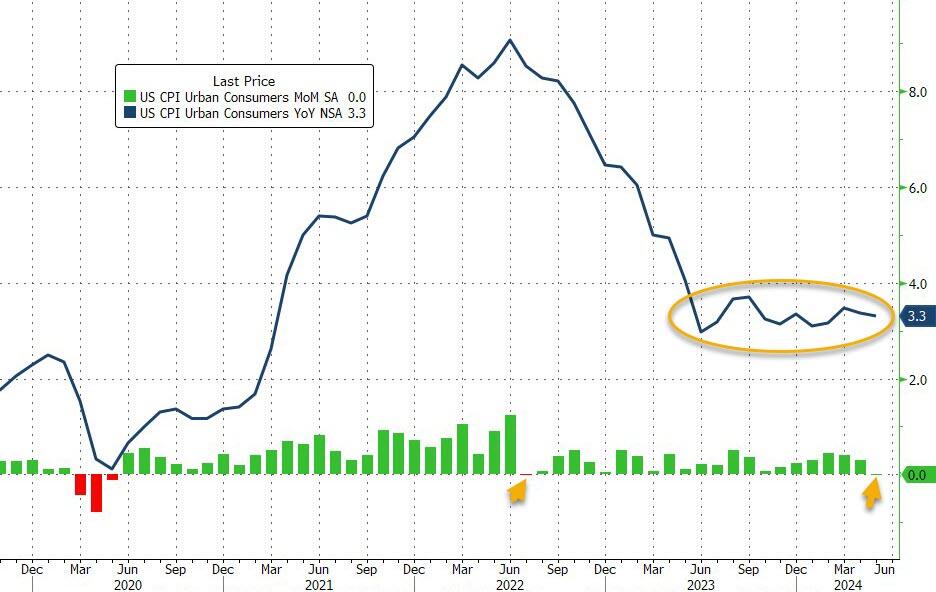
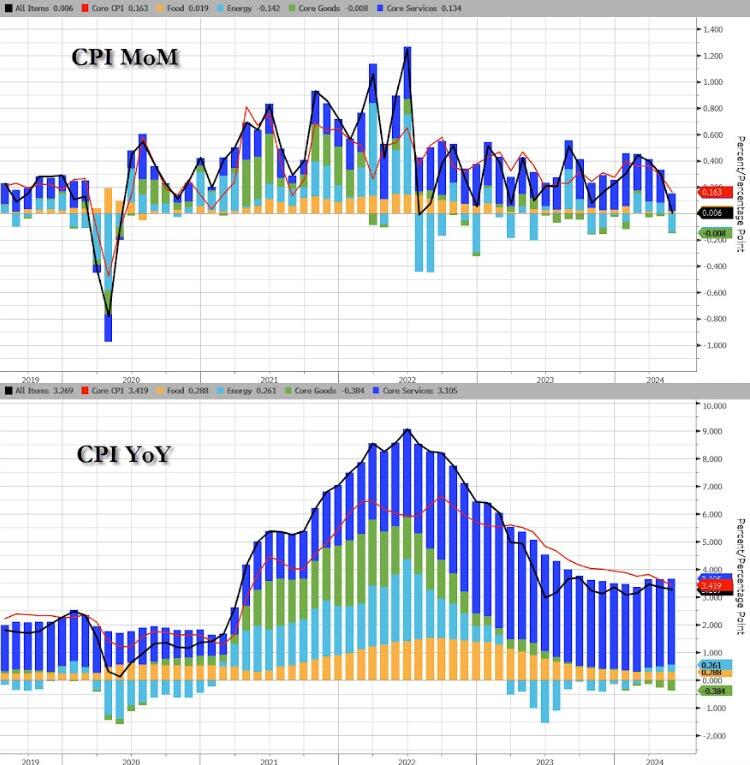
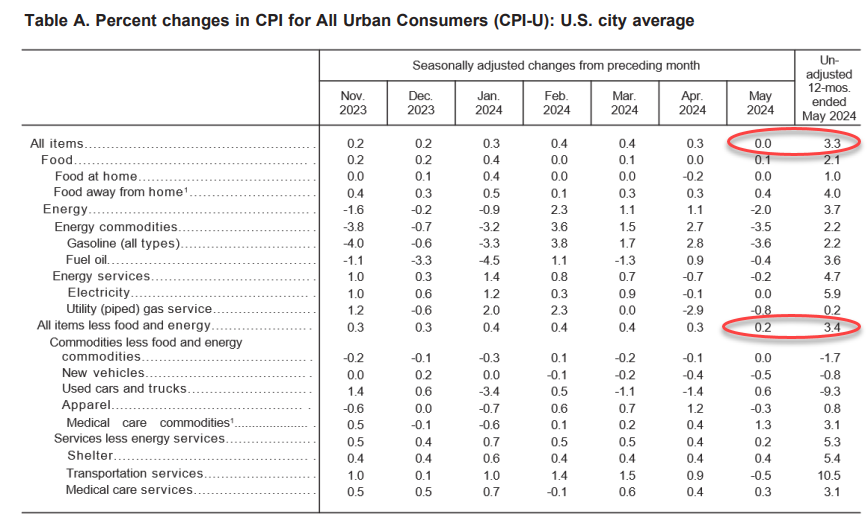
Energy was the biggest drag on the headline CPI MoM…(Gasoline prices tumbled 3.6% in May from April, one key reason why the headline CPI was flat on the month. )
Source: Bloomberg
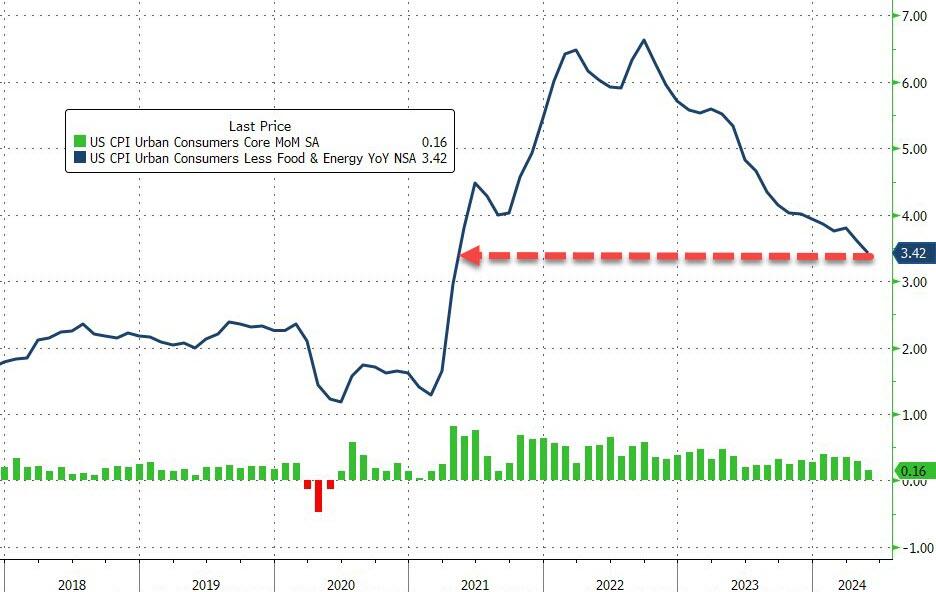
Core CPI rose 0.2% MoM (below the 0.3% exp) pulling the YoY change down to 3.4% (from 3.6% and below the 3.5% exp). That is the lowest Core CPI YoY since April 2021…
Source: Bloomberg
Core CPI has not had a down-month since President Biden was elected.
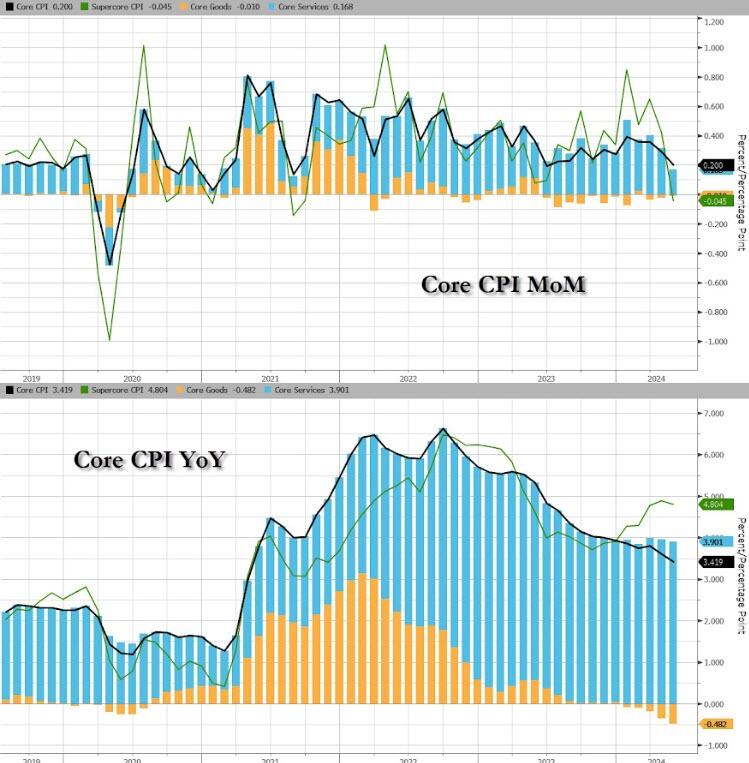
Core Services inflation slowed notably MoM…
Source: Bloomberg
The shelter index increased 0.4 percent in May and was the largest factor in the monthly increase in the index for all items less food and energy.
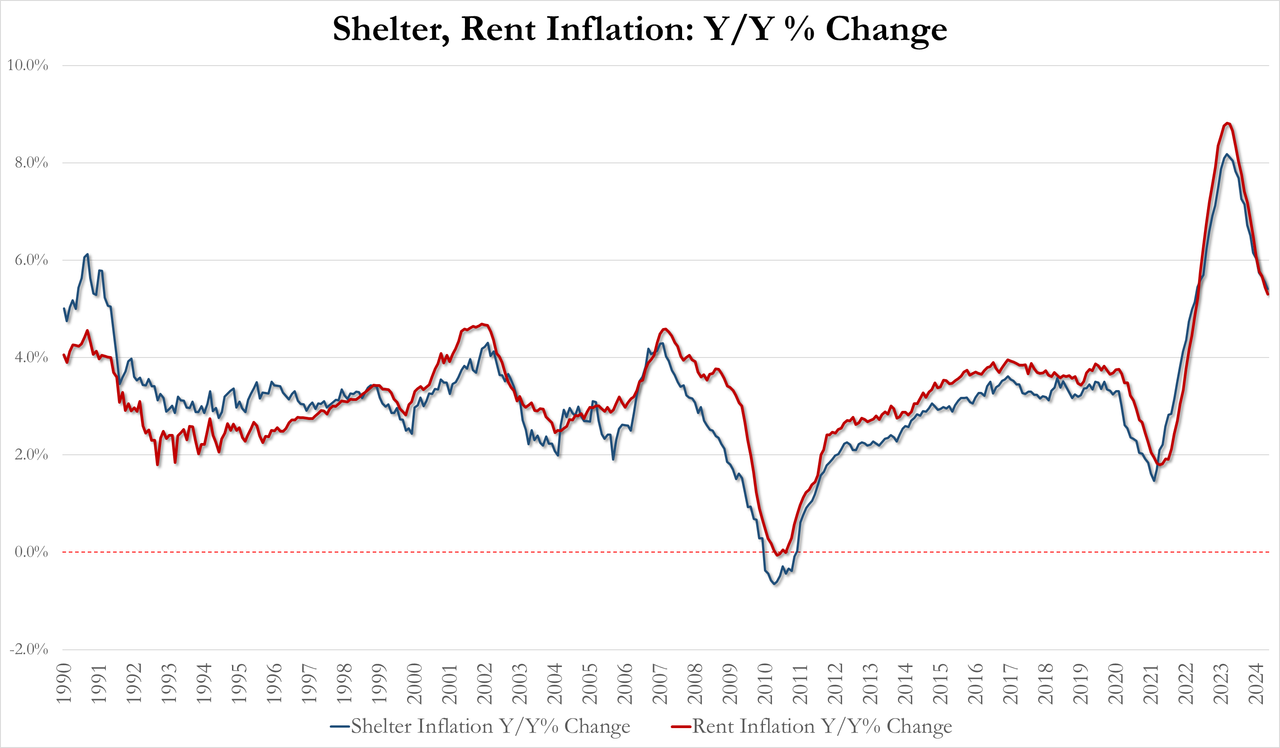
May Shelter inflation 5.41% YoY, down from 5.55% in April and lowest since April 2022
May Rent inflation 5.30% YoY, down from 5.44% and lowest since May 2022
For context on how important housing costs are to US inflation data, the shelter index rose 5.4% over the last year, making up over two thirds of the total 12-month increase in the all items less food and energy index.
Source: Bloomberg
It does make one wonder were exactly the BLS is getting their BS OER data from…
The full breakdown…
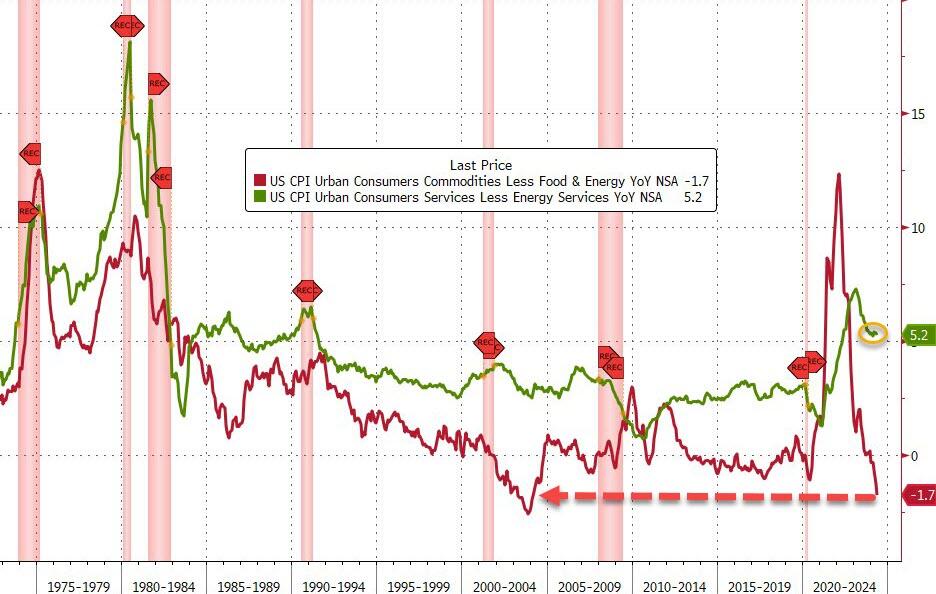
Services INflation remains awkwardly stuck above 5% while Goods DEflation is at its weakest since January 2004…
Source: Bloomberg
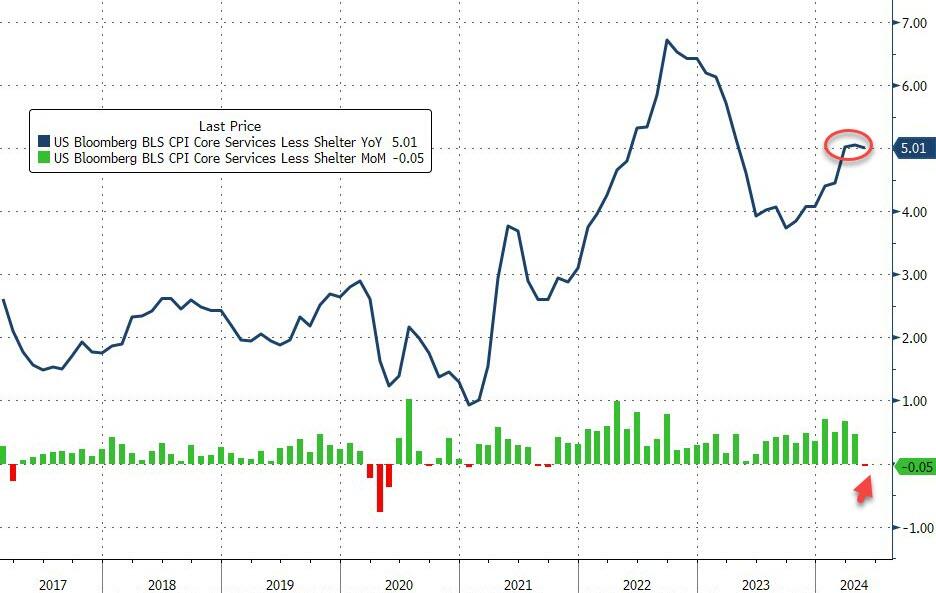
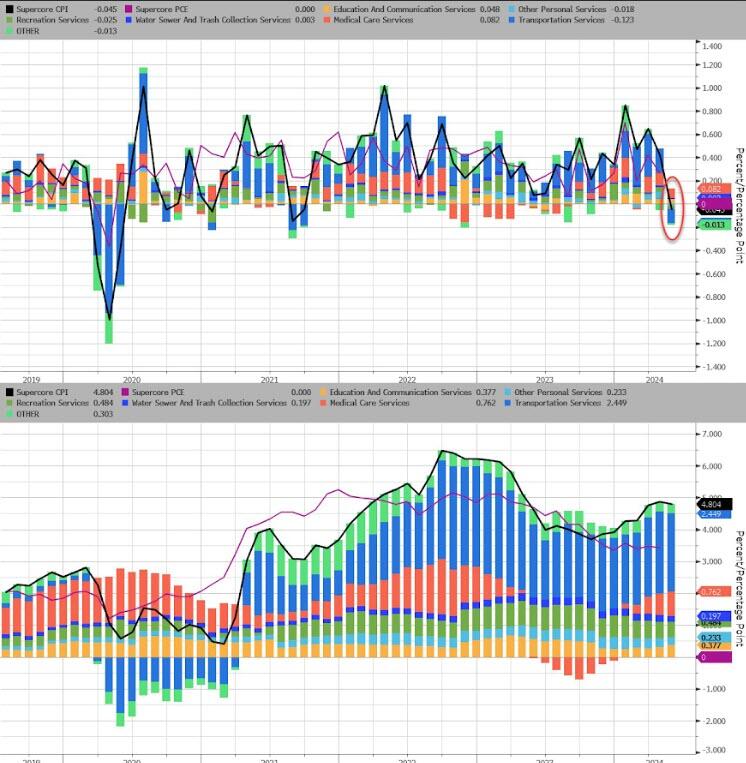
SuperCore CPI fell 0.05% MoM – its first drop since Sept 2021, but that left the YoY level still above 5.0%…
Source: Bloomberg
Transportation Services costs tumbled MoM to drag SuperCore lower MoM…
Source: Bloomberg
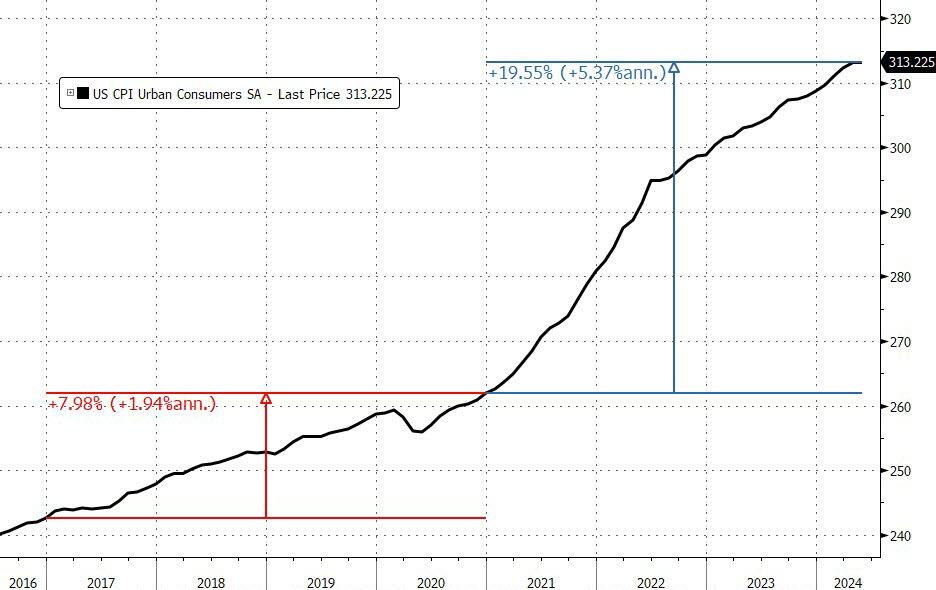
We note that consumer prices have not fallen in a single month since President Biden’s term began (July 2022 and May 2024 was the closest with ‘unchanged’), which leaves overall prices up over 19.5% since Bidenomics was unleashed (compares with +8% during Trump’s term).
And prices have never been more expensive…
That is an average of 5.4% per annum (almost triple the 1.9% average per annum rise in price during President Trump’s term).
Source: Bloomberg
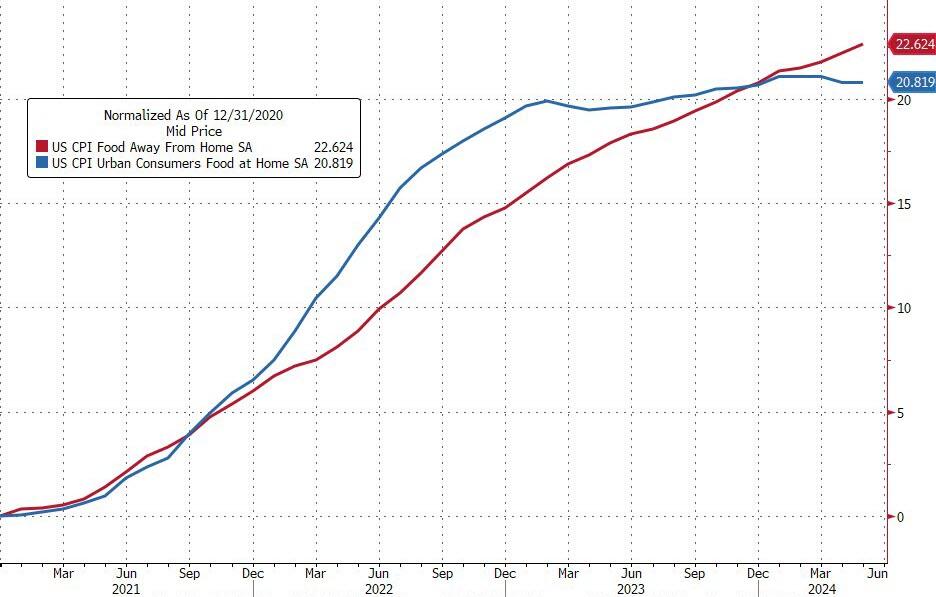
Since President Biden was elected, food prices at home are up around 21% and food prices away from home are up almost 23%…
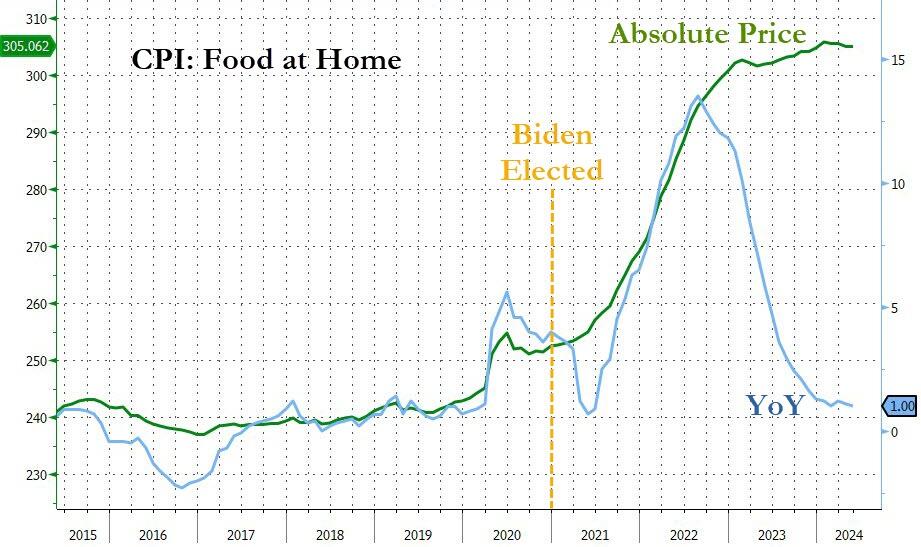
And while the Biden administration will continue to gaslight voters with comments like “inflation is tumbling”… every man, woman, and child who actually buys food knows prices have NEVER been higher…
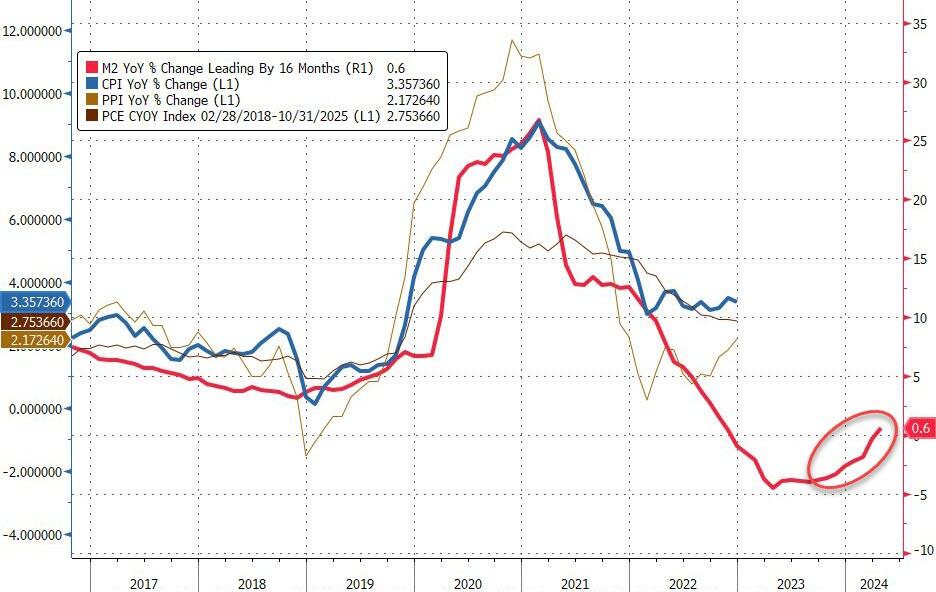
Finally, while the ‘flations’ have broadly tracked M2 lower, we note that M2 YoY is now starting to turn back higher once again…
Source: Bloomberg
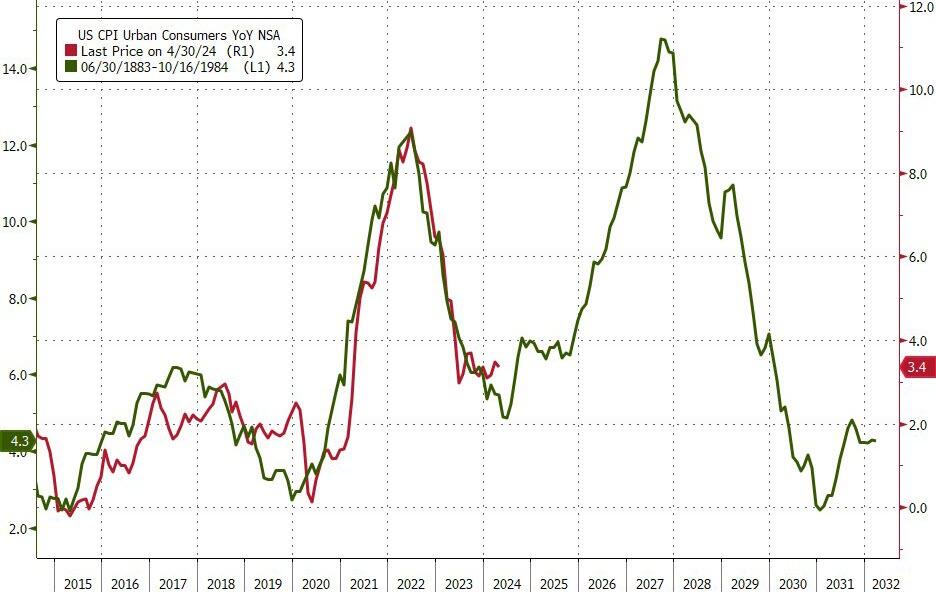
Will the next President and Fed head face a 70s redux?
Source: Bloomberg
And is this guaranteed if Powell decides “insurance” cuts are required (for Biden?)
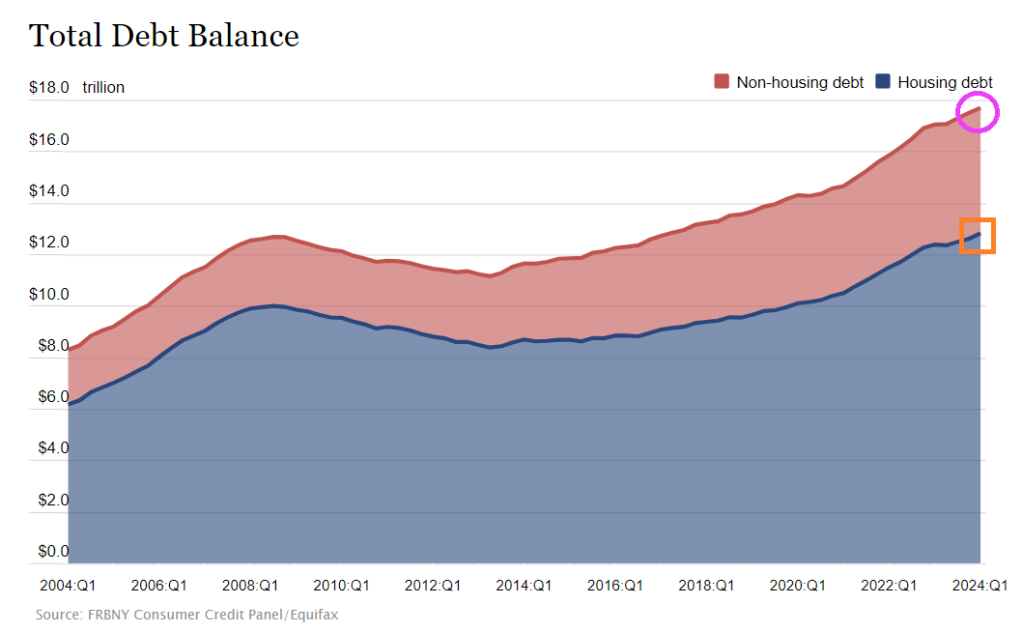
Too much debt should be the theme song for the US! Both for consumers and the Feral government (not a typo!)
Consumer credit increased by +$6.403 billion in April, much softer than consensus estimate of +$10 billion … more notable, however, was March data, given initial read of +$6.274 billion was revised down to -$1.099 billion.
Not to mention $13 trillion in mortgage debt (1-4 unit housing), but at least that is backed by property. Unlike The Feral government who borrows/prints with only a promise.
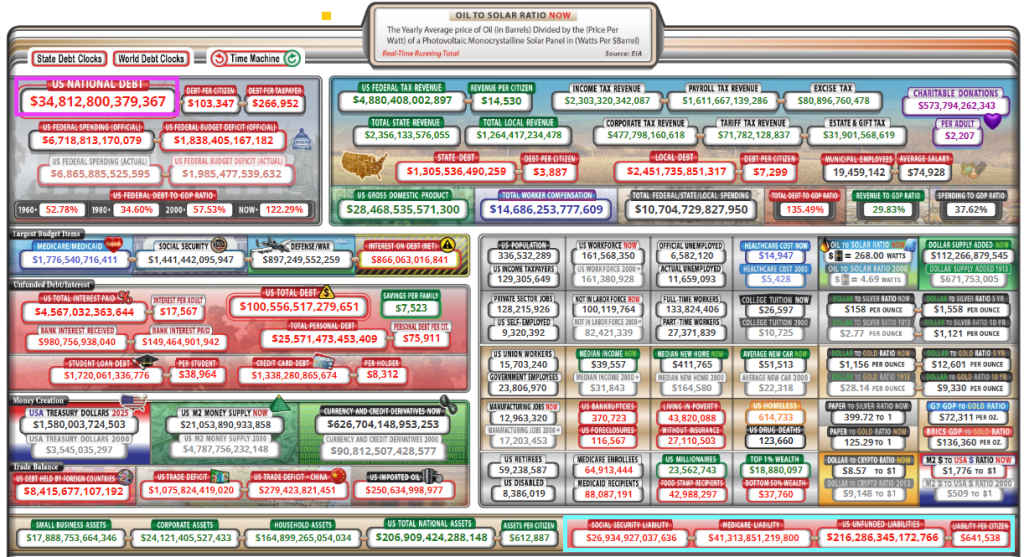
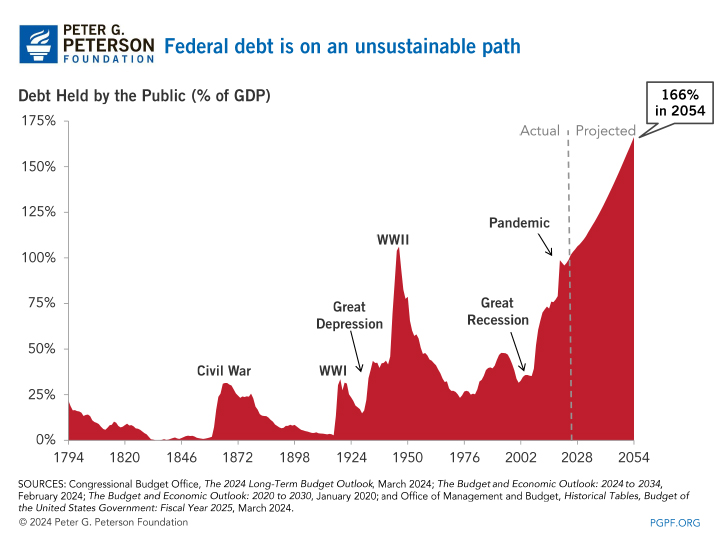
And growing awfully fast. Note that since the “pandamic”, debt as % of GDP has exceeded 100% and is projected to hit 166% by 2054. But look at the UNFUNDED LIABILITIES the need to be paid ($216+ TRILLION ($641.5k per citizen!). Pretty soon, we (the 99%) will be back on the chain gang paying for endless wars and government corruption. I wish Biden, Schumer, McConnell and other swamp creatures would consider all the spending the government is on the hook for rather than focus on spending that will help them get elected perpetually. There is no middle of the road anymore. The US is broke and has too much debt.
Of course, President Biden wants endless spending on wars (Ukraine, Israel, etc) and now wants an unlimited check to pay for the next pandemics. The Pretenders’ song “My City Was Gone” seems to be appropriate for the US as “My County Is Gone.”
Of course, some “economists” claim that the US can borrow/print unlimited amounts of money … until they can’t.
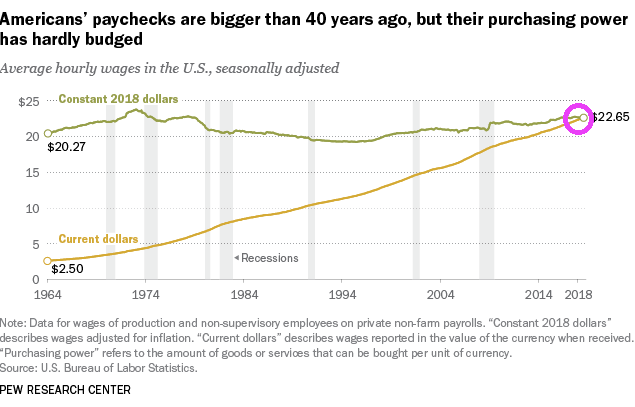
To begin with, America’s paychecks are bigger than 40 years ago, but purchasing power of those larger paychecks is about the sames as it was 40 years ago. Great job Washington DC!!! … NOT!!!!
Meanwhile, credit card delinquencies are at the highest level since 1991.
















You must be logged in to post a comment.