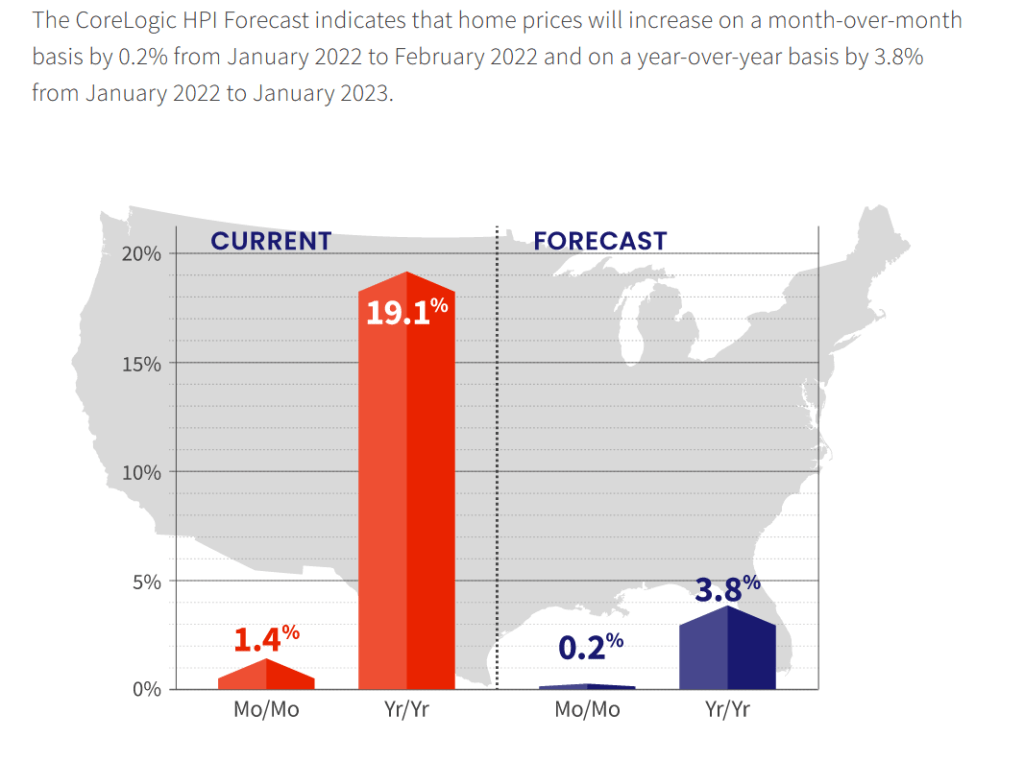
Home prices nationwide, including distressed sales, increased year over year by 19.1% in January 2022 compared with January 2021. On a month-over-month basis, home prices increased by 1.4% in January 2022 compared with December 2021 (revisions with public records data are standard, and to ensure accuracy, CoreLogic incorporates the newly released public data to provide updated results).
But Corelogic is still forecasting only 3.8% YoY growth in 2022.
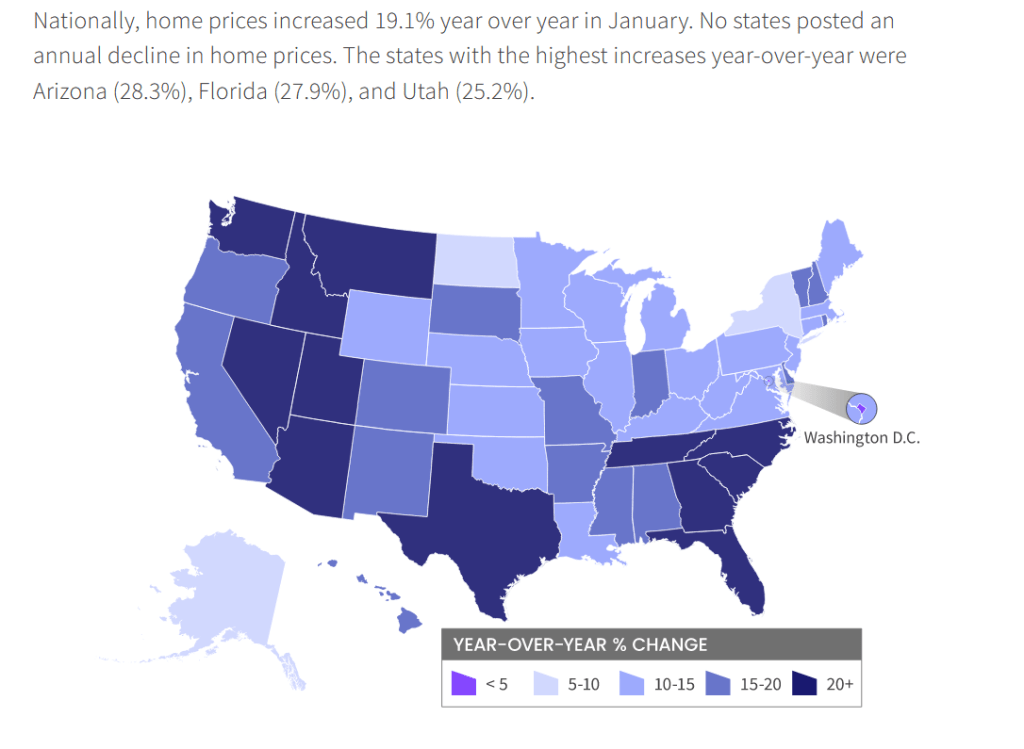
Home prices are hot, hot, hot in all states except North Dakota and New York. The fastest growing states are lower taxes, higher growth states.
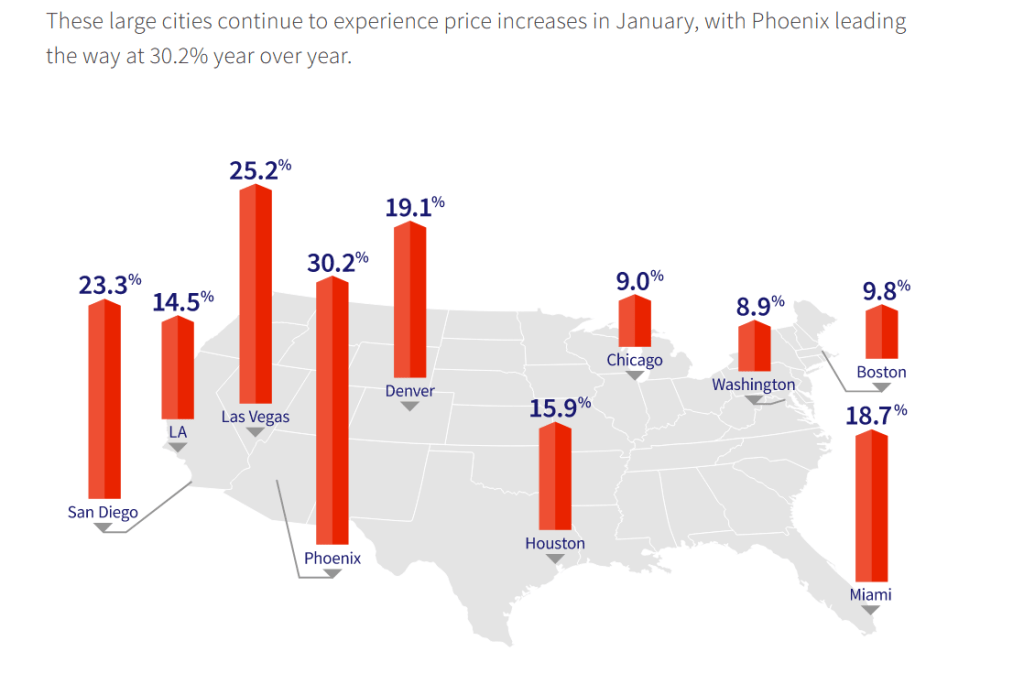
Phoenix, Las Vegas and San Diego are booming. But Chicago and Washington DC are growing at near 9% YoY.
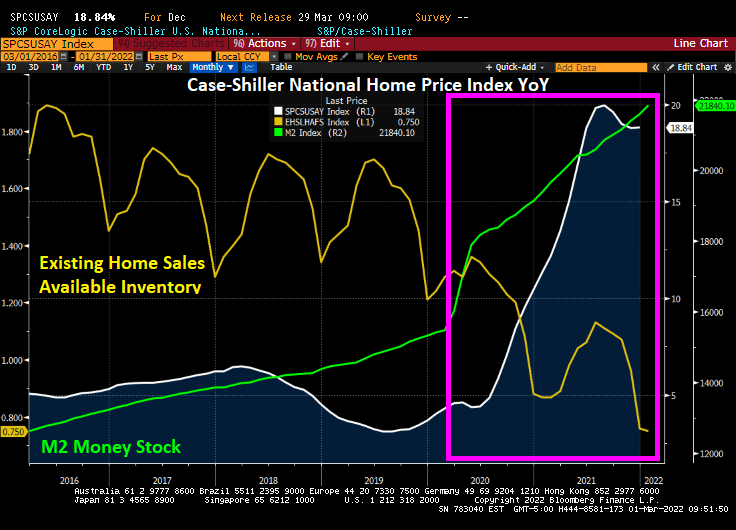
Case-Shiller’s December report show home prices growing at 18.84% YoY thanks to Fed stimulypto and historic low inventory of homes available for sale.
And this doesn’t include the inflation in prices caused by the Russian invasion of Ukraine. Yet.
US Personal Consumption Expenditures (PCE) price index rose by 5.2% in January, the fastest rate since mid-1983.
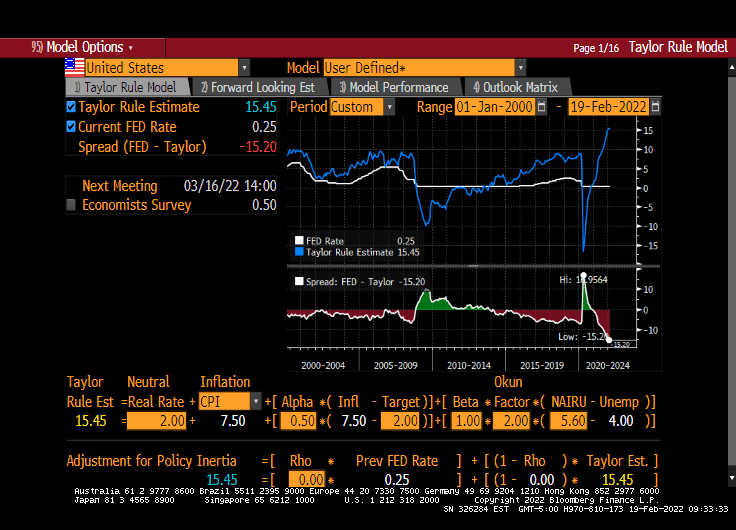
With CPI inflation at 7.5% YoY, the Taylor Rule suggests a Fed Funds target rate of 13.35%, higher than the current rate of 0.25%. Overstimulated much??
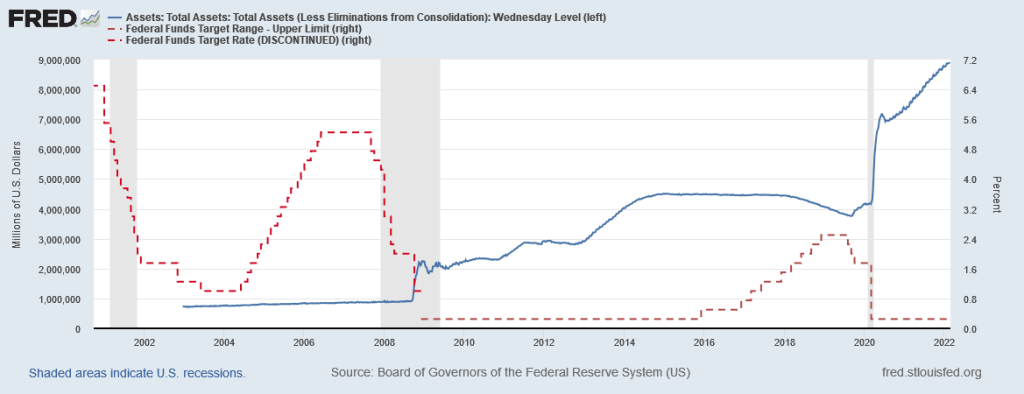
It has been almost 14 years since The Federal Reserve under Ben Bernanke unleashed zero interest rate policies (ZIRP) and quantitative easing (QE) in late 2008. And Fed monetary stimulypto is still running strong after almost 14 year of monetary mismanagement and asset bubble stimulation.
The Federal Reserve under Bernanke and Yellen raised their target rate exactly once under President Obama before the election of Donald Trump. After Trump was elected, The Fed raised their target rate 8 times, lowered it 5 times. There have been no rate hikes under Biden.
There seemingly never-ending Fed monetary stimulus has resulted in the top 1% seeing their share of total net worth soar relative to the share of net worth of the bottom 50%. But note that starting in 2014 just as The Fed was engaged in QE 3. But the real divergence occurred after The Federal government heaped trillions in fiscal stimulus on top of the skyrocketing monetary stimulus.
In terms of income inequality (as measured by the GINI coefficient), it just keeps getting worse and worse.
Let’s see if The Fed actually delivers by reducing their monetary stimulypto.
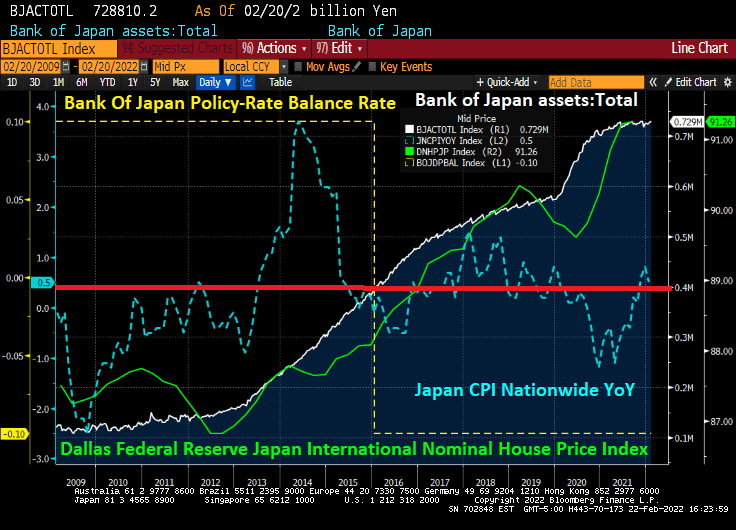
It’s taken nine years and the Bank of Japan supersizing its balance sheet to the $5 trillion mark, but Asia’s second-biggest economy finally has some inflation.
Officials in Tokyo are realizing the hard way, though, that it’s best to be careful what you wish for as bond yields spike.
Granted, the gains in consumer prices Japan is reporting are negligible compared to those in the U.S. and China. And inflation is still a good distance from the BOJ’s 2% target. Still, the 0.5% rise in consumer prices in January year-on-year is already unnerving the bond market. It followed a 0.8% jump in December and marks the fifth straight month of increases.
The worry is that Japan’s inflationis the “bad” kind. Haruhiko Kuroda was hired as BOJ governor in March 2013 to end deflation. Kuroda unleashed tidal waves of liquidity. That drove the yen down 30%, generated record corporate profits and sent Nikkei 225 Average stocks to 31-year highs.
Despite a staggering balance sheet with a -0.10 bps policy rate, Japan has only 0.5% inflation.
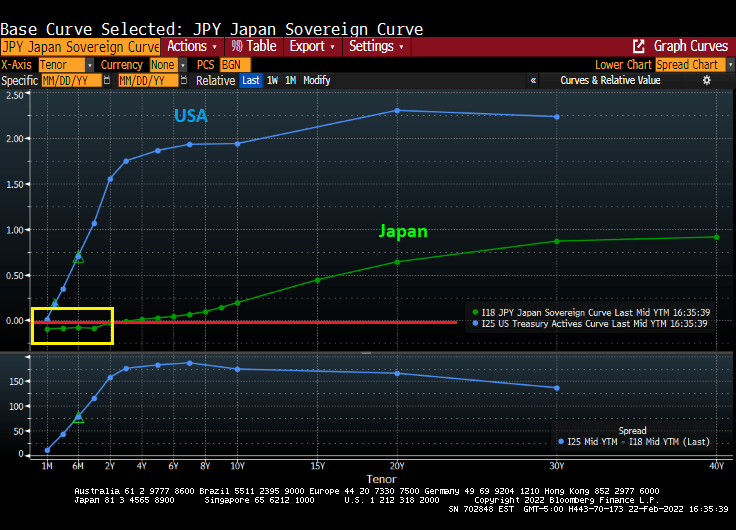
And Japan’s yield curve is negative at 3 year tenor and less.
How is it that Japan has virtually no inflation with negative rates but the USA has 7.5% inflation with a 0.25% target rate? Could it be the USA undertook massive fiscal spending related to COVID and reduced energy sources in an effort to go “green” that led to 7.5% inflation??
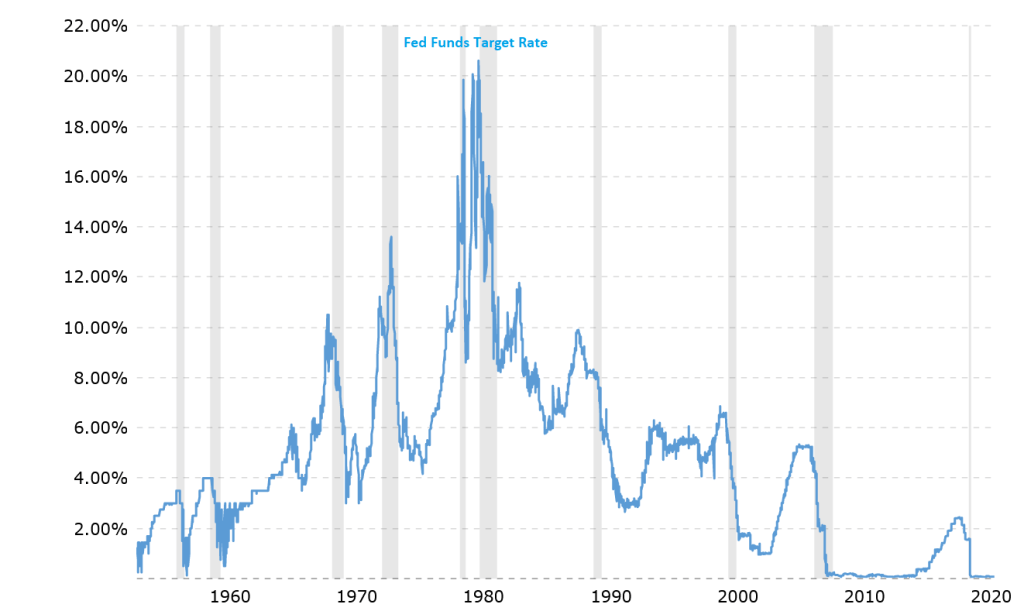
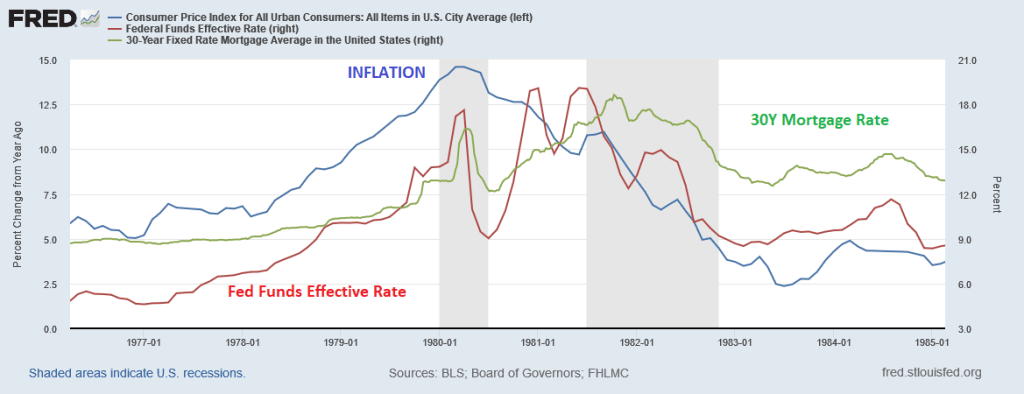
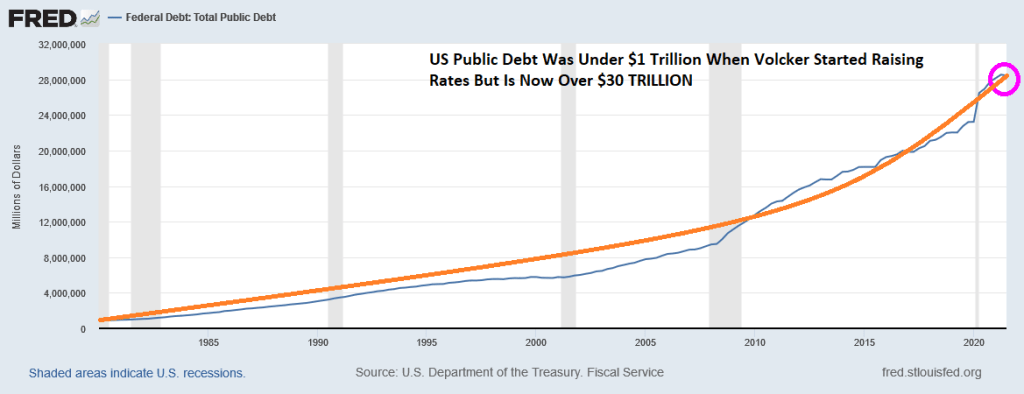
In August 1979, when Paul Volcker became chairman of the Federal Reserve Board, the annual average inflation rate in the United States was 11%. Inflation peaked in 1980 at 14.6%. Volcker raised the federal funds rate from 11.2% in 1979 to 20% in June of 1981.
Inflation (defined as CPI YoY) declined from over 14.6% in 1980 to 3.6% by 1985. But 30-year mortgage rates resumed their upward trajectory and peaking in October 1981 at 18.63 before beginning a gradual decline as inflation was tamed.
But will Powell enact another Volcker moment by raising the target rate abruptly?
The bank is joining others on Wall Street in ramping up bets for faster policy tightening, after U.S. consumer prices posted the biggest jump since 1982 in January. Goldman Sachs Group Inc. is forecasting seven hikes this year, up from its earlier prediction of five.
“We now look for the Fed to hike 25bp at each of the next nine meetings, with the policy rate approaching a neutral stance by early next year,” the JPMorgan team, led by chief economist Bruce Kasman, said in a research note.
January U.S. inflation readings “surprised materially to the upside,” the economists wrote. “We now no longer see deceleration from last quarter’s near-record pace.”
On inflation, the economists said a “feedback loop” may be taking hold between strong growth, cost pressures, and private sector behavior that will continue even as the intensity of current price pressures in the energy sector eventually fade.
Strong growth? 1.3% is strong growth??
Be that as it may, the US economy is at a different place today than under President Jimmy Carter. When Volcker started raising The Fed Funds Target rate, US public debt was still under $1 trillion. It has ballooned to over $30 trillion today.
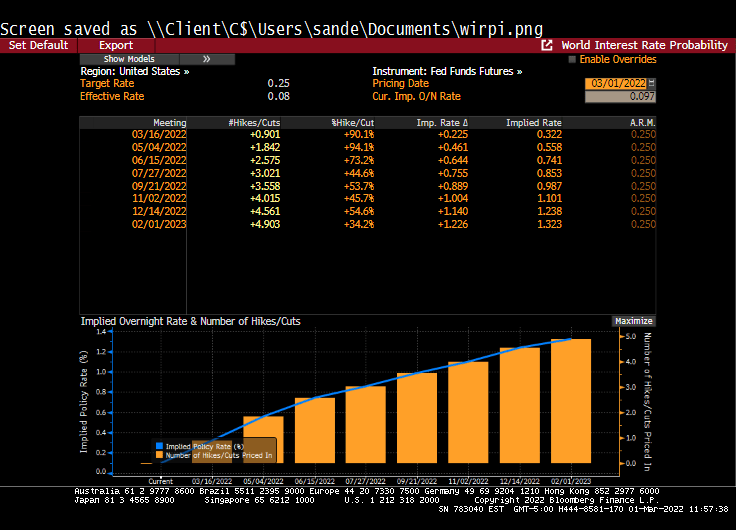
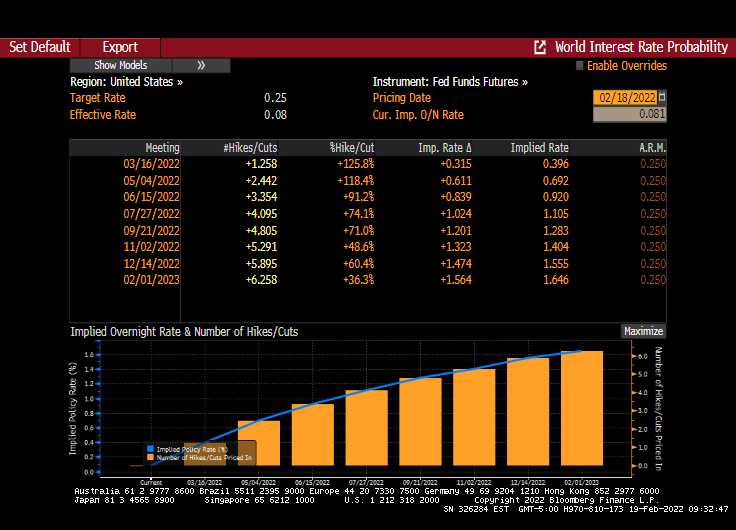
9 rate increases is above what is being priced in The Fed Funds FUTURES market which is 6 rate increases over the coming year.
With 7.5% inflation, the Taylor Rule suggests a target rate of 15.45%. Talk about “Shock and Awful!”
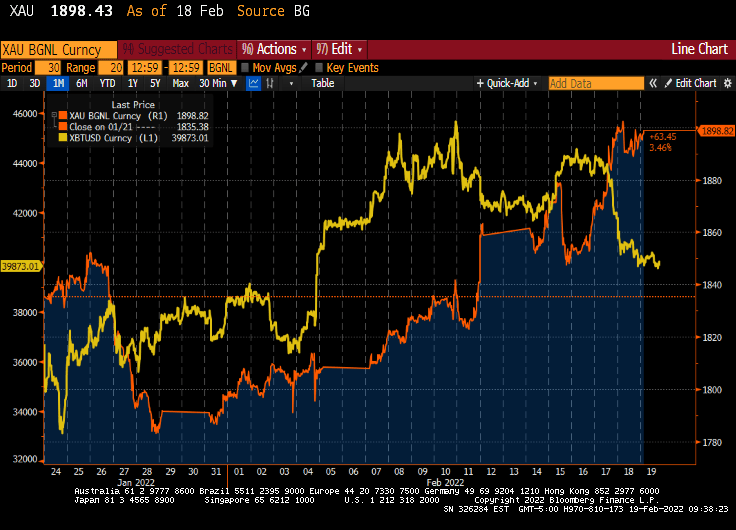
We are starting to see GOLD (gold) surging and Bitcoin (yellow) falling as The Fed prepares “shock and awful” rate hikes and Biden continues to beat the war drums over Russia invading Ukraine.
If The Fed actually raises rates 9 times and dramatically pares back its massive monetary stimulus, it will be “shock and awful.”
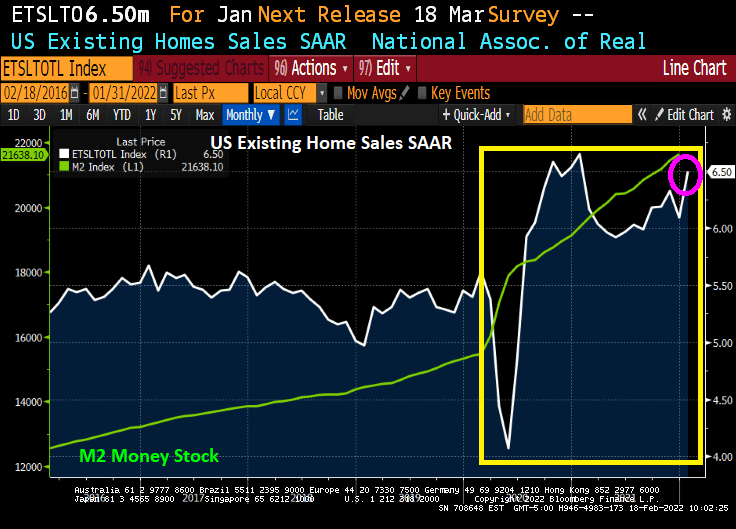
Surprise! US existing home sales in January rose to 6.50 million units SAAR versus the expected 6.10 million units. That is a 6.7% increase over December.
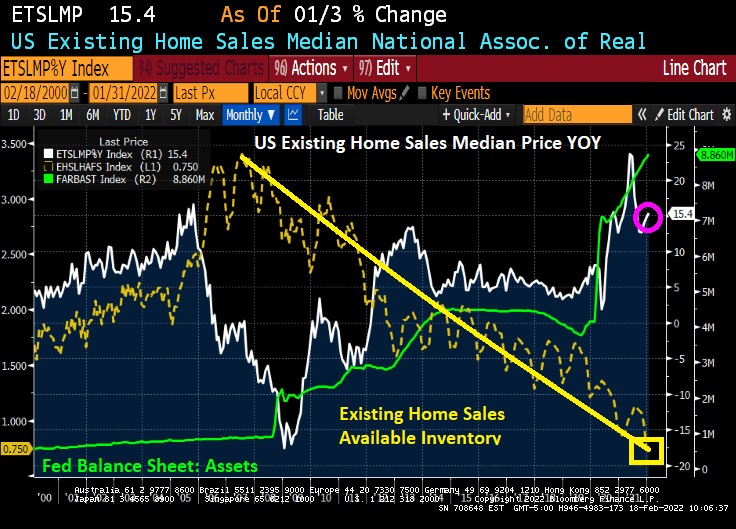
The disturbing news is the continued lack of available inventory that peaked in Q4 2007 and has continued its decline to today … the lowest level of available inventory since 1981. Despite the Fed’s massive stimulus that they allegedly will take away. Median price of existing home sales rose to 15.4% YoY. Making homes affordable should NOT be a slogan for The Federal Reserve, the Biden Administration or Congress.
The massive Federal stimulypto (fiscal and monetary) has helped push existing home sales to 6.50 million units SAAR in January. What will happen after The Fed withdraws it stimulus??
What is surprising is that with declining REAL wage growth, we saw a surge in home buying in January.
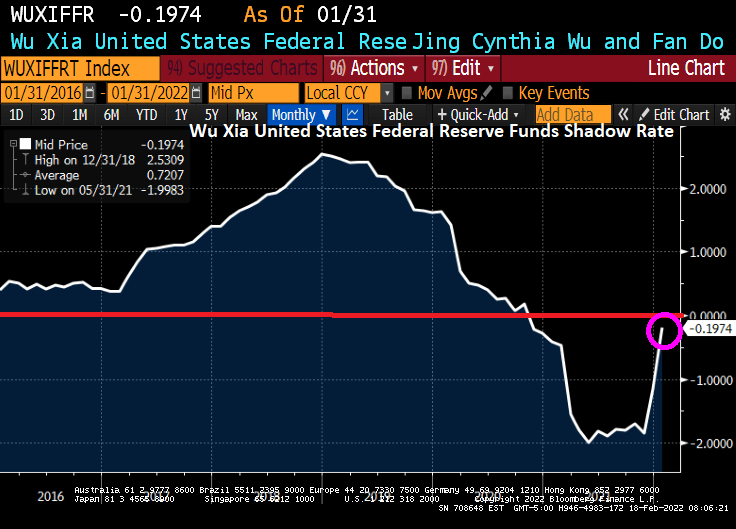
Wu-Xia employs an approximation that makes a nonlinear term structure model extremely tractable for analysis of an economy operating near the zero lower bound for interest rates. It can be used to summarize the macroeconomic effects of unconventional monetary policy (ZIRP + QE). The Shadow Rate is now -0.1974%.
The good news? The Atlanta Fed Wage Growth tracker is showing a 5.1% wage growth. The bad news? Inflation is ruining that growth at a whopping 7.5% rate leaving REAL wage growth at -2.4%.
And the Atlanta Fed’s GDPNow Q1 forecast is a measly 1.285%. Apparently, the fiscal and monetary stimulypto has worn out.
And liquidity in the equity market has seemingly vanished.
The Biden Administration and Congress need a distraction from the awful inflation news caused by Biden’s energy policies, sheer wasteful spending and Federal Reserve policy errors (too much monetary stimulus for too long).
If The Fed does its expected “shock and awe” (or shock and awful), it will be more than the stock markets will crash. The housing market could crash too.
Take the current US housing situation with its limited inventory of listings combined with massive Fed stimulypto.
US 1-unit housing starts are down -4.1% in January. But heck, it is January! But on a year-over-year basis, 1-unit housing starts are down -2.4%. But what will happen if The Fed ACTUALLY withdraws its gargantuan monetary stimulus (green line)?
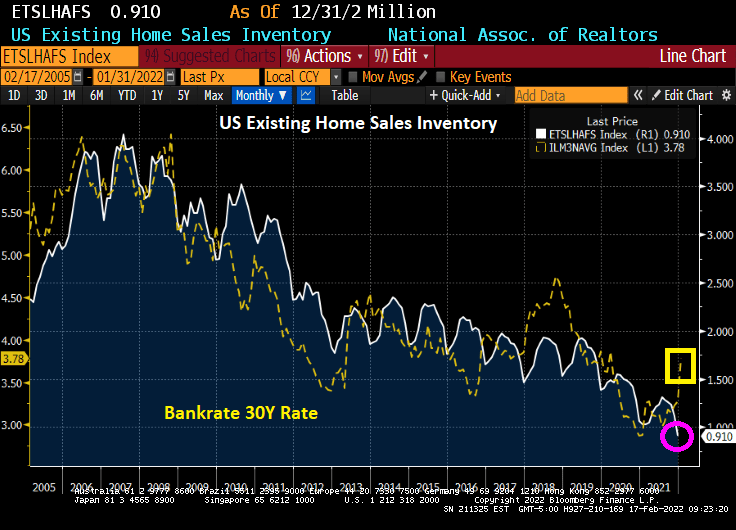
Existing home sales inventory continues to decline as Bankrate’s 30-year mortgage rate starts to climb with expectations of Fed “Shock and Awful.”
Say hello to The Federal Reserve Board of Governors!
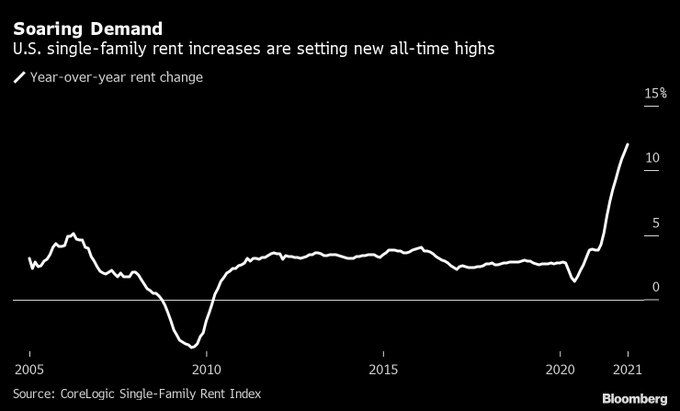
Call this a double whammy! Red-hot rents combined with a slowing economy.
According to CoreLogic, single-family annual rent growth finished 2021 at a new record: 11.7% YoY for high tier rental properties and 10.4% YoY for low tier rental properties.
Of course, southern and southwest rental properties are seeing the fastest rent growth. Particularly Miami at 36% YoY. Phoenix is no slouch at 19% growth in rents.
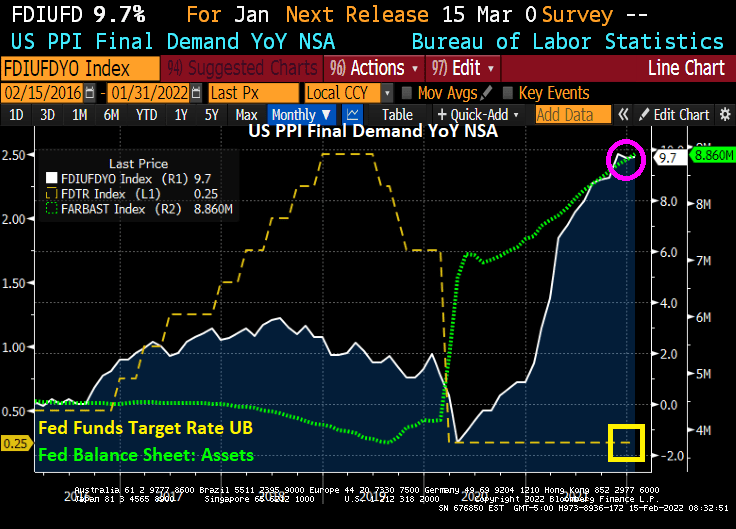
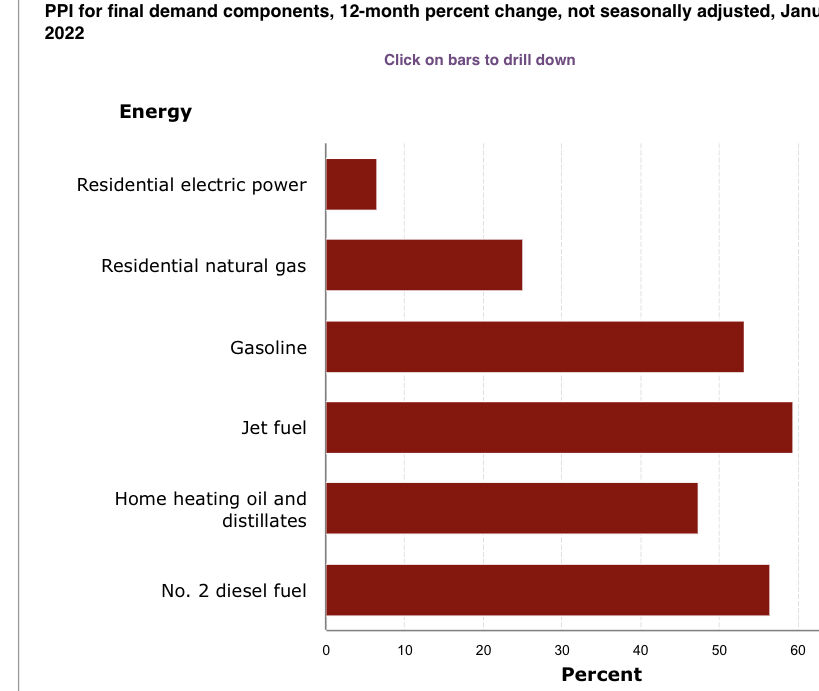
Today, the Final Demand Producer Price Index (PPI) printed at 9.7% YoY.
Biden claimed inflation was caused by COVID. How about 1) Biden’s anti-fossil fuel policies combined with 2) excessive fiscal (Biden and Congress) and excessive monetary stimulus (Fed)?
The Fed held its behind-closed-doors meeting on Monday, but nothing has been released about what they discussed. Suffice it to say, they have left the staggering monetary stimulus in play.
I wonder if The Fed is concerned about a soft landing with proposed rate increases.


You must be logged in to post a comment.