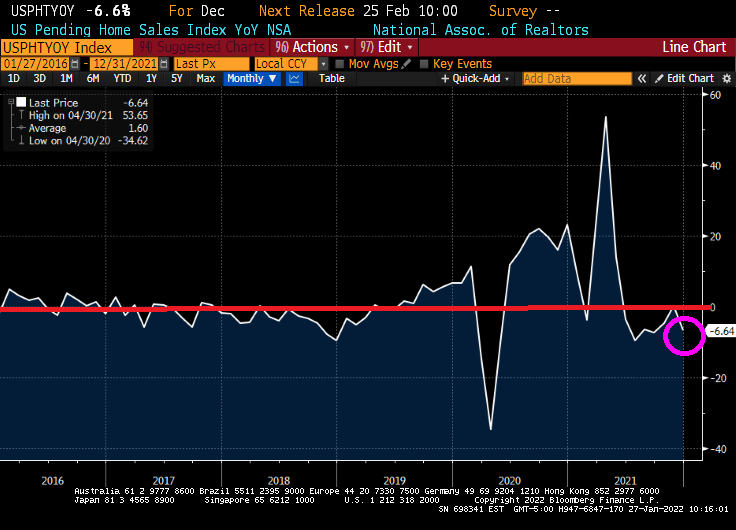
Pending home sales in the USA tanked 6.64% YoY. Yes, it was for December, but down 6.64% YoY means that pending home sales are lower than last December.
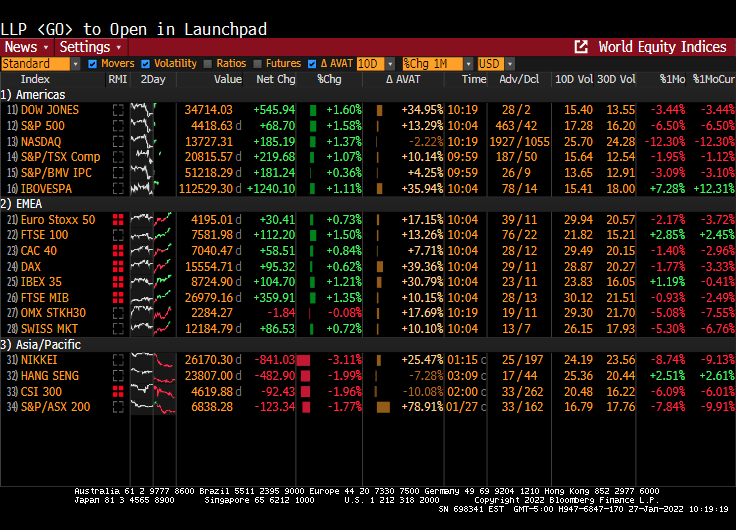
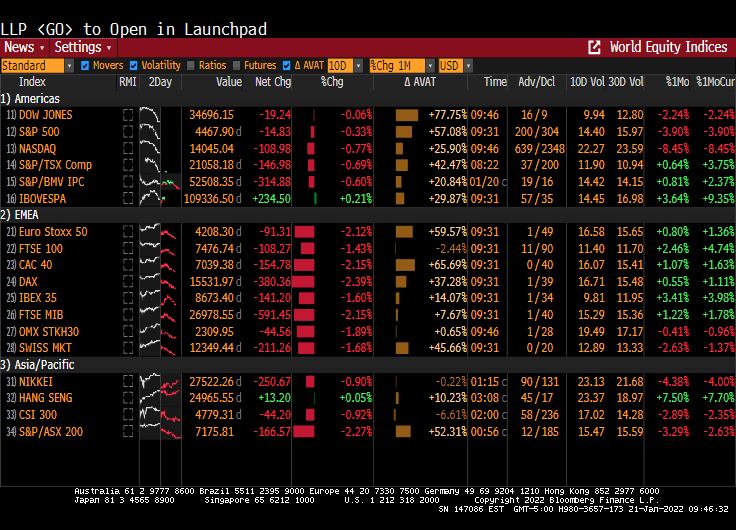
And the stock market was up across the board as Powell refused to take his foot off the monetary gas pedal.
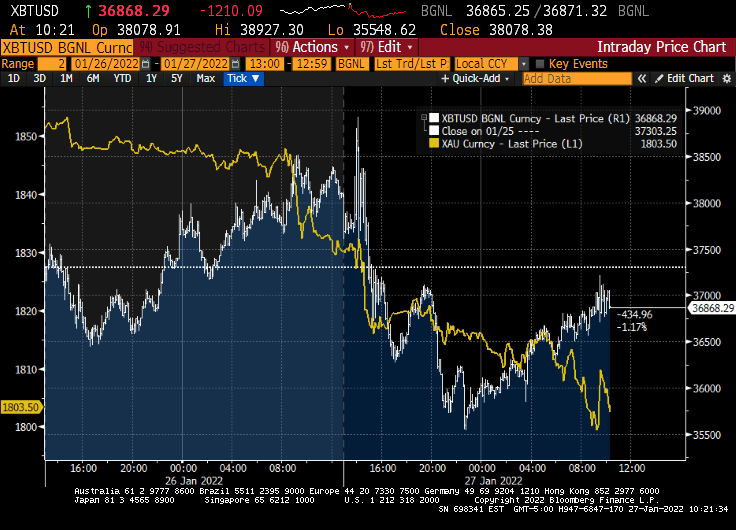
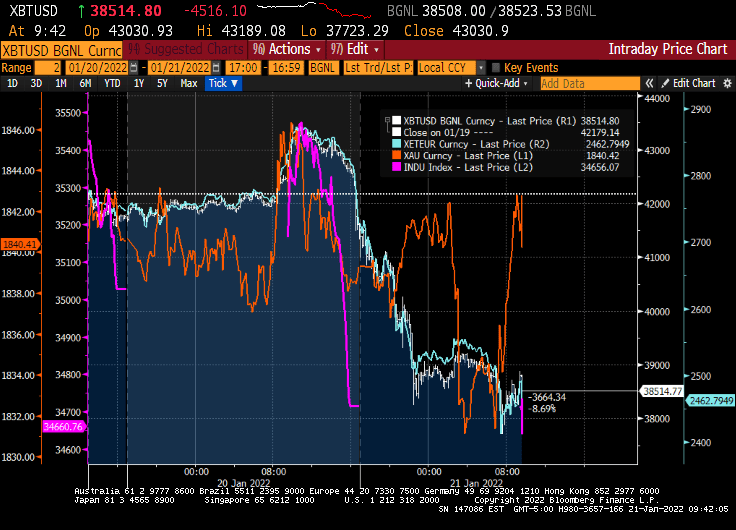
Gold is down along with Bitcoin for you ALT investment types.
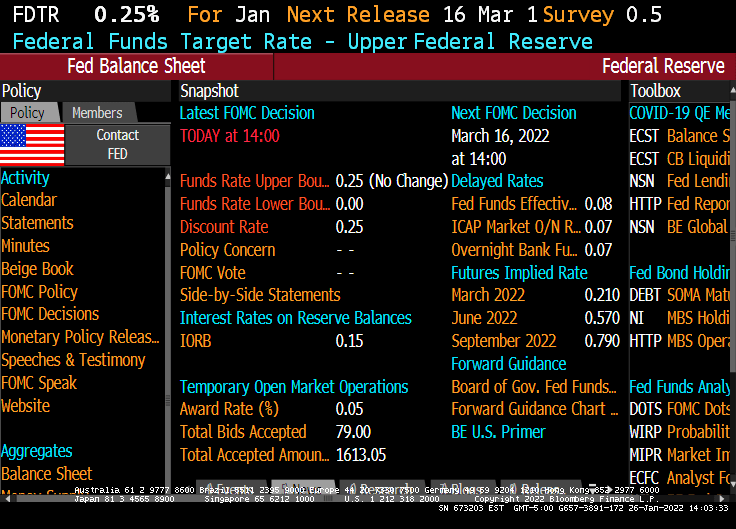
Yes, The Federal Reserve could have raised their target rate at their January meeting, but chose not to raise rates. Instead, Chairman Powell said that rate increases are a comin’!
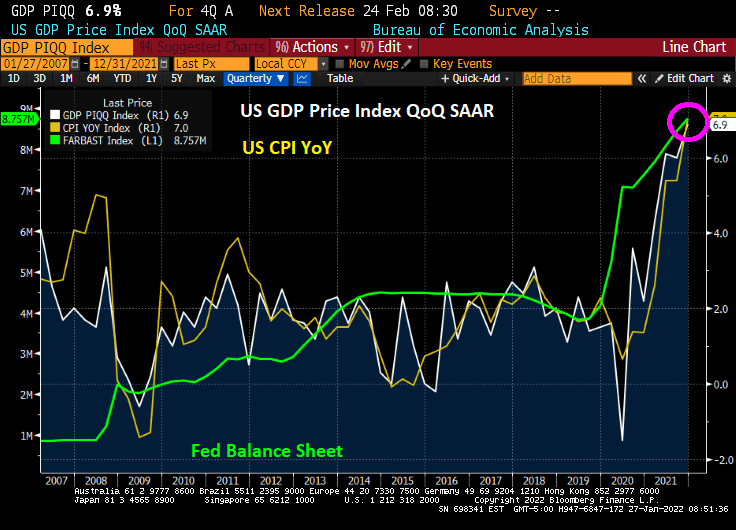
I hope Powell wasn’t hoping for a slowdown in inflation, because today’s Q4 GDP report showed a surge in GDP to 6.9% QoQ. But with that GDP surge we also got a surge in prices paid by consumers to 6.9% as well. Thanks to the continuing massive Federal stimulus being poured into markets.
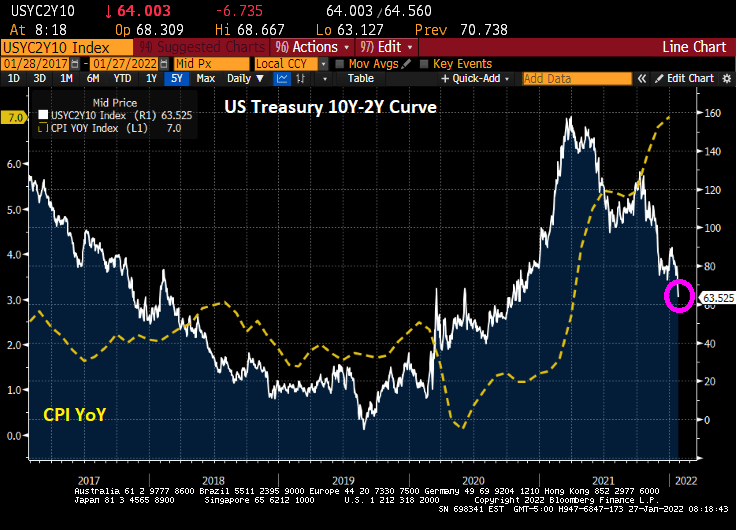
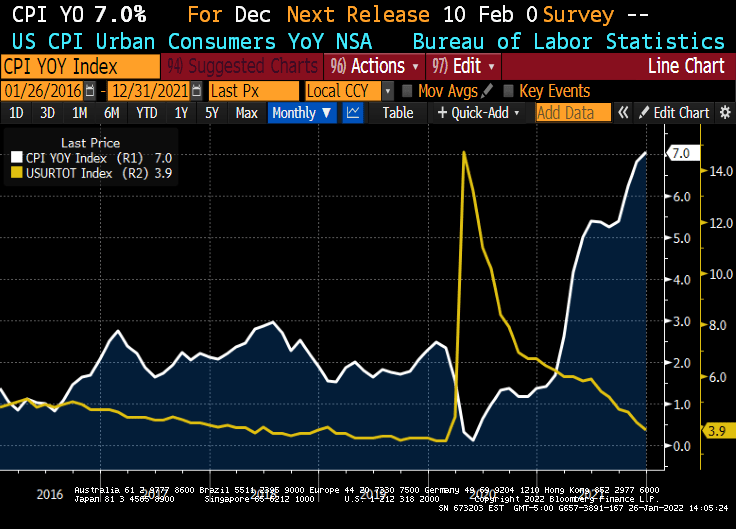
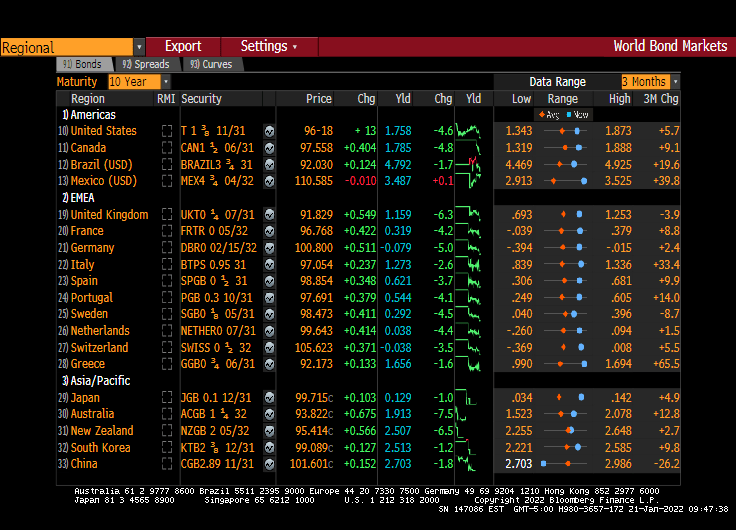
Despite the positive news on Q4 GDP, we are still seeing 7% inflation and a diving 10Y-2Y yield curve.
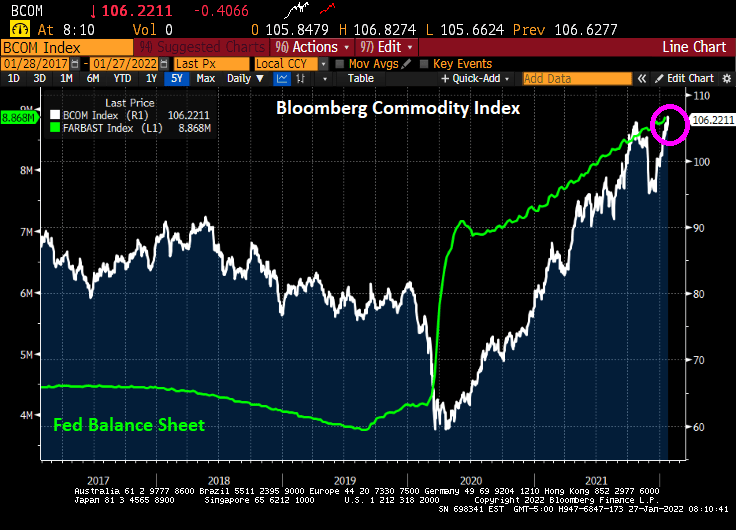
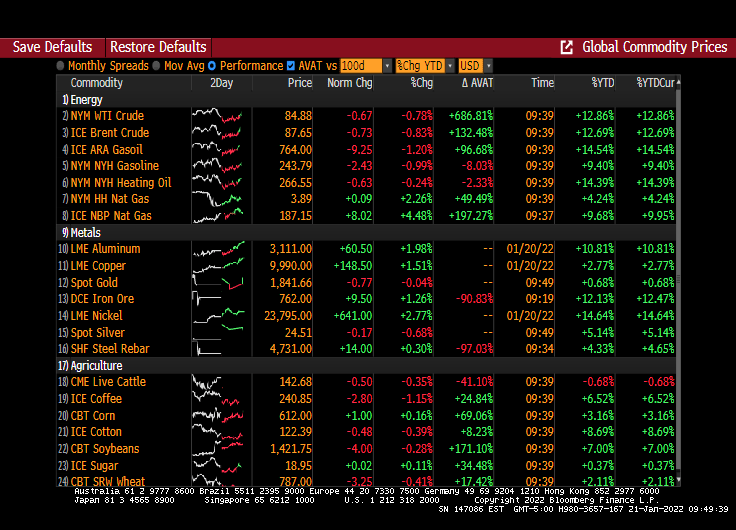
Along with that surprising GDP report, we are seeing the Bloomberg Commodity Index rising like a bat out of hell (RIP, Meatloaf).
Despite inflation growing at 7% (versus The Fed’s target rate of 2%) and U-3 unemployment being only 3.9%, one would have thought that Jay and The Gang would have started increasing rates at the January meeting.
But nooooo. The Fed actually sat on their hands and did nothing.
What did The Fed say?
“The Committee seeks to achieve maximum employment and inflation at the rate of 2 percent over the longer run. In support of these goals, the Committee decided to keep the target range for the federal funds rate at 0 to 1/4 percent. With inflation well above 2 percent and a strong labor market, the Committee expects it will soon be appropriate to raise the target range for the federal funds rate. The Committee decided to continue to reduce the monthly pace of its net asset purchases, bringing them to an end in early March. Beginning in February, the Committee will increase its holdings of Treasury securities by at least $20 billion per month and of agency mortgage‑backed securities by at least $10 billion per month.“
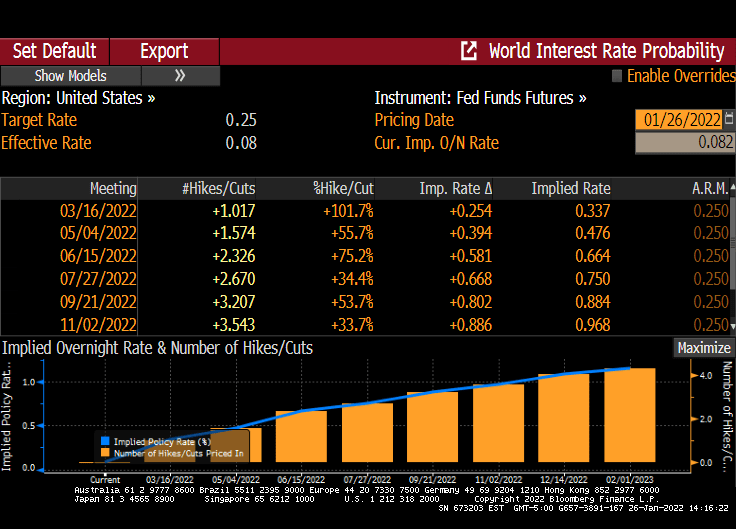
According to The Fed Funds Futures data, the market is anticipating 1 rate increase at the March FOMC meeting. And another at the June FOMC meeting.
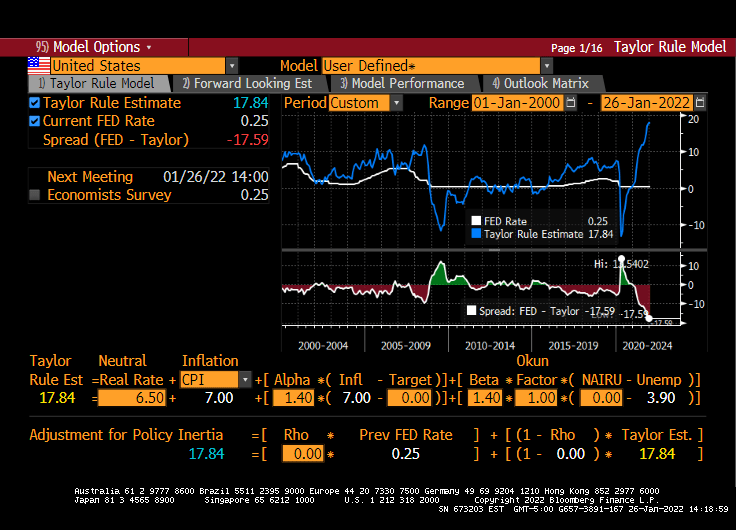
The Taylor Rule (not used by Jay and The Gang), suggests that The Fed should have their target rate at almost 18%! NOT 0.25%.
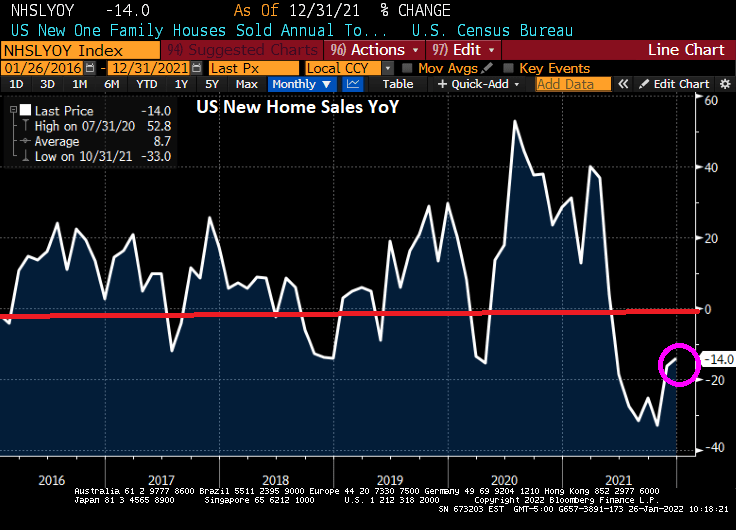
US new home sales spiked in December by 11.9% from November, but were down 14% year-over-year.
But the median price of new home sales (YoY) declined to 3.4%.
The Midwest saw a surge in new home sales (+56%).
The MBA’s mortgage applications index shows declining purchase applications (-1.83%) and declining refinancing applications (-12.60%) as mortgage rates increased from 3.64% to 3.72% for the week of 01/21.
Now, mortgage purchase applications rose for the week of 01/21 if we used non-seasonally adjusted data.
The Case-Shiller National home price index “slowed” to 18.81% YoY in November as The Fed continues its monetary stimulypto. Notice that The Fed is easing even when there is limited inventory available. Result? Hideous home price inflation.
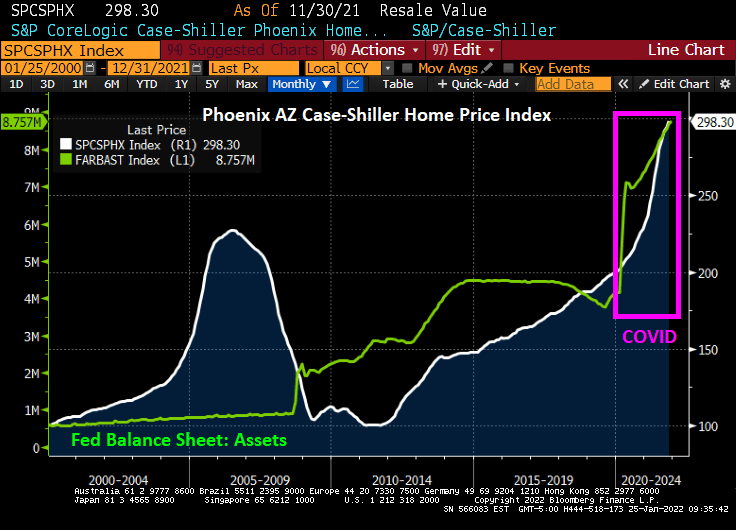
Which metro area is growing the fastest, making housing even more unaffordable for renters? Phoenix AZ is growing at a 32.2% YoY clip while Washington DC is the slowest growing metro area at 11.1% YoY. The second faster growing metro area in Tampa FLA.
Phoenix AZ is growing at the fastest rate in the nation as The Fed still has its monetary stimulus at FULL SPEED AHEAD.
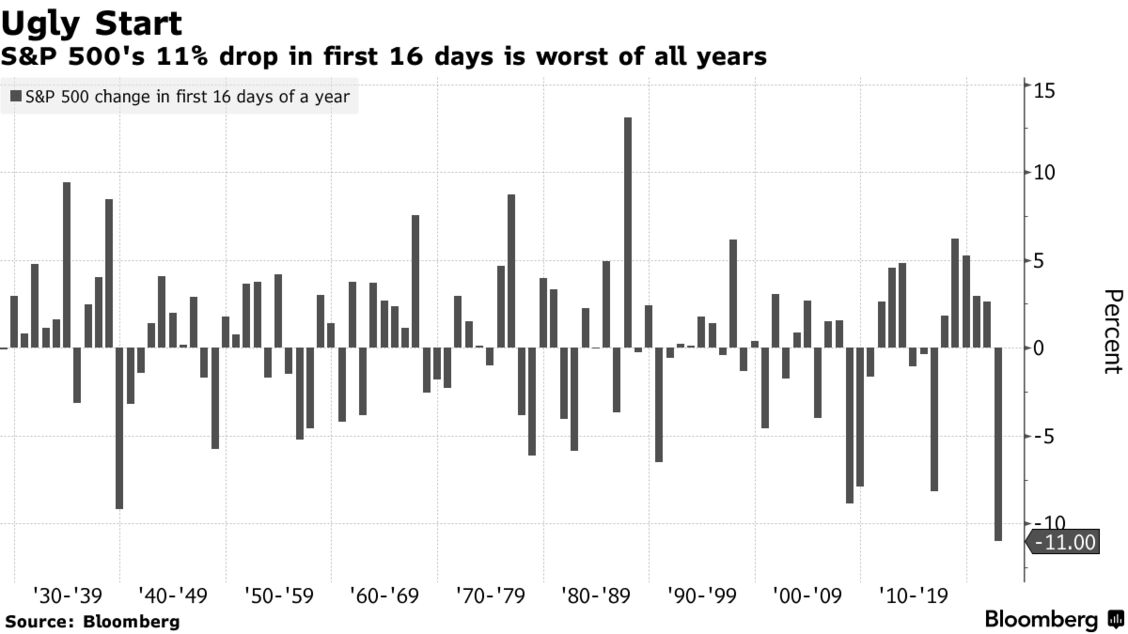
The stock market has never started a year falling as quickly as it is now.
The S&P 500 has dropped 11% — heading into correction territory — in the first 16 trading days of 2022 in its worst-ever start to a year, according to Bloomberg data that goes back over nine decades.
The downturn comes as traders brace for the Federal Reserve to tighten monetary policy and a surge in U.S. Treasury yields weighs on the outlook for stocks. A host of technical signals also suggest that more volatility may be coming up ahead.
“The Fed pulled the punchbowl, liquidity has evaporated, and the S&P and NDX broke below their 200dma for the first time since the Covid outbreak,” said Rich Ross, technical strategist at Evercore ISI.
A bear market down to the 3,800 level is likely for the S&P 500, Ross said, given “the dramatic erosion of the technical backdrop, in conjunction with the highest inflation, tightest policy, and most uncertain political and geopolitical condition in years” — not to mention its historic rally since 2020.
The Shiller CAPE ratio is extremely high …. not surprising how much air The Fed pumped into the market tires.
It has been a tough 7 days for Bitcoin, Ethereum and the NASDAQ composite index as The Fed is anticipated to raise their target rate AND engage in quantitative tightening.
While the NASDAQ composite index has been deflating over past 7 days, Bitcoin and Ethereum plunged in recent days. What is going on??
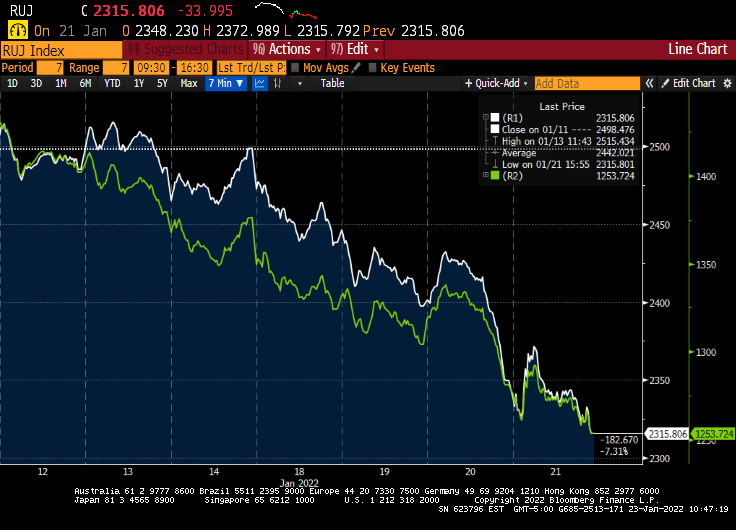
The Russell 2000 value (white) and growth (green) indices are both deflating.
With regards to anticipated Fed rate increases, Fed Funds Futures are signaling almost 4 rate hikes in 2022 and 4 by the February 2023 meeting.
Then we have the massive increase in The Fed’s balance sheet after COVID struck in early 2020. Now, with the S&P 500 skyrocketing (until 7 days ago), why is The Fed buying sooooo much Agency MBS??
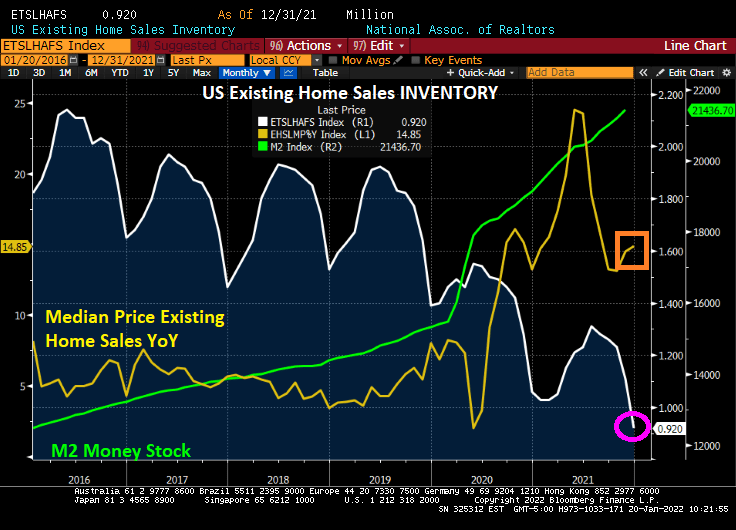
The banner headline is … US existing home sales declined 4.6% MoM in December. But that isn’t the interesting news. The interesting news is the mystery of the missing housing inventory. While various pundits told us that inventory would be returning … it isn’t. And the median price of existing home sales is up 14.85% YoY with insane Fed stimulus still in play.
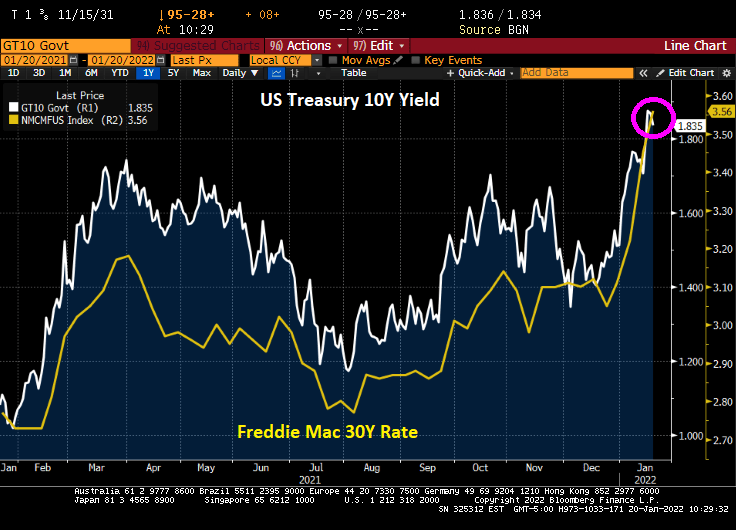
That was December. What will January bring with rising mortgage rates? Freddie Mac’s 30-year commitment rate rose to 3.56% today.
When will housing inventory for sale start to increase? Probably about the same time The Fed ACTUALLY starts raising interest rates and paring back on the monetary stimulus.
Treasury Secretary Janet Yellen is having trouble with the curve (yield curve, that is). It keeps inching up, meaning that Treasury’s cost of debt financing is inching up too.
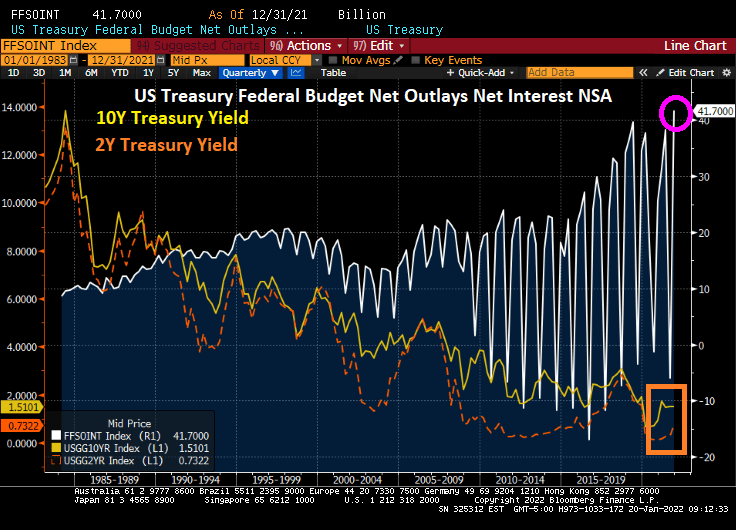
As Treasury yields keep rising, so does the problem of financing the massive Federal debt load. Here is a chart showing the interest outlays in the Federal budget against the cost of Federal funding at the 10-year and 2-year tenors.
Now, The Fed is predicted to raise their target rate 4 times in 2022 (according to Fed Funds Futures data) and it looks like a whopping 100 basis points (or 1%). Holding the rest of the yield curve constant, this will considerably flatten the 10Y-3M Treasury curve. Resulting in a more expensive refinancing of the Federal Debt load.
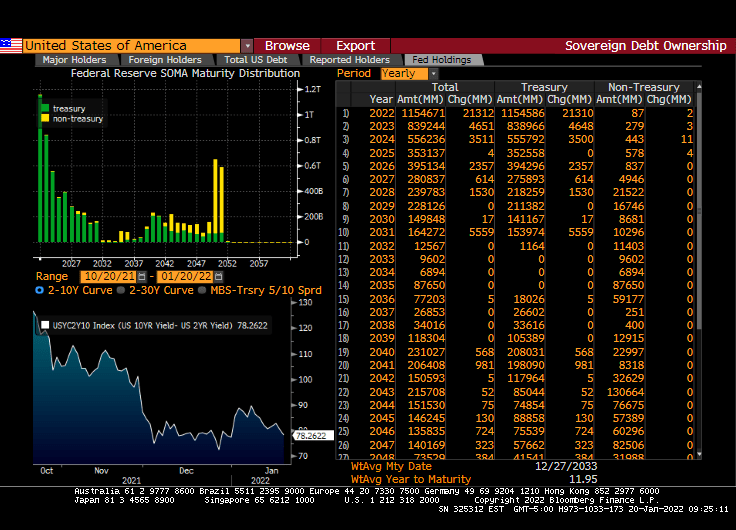
If we look at The Fed’s System Open Market Holdings (SOMH), we can see that The Fed’s holdings are primarily Treasuries with non-Treasuries (primarily agency mortgage-backed securities) not maturing (or running off) until 2050.
The majority of The Fed’s COVID expansion was picked-up by The Fed (light blue line).
How about the Treasury Inflation-protected Securities curve? Negative yields across the tenor range.
With Congress trying to spend trillions more (since Build Back Broke failed, Democrats are producing MORE spending legislation with the voting act included, of course), Treasury is going to have progressively more trouble with the (Treasury) curve.


You must be logged in to post a comment.