Housing in the US is simply unaffordable, particularly after HUD levied new regulation rising the cost of new housing up to $31,000. Wait for this to kick into the data for mortgage demand!
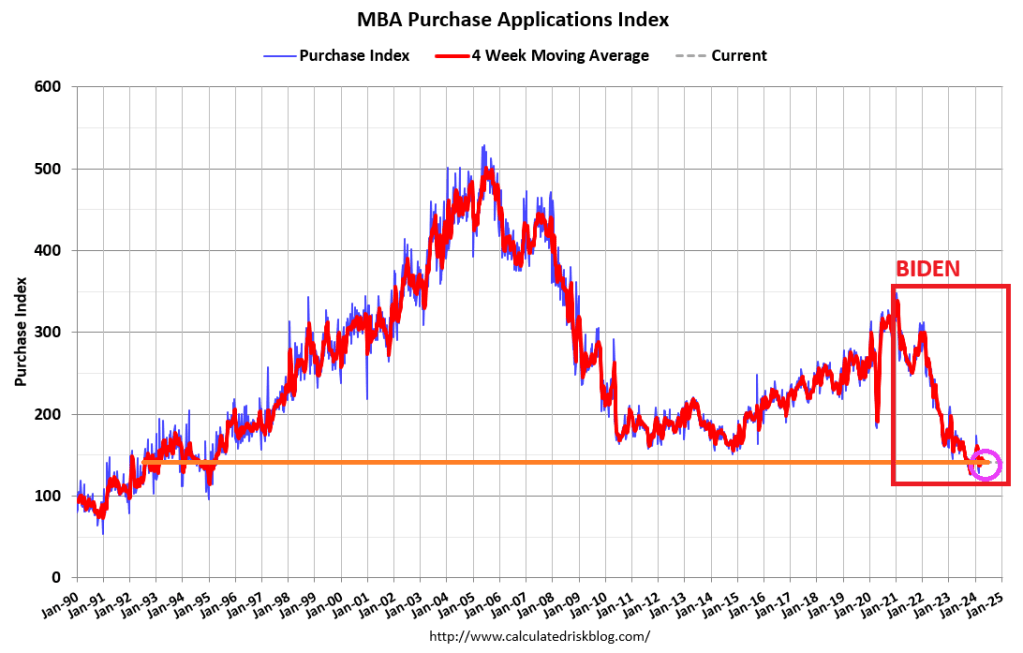
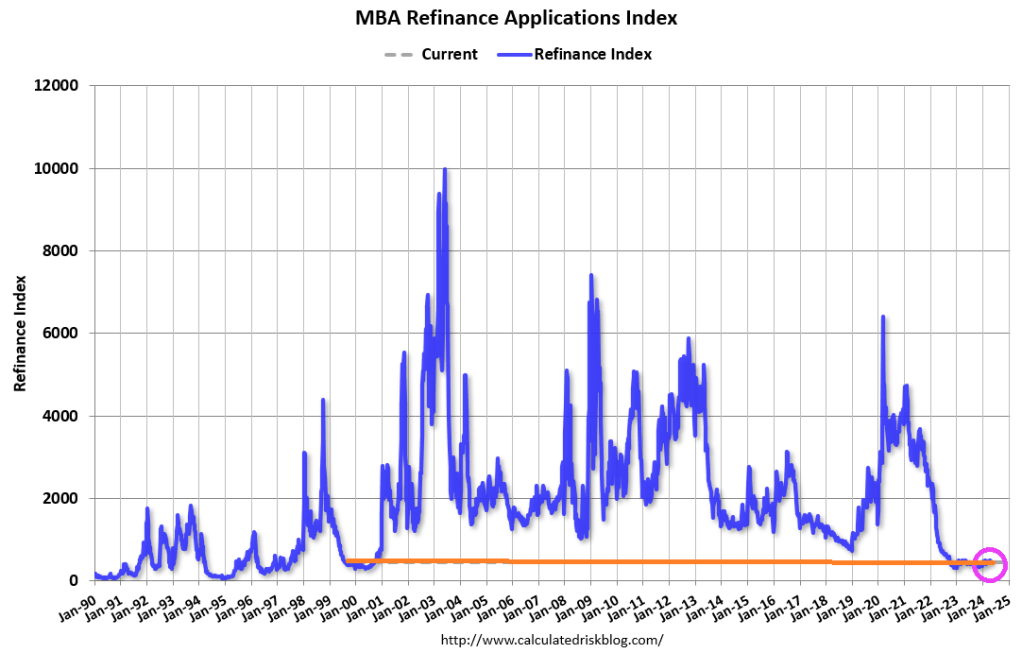
Mortgage applications decreased 2.3 percent from one week earlier, according to data from the Mortgage Bankers Association’s (MBA) Weekly Mortgage Applications Survey for the week ending April 26, 2024.
The Market Composite Index, a measure of mortgage loan application volume, decreased 2.3 percent on a seasonally adjusted basis from one week earlier. On an unadjusted basis, the Index decreased 1.4 percent compared with the previous week. The seasonally adjusted Purchase Index decreased 2 percent from one week earlier. The unadjusted Purchase Index decreased 1 percent compared with the previous week and was14 percent lower than the same week one year ago.
The Refinance Index decreased 3 percent from the previous week and was 1 percent lower than the same week one year ago.
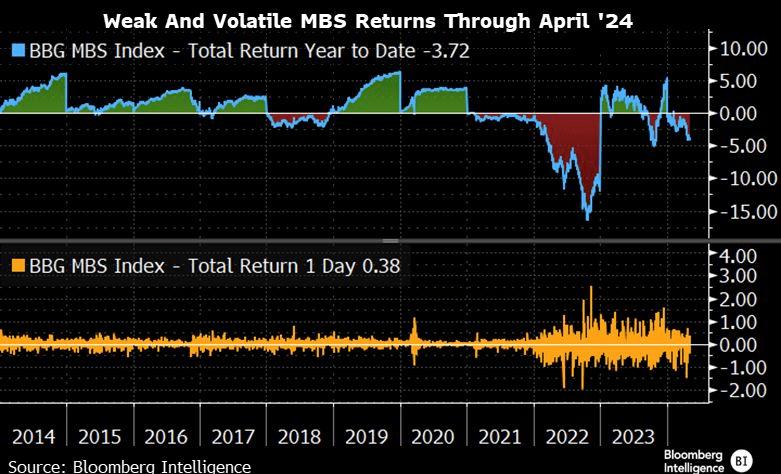
MBS returns are weak and volatile.
How is the Biden Regime making homeownership more affordable? They aren’t. The are using regulations, to drive the cost of new housing way up. New HUD energy rules will raise the cost of home construction by imposing stricter building codes. The National Association of Home Builders says the energy rules can add as much as $31,000 to the price of a new home. Payback time is 90 years (how long it will take the recoup the initial investment).
Under Biden’s “leadership” we are all addicted to gov. But at least Ukraine and Zelenskyy will be getting a guaranteed 10 years of financial support from the US … while E Palestine Ohio and Maui remain destroyed.
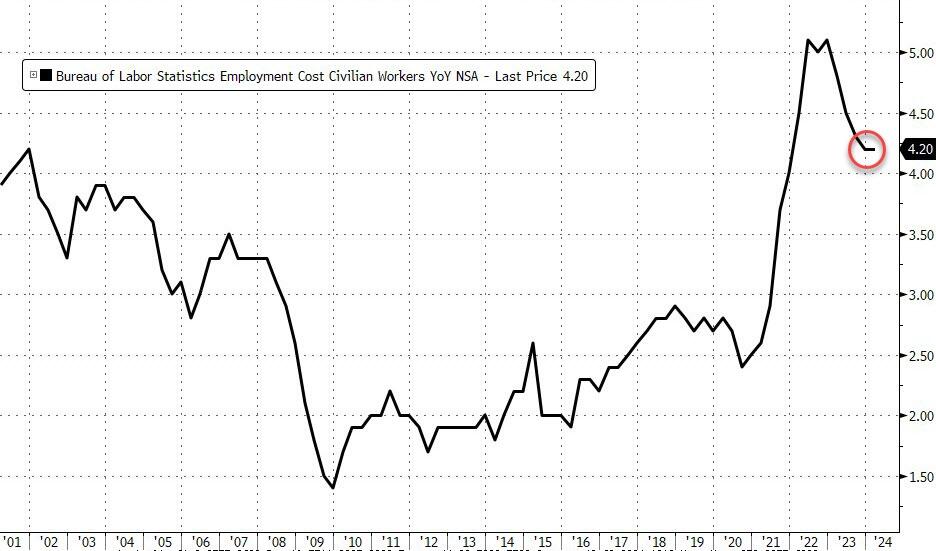
Janet Yellen, world class propagandist (US version of Baghdad Bob) and US Treasury Secretary under Biden, was so wrong about inflation. Instead of being “transitory”, turns out to be seemingly permanent.
Today’s Case-Shiller home price report was released for February. The National Home Price index was up 6.4% year-over-year. But look at the explosion of M2 Money and home prices. Hmm.
If we look at home prices and M2 Money on a year-over-year (YoY) basis, we can see the surge in money printing with COVID and the corresponding surge in home prices. As M2 Money growth slowed, the Case-Shiller National HPI slowed as well … until The Fed slowed the declined in M2 Money growth resulting in rising home price growth again.
So, The Fed will likely have to keep on printing. You can see Janet Yellen dancing to the thought of printing more money.
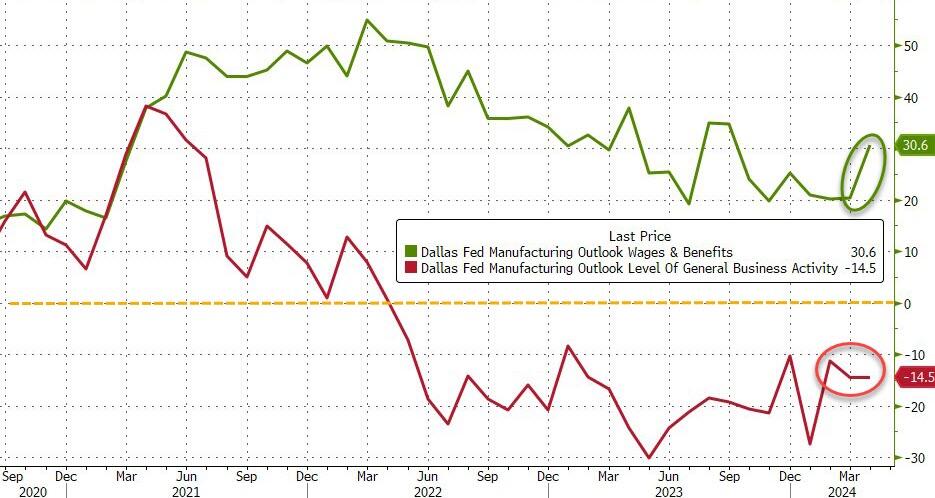
New Orders also remain negative (but did improve) and prices continue to rise (though at a slower pace). Labor market measures suggested flat employment and slightly shorter workweeks (hours worked index remained negative for a seventh month in a row) this month.
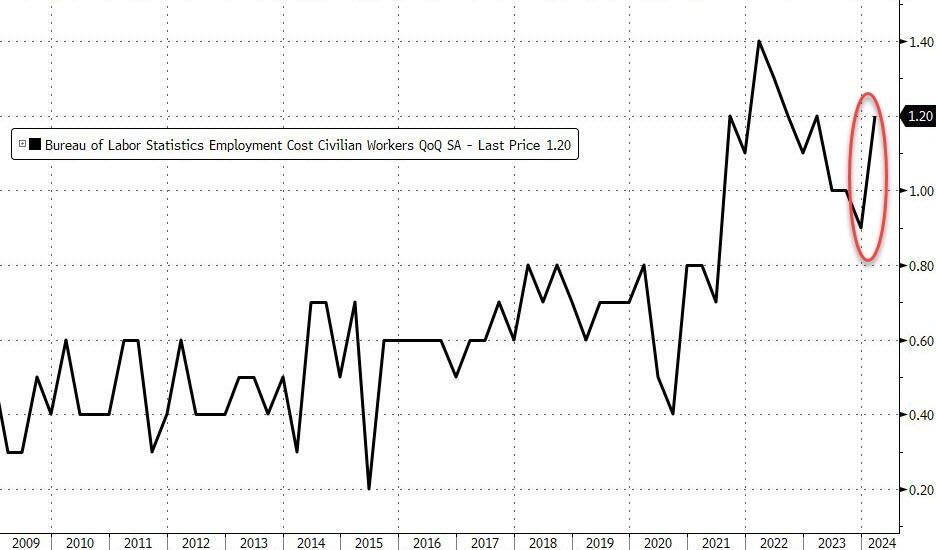
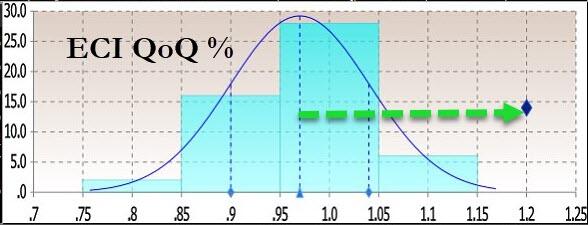
However, wit that said, wage pressure picked up dramatically this week to a seven-month high…
Source: Bloomberg
However, as always, we glean the most informative perspective from the respondents completed surveys where the pessimism shines through…
The business and political environment is terrible.
Business has not been this slow since COVID, and I’m worried.
Consumer confidence for consumer goods has noticeably worsened.
Customer orders have dropped. The indication is the economy is hurting spending in our area specifically. Customer uncertainty is worsening.
I keep thinking we’ll hit bottom and either level out or turn up, but we keep pushing those hopes out a month, and another month, and another.
There has been a decrease in new orders for three weeks now. Currently, we think this will come around, but we get more concerned as time goes on.
Industrial manufacturing is showing signs of positivity due to the possibility of an interest rate decrease. Please do it. Manufacturing is really hurting.
High prices remain problem for many businesses:
Inflationary pressures on raw materials and construction costs are driving up the cost of public projects. This is causing states to delay or scramble for funding for projects that have long lead times.
Business is generally good, but we’re starting to see more customer resistance to prices. Our costs have increased dramatically over the last two years, and we have customers asking to hold prices to last year’s level, which we just can’t do. We continue to make capital investments to improve productivity and reduce unit labor cost.
And finally, many are fearful of another four years of Bidenomics:
Political instability and politicization have hampered growth.We are entering stagflation.
Fewer governmental regulations would lower our cost of doing business. An example is the 332 report, which we must fill out for the U.S. government; it has no value for us, just expense.
Business is extremely slow, and we see no signs of improvement.We think it will stay slow until after the presidential election, after which, we will either have four more years of slow business or an improving economy.
Joe Biden could barely eat his dinner at the White House Correspondents’ Dinner. And we think he is calling the shots in The White House?? Oh well. Perhaps it is Treasury Secretary Janet Yellen or Klaus Schwab of the World Economic Forum.
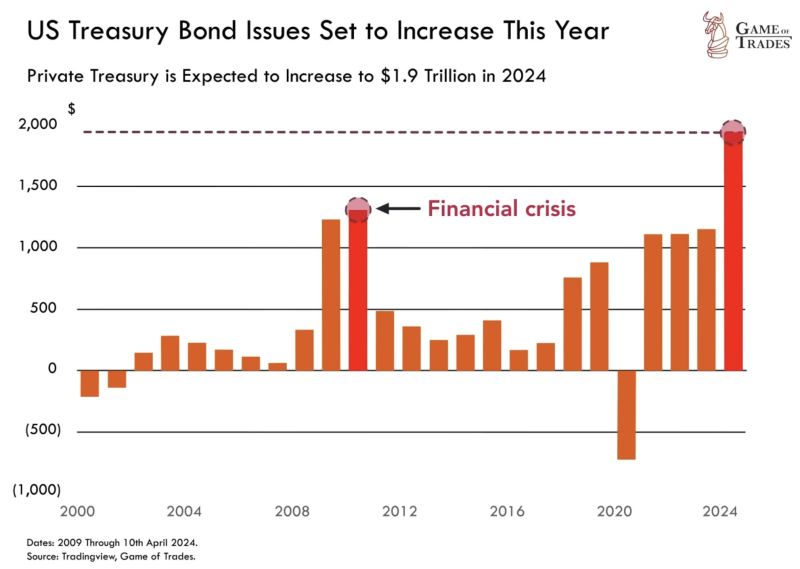
In any case, Treasury bond issuance in 2024 is expected to hit $1.9 TRILLION. Surpassing levels seen even during the 2008 financial crisis.
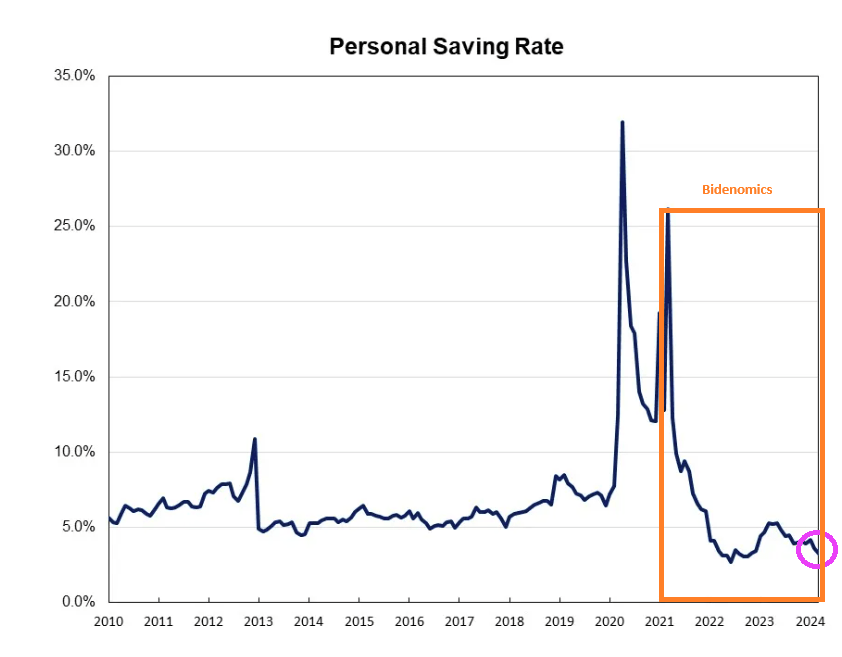
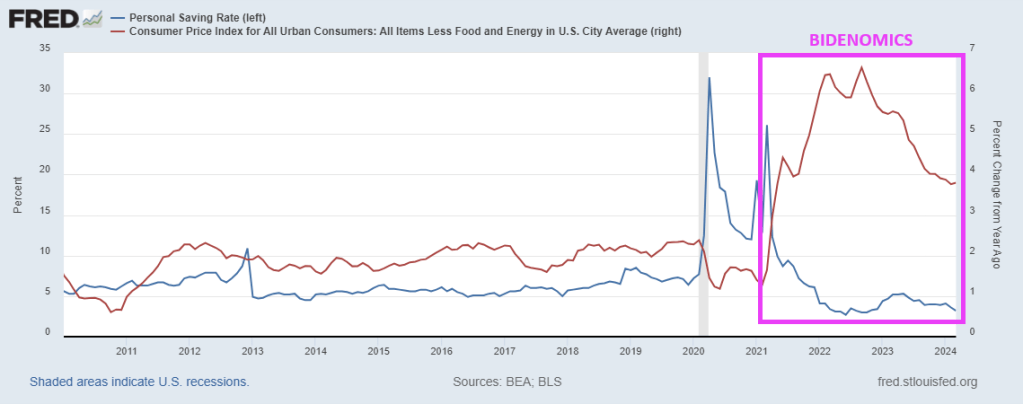
And with inflation, the US personal saving rate is near the lowest level since Obama (2010).
And with the core inflation rate still higher than anytime since 2010, households are paying more for … everything depleting their savings.
With Biden and Congress spending like drunken sailors on shore leave, and no end in sight, this will eventually explode. Ukraine, foreign aid, no border security, virtually no money for Maui fire, E. Palestine Ohio is still a wreck, etc. They always have money for someone else. And if Trump is elected in November, watch CNN and MSNBC and Biden/Congress blame Trump.
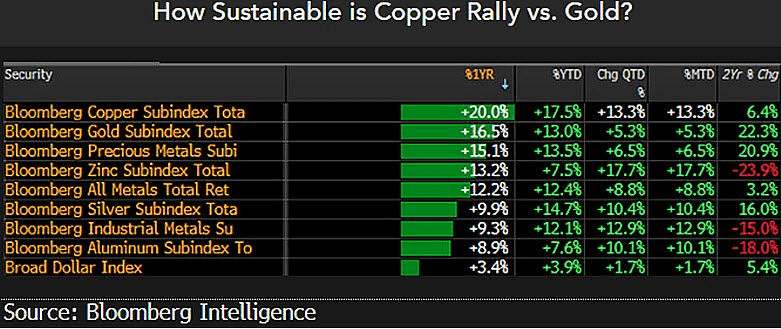
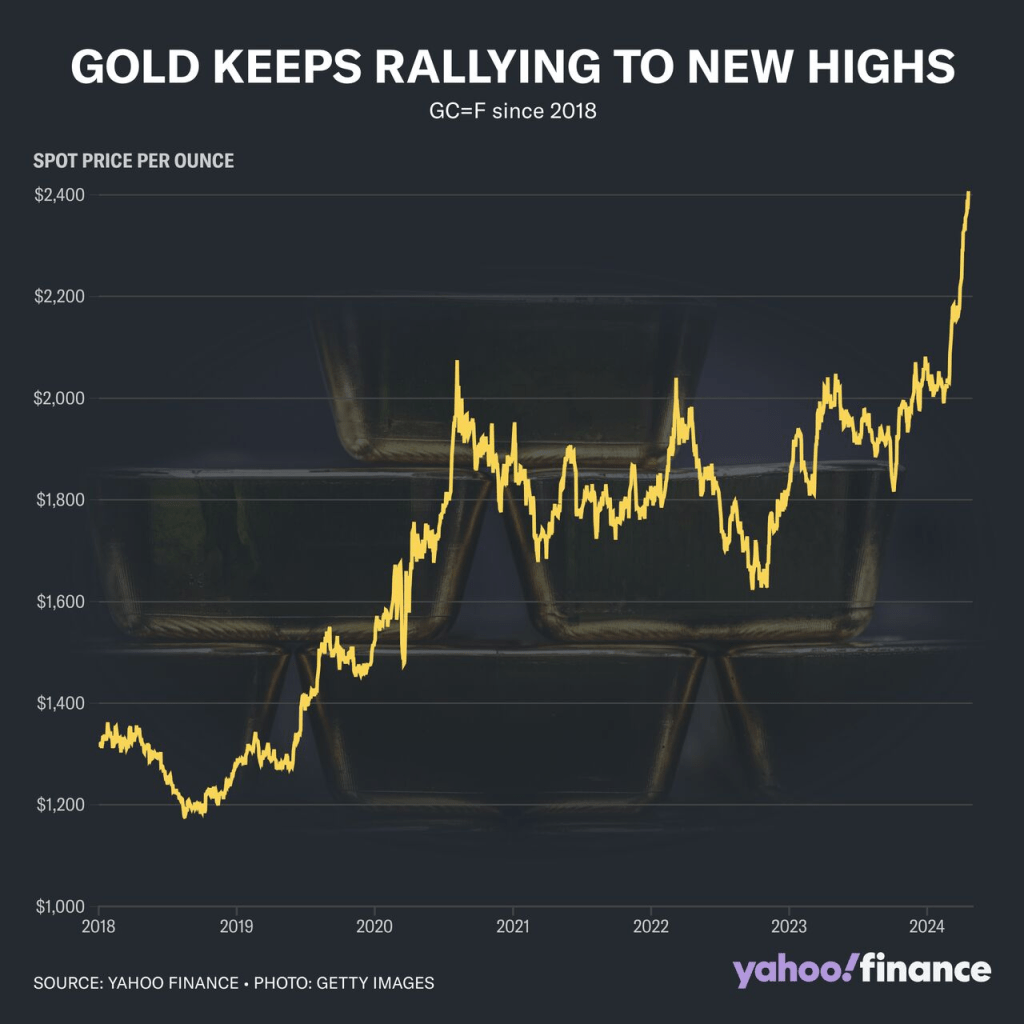
Commodities are a way to protect yourself against the government and their insane spending and debt.
My point? Gold keeps rising!
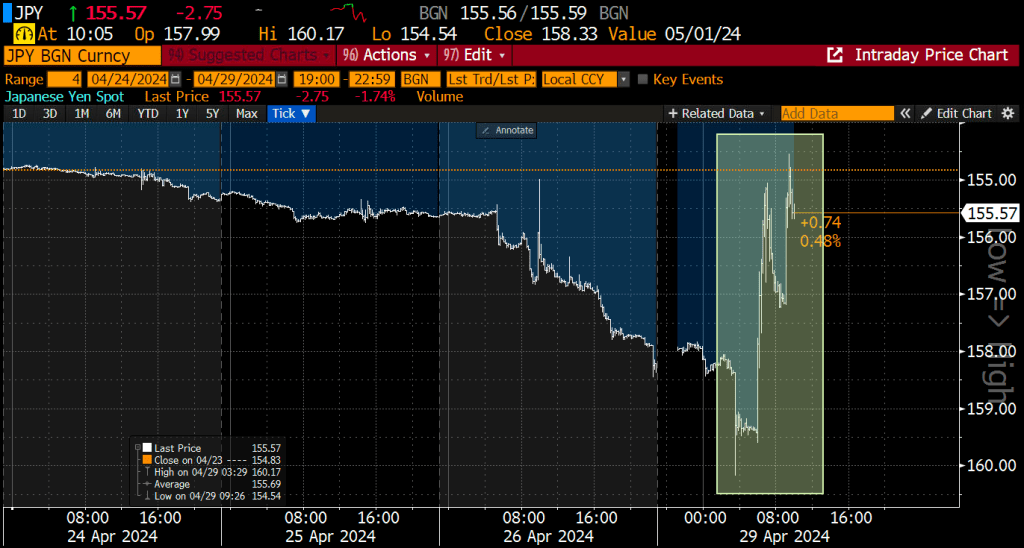
The leading foreign holder of US debt is Japan, which is following the insane path as the US and resembles a banana republic.
Former Fed chair under Obama and current Treasury Secretary Janet Yellen under Biden is Doctor Wonderful. NOT!!
I don’t know what Biden thinks is so funny. Maybe it is because House “Majority” Leader Mike Johnson (RINO-LA) gave Biden and Schumer everything they wanted (Ukraine, Israel funding but nada for security our borders). Life is good when you are stupid and mean-spiritied like Joe Biden!
Biden is so vain: capped teeth, hair plugs, constant tan, face lifts, etc.
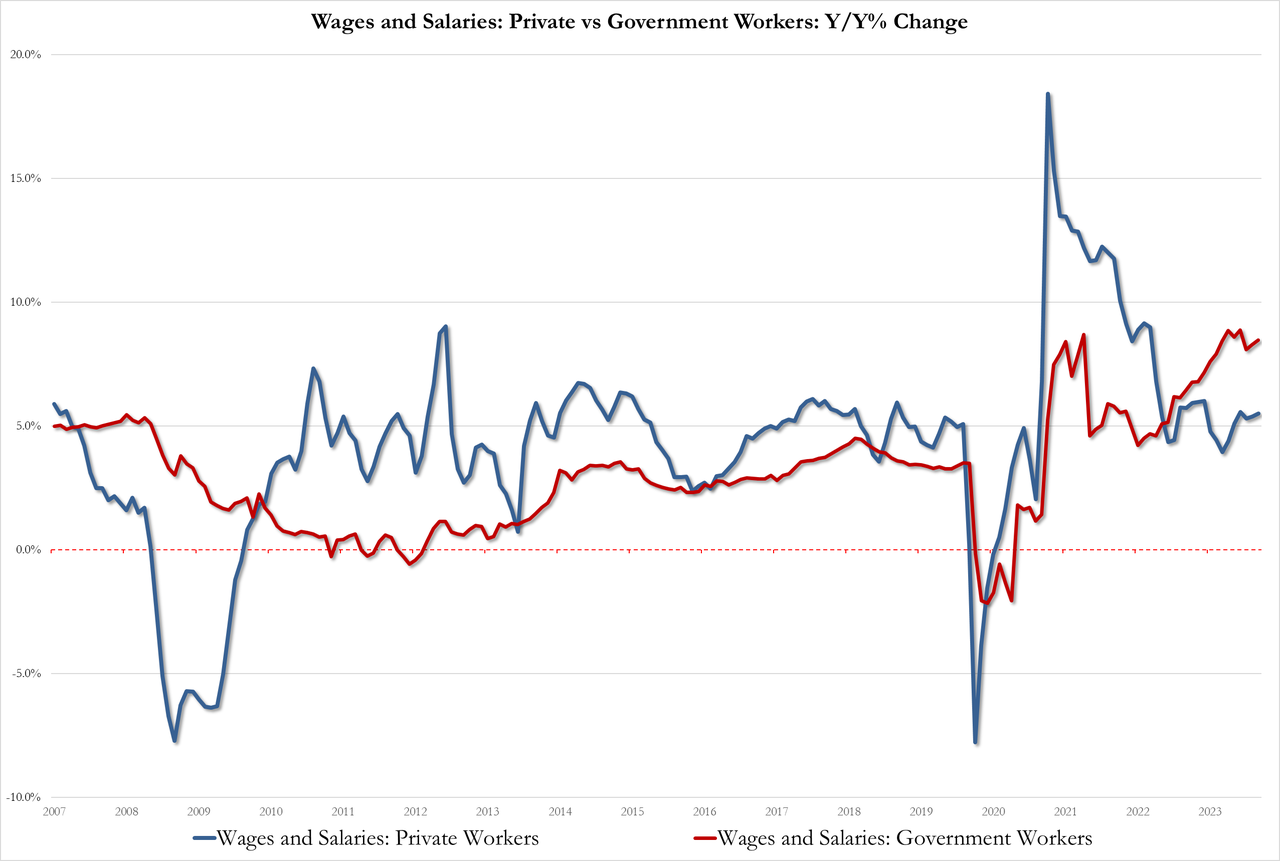
Today’s economic news highlights “Government Power.” Unproductive government jobs saw wages rise 8.5% YoY while productive private sector jobs saw wages rise by only 5.5% YoY. This is Bidenomics!!!
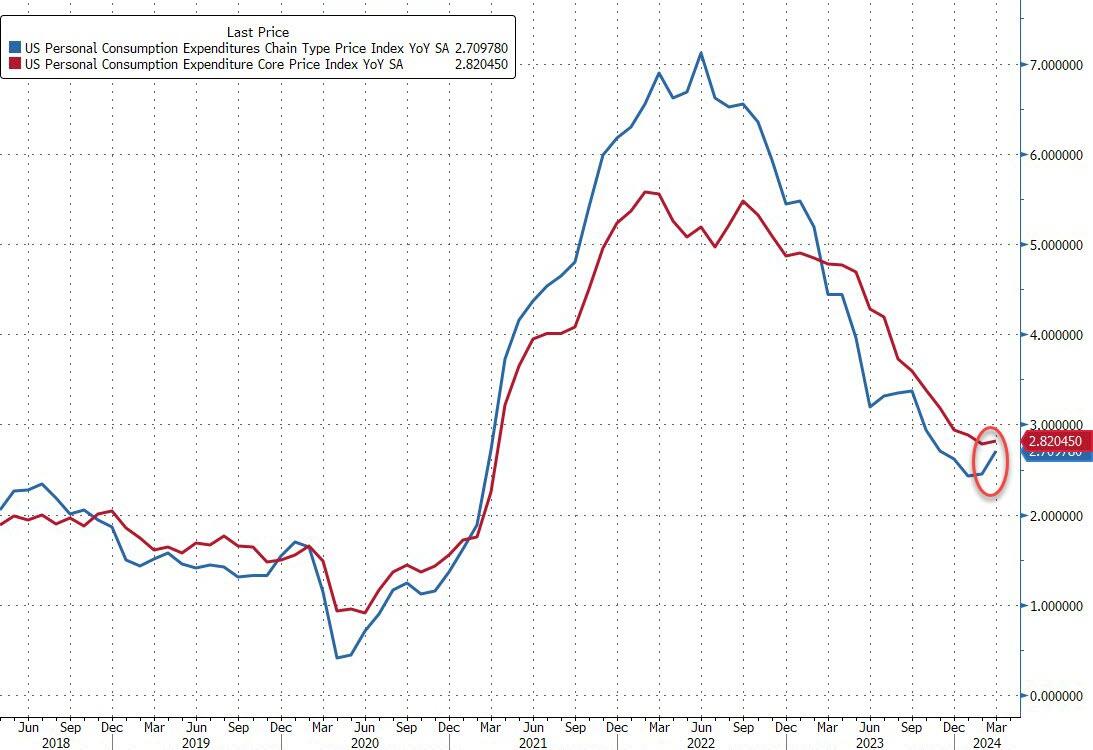
…the doves’ last chance for sooner than later rate-cuts is today’s Core PCE Deflator – often described as The Fed’s favorite inflation signal. Last month saw an uptick in the headline deflator and following yesterday’s core PCE rise for Q1, all eyes are on the March data released this morning.
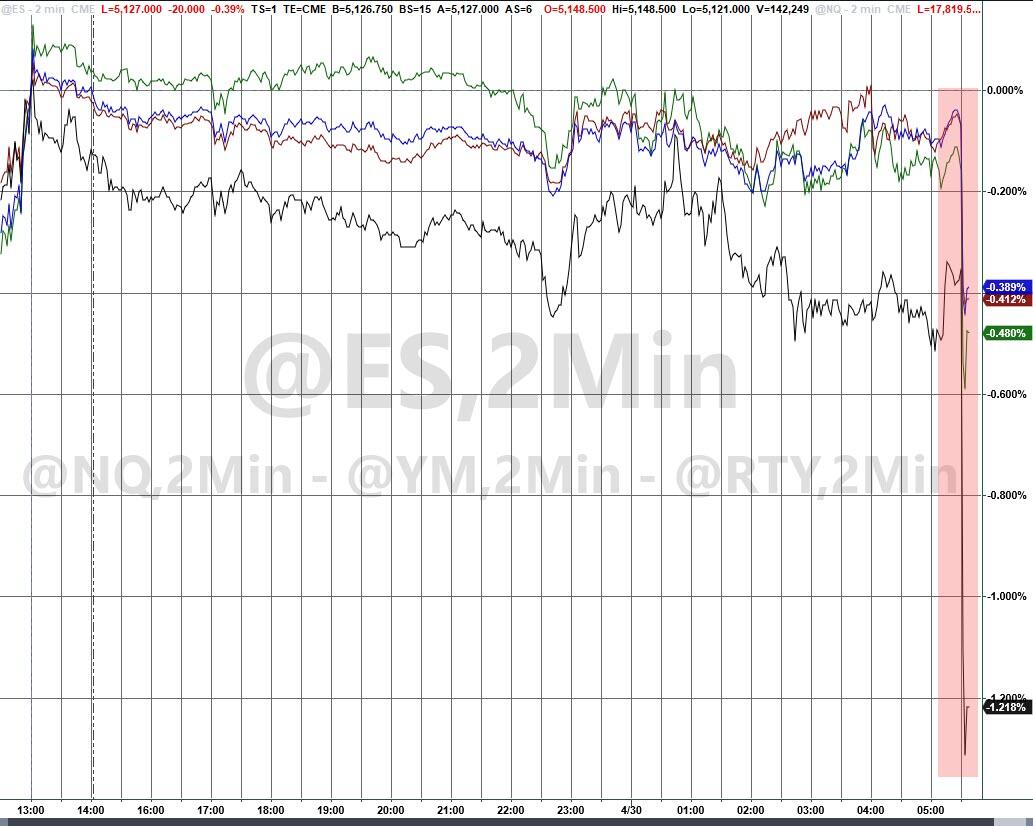
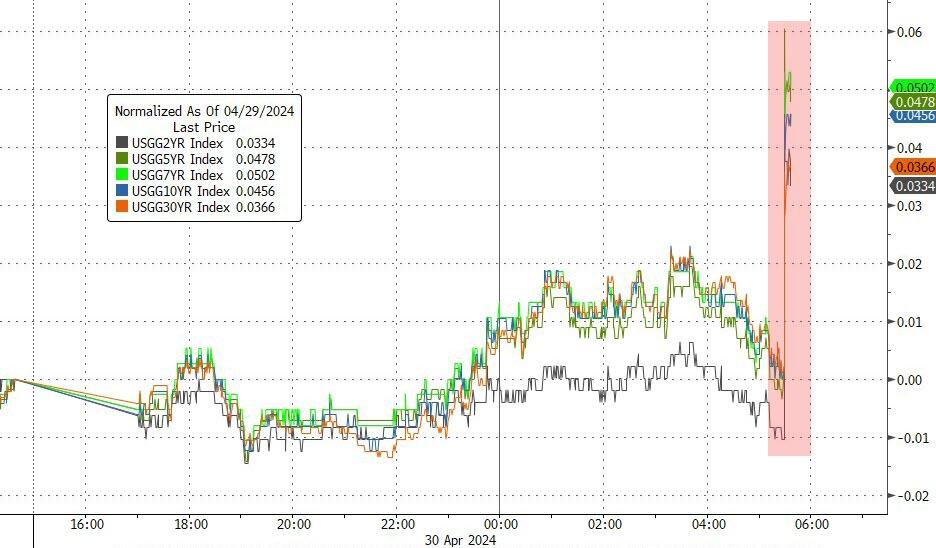
However, both the headline and core PCE Deflator data printed hotter than expected (+2.7% vs +2.6% exp vs +2.5% prior and +2.8% vs +2.7% exp vs +2.8% prior respectively)…
Source: Bloomberg
The silver lining is that this hot PCE print is ‘dovish’ relative to the GDP-based data we saw yesterday, with whisper numbers of +0.4 to +0.5% MoM (vs the +0.3% print).
But still – it’s not good for the doves.
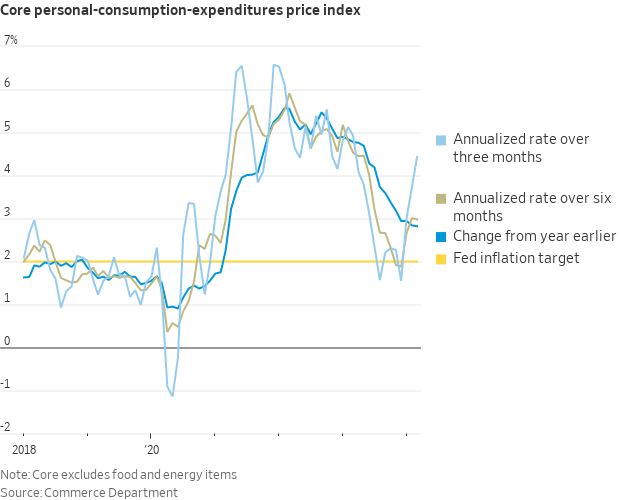
As WSJ Fed Whisperer Nick Timiraos notes, the 3-Month annualized core PCE jumped to 4.4%…
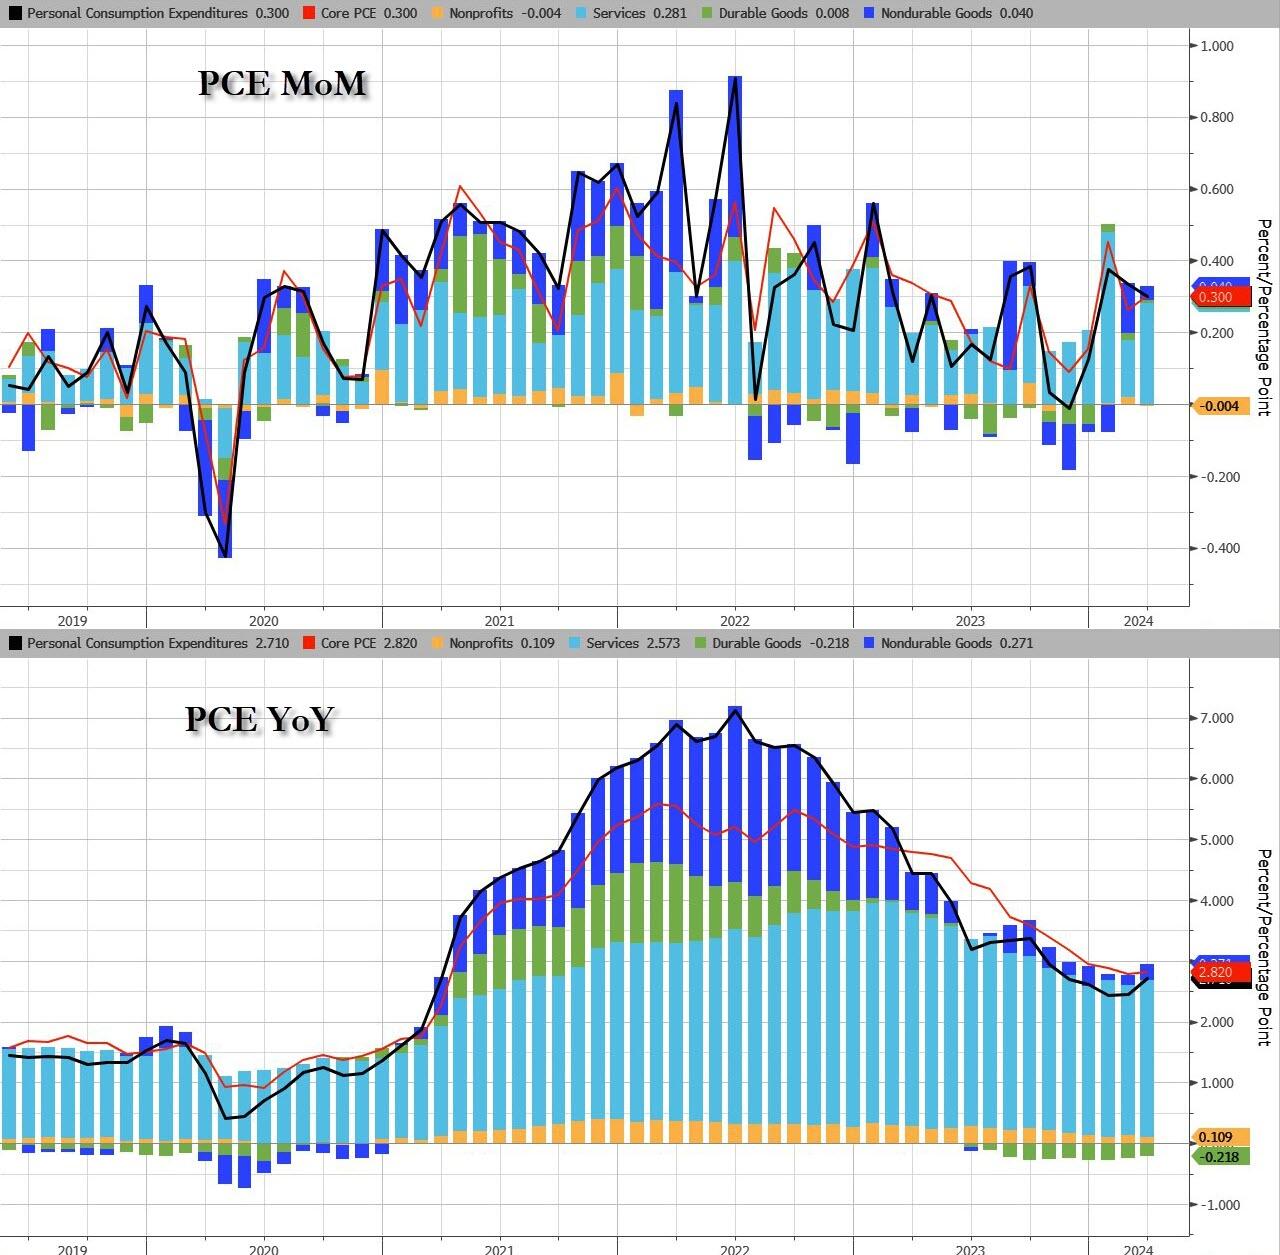
The Service sector led the MoM and YoY acceleration in headline PCE…
Source: Bloomberg
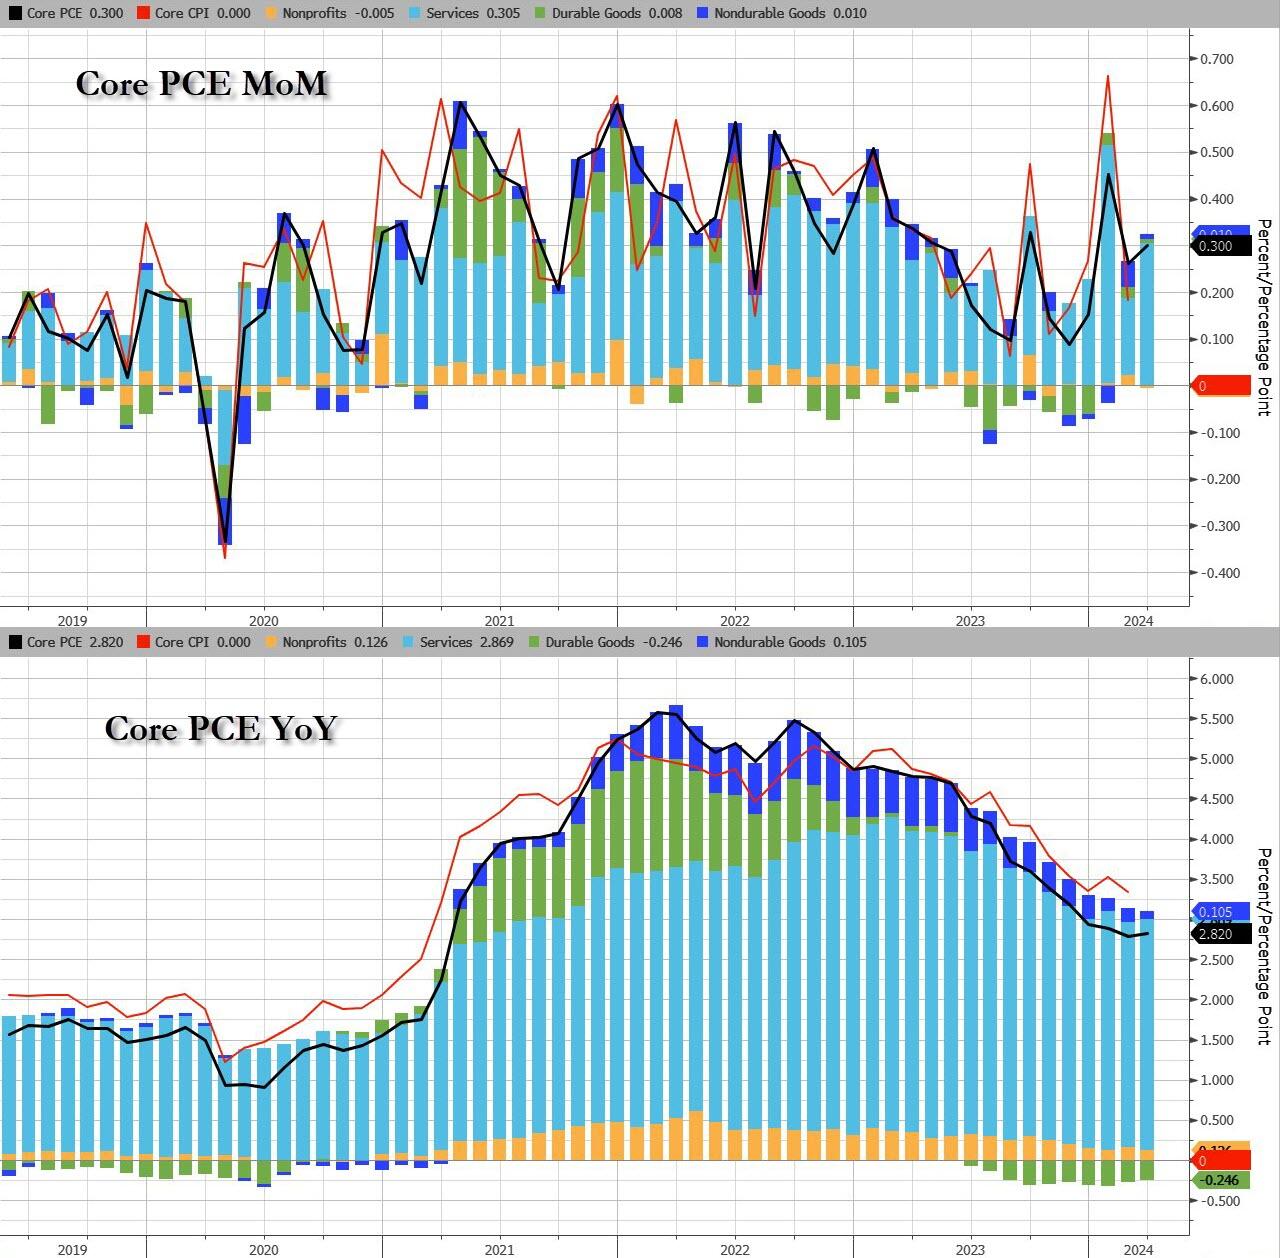
And for Core PCE, it was Services prices too that drove the acceleration…
Source: Bloomberg
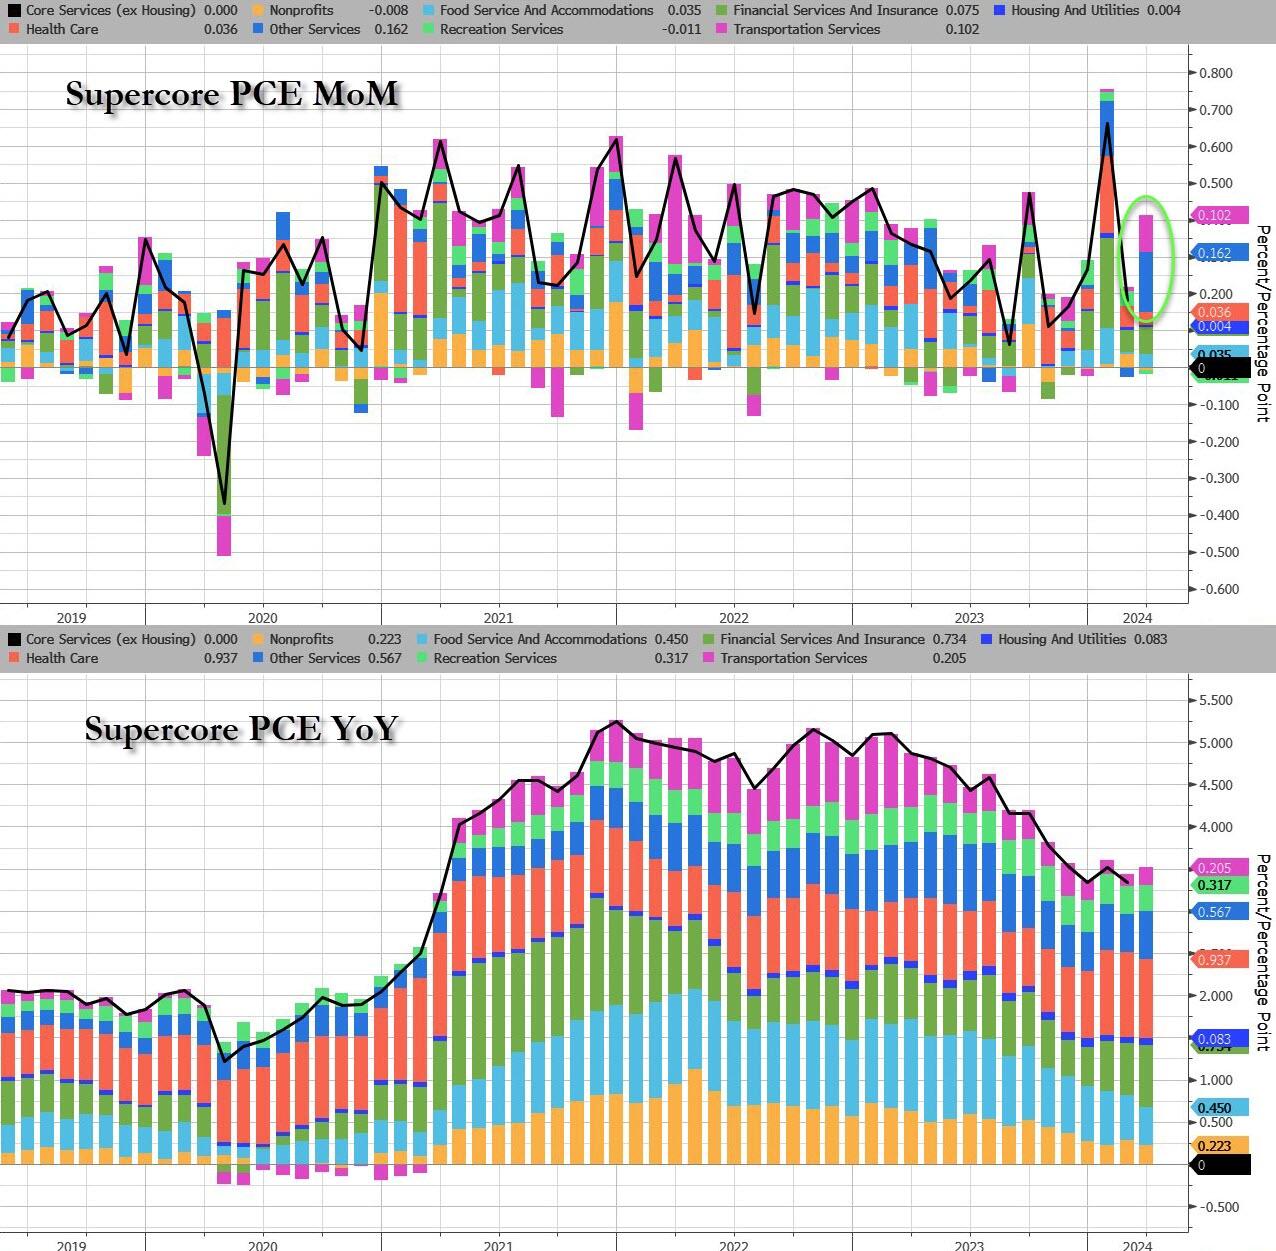
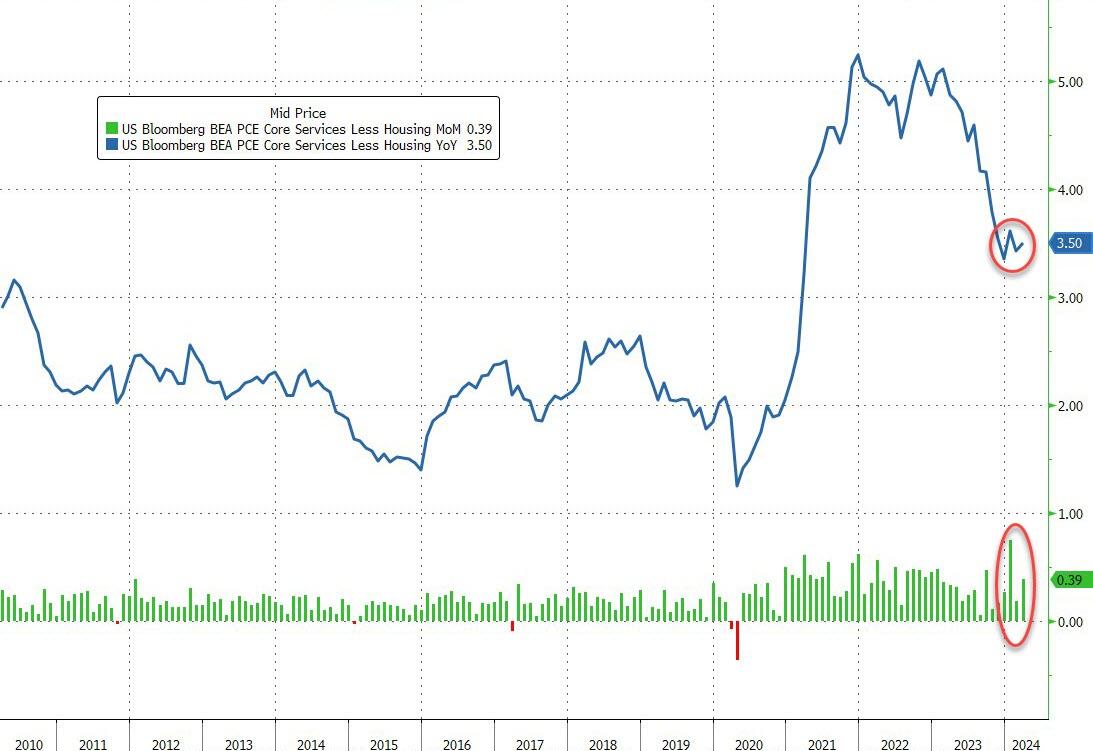
The so-called SuperCore – Services inflation ex-Shelter – rose once again, and was revised higher…
Source: Bloomberg
Stripping it back even further, Transportation Services and ‘Other Services’ were the biggest gainers in SuperCore…
Source: Bloomberg
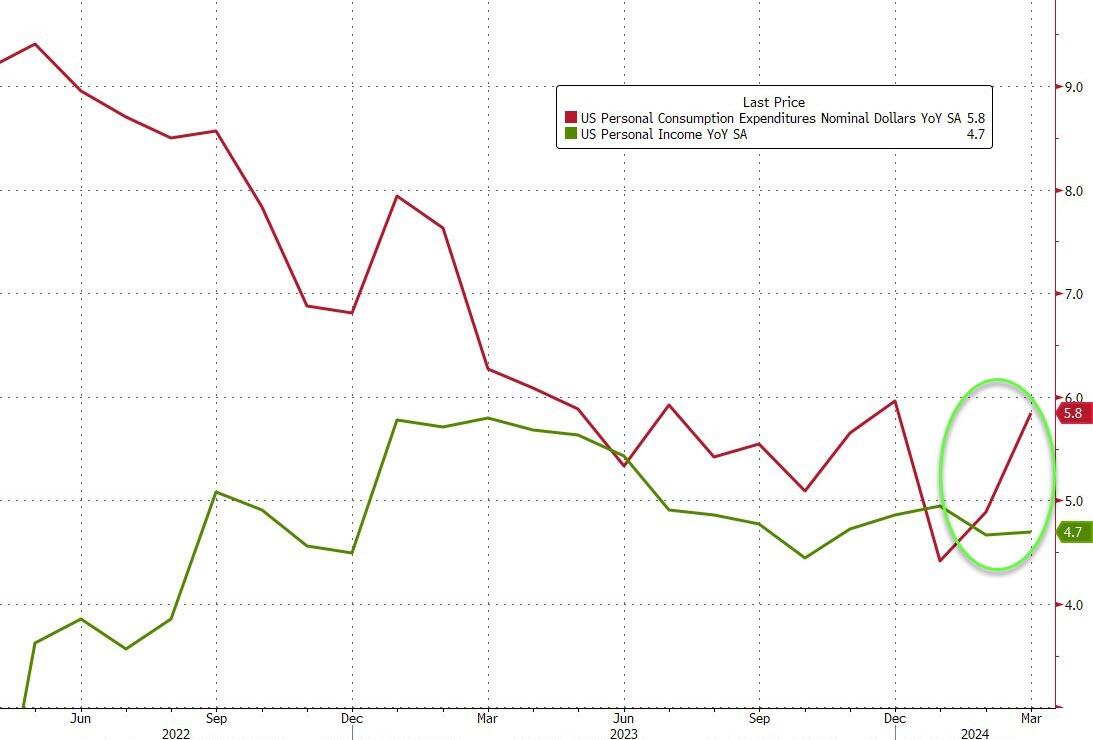
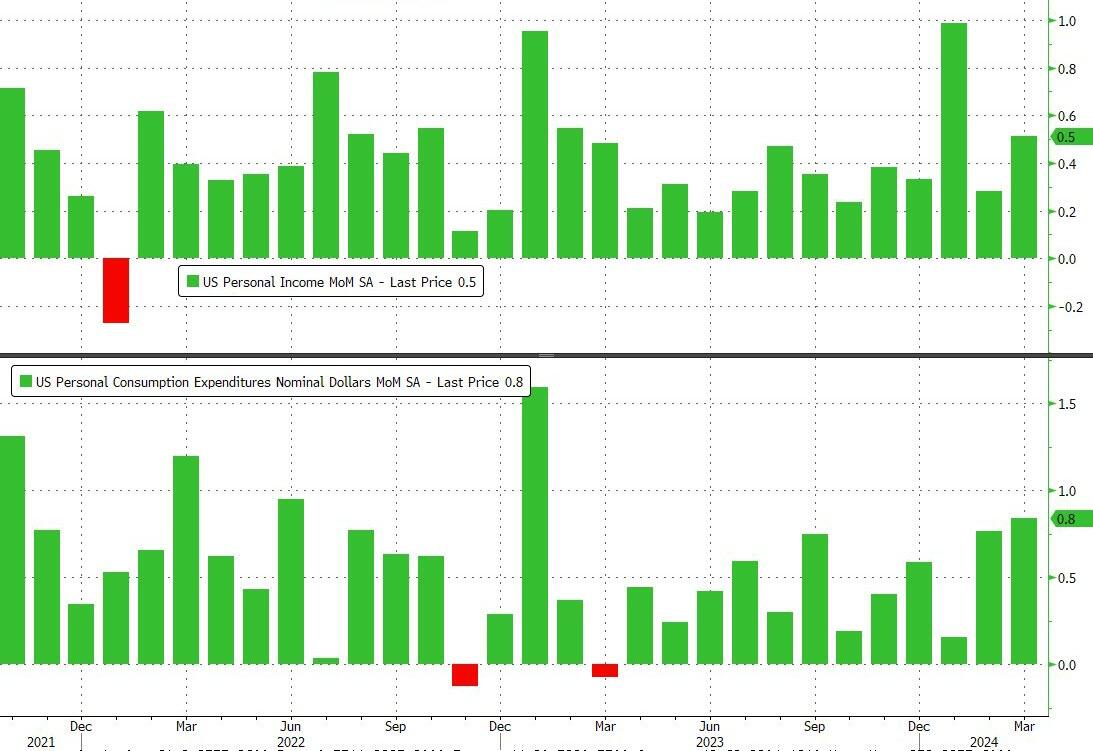
Income and Spending both rose again on a MoM basis with spending outpacing income (again). The 0.8% MoM rise in spending was the highest since Jan 2023…
Source: Bloomberg
Spending is accelerating fast relative to incomes (on a YoY basis) – and remember this is all nominal…
Source: Bloomberg
On the income side, government and private wage growth accelerated:
Govt wages rose to 8.5% YoY, from 8.3%, the highest Dec 22
Private wages rose to 5.5% YoY, from 5.4%, highest since Dec 22 as well
Source: Bloomberg
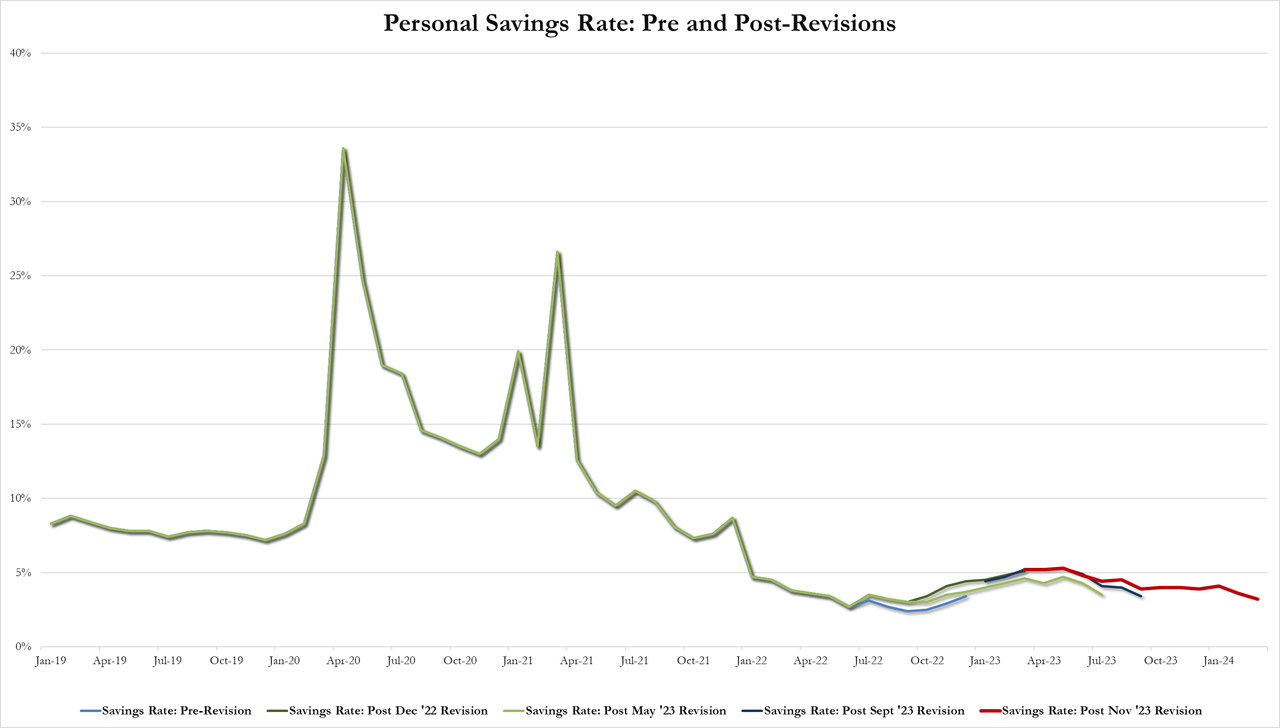
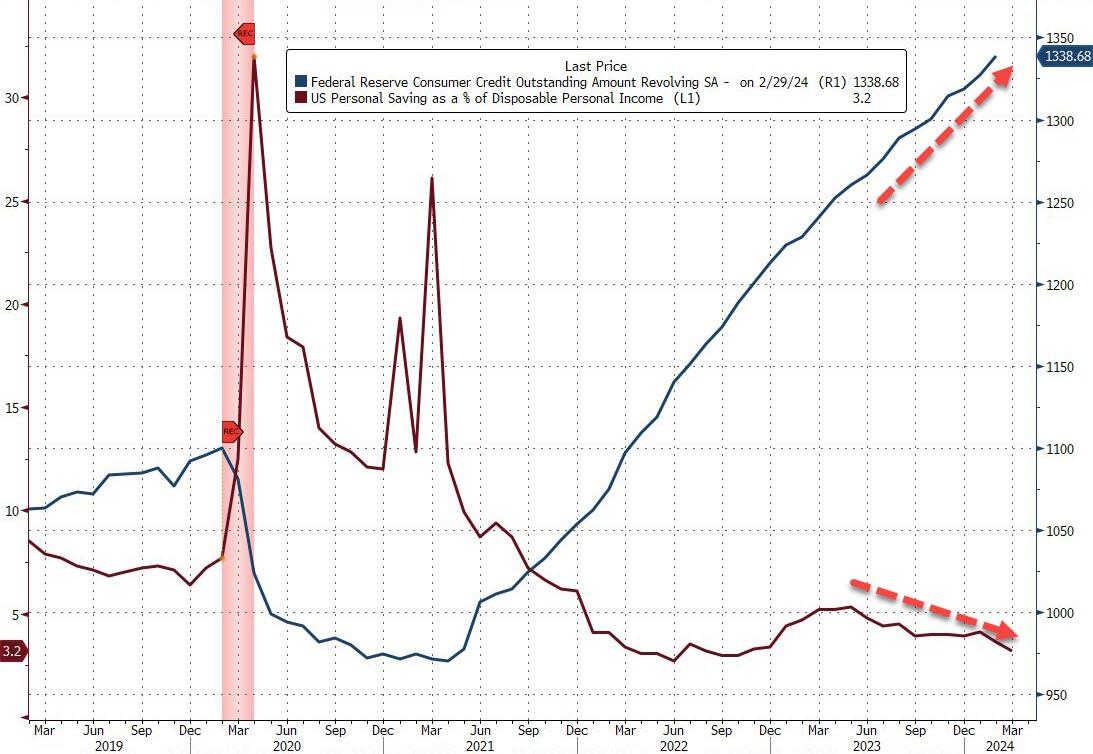
Which meant the personal savings rate plunged to 3.2% from 3.6% – its lowest since Nov 2022…
And the soaring credit card balance explains how people are getting by…
Source: Bloomberg
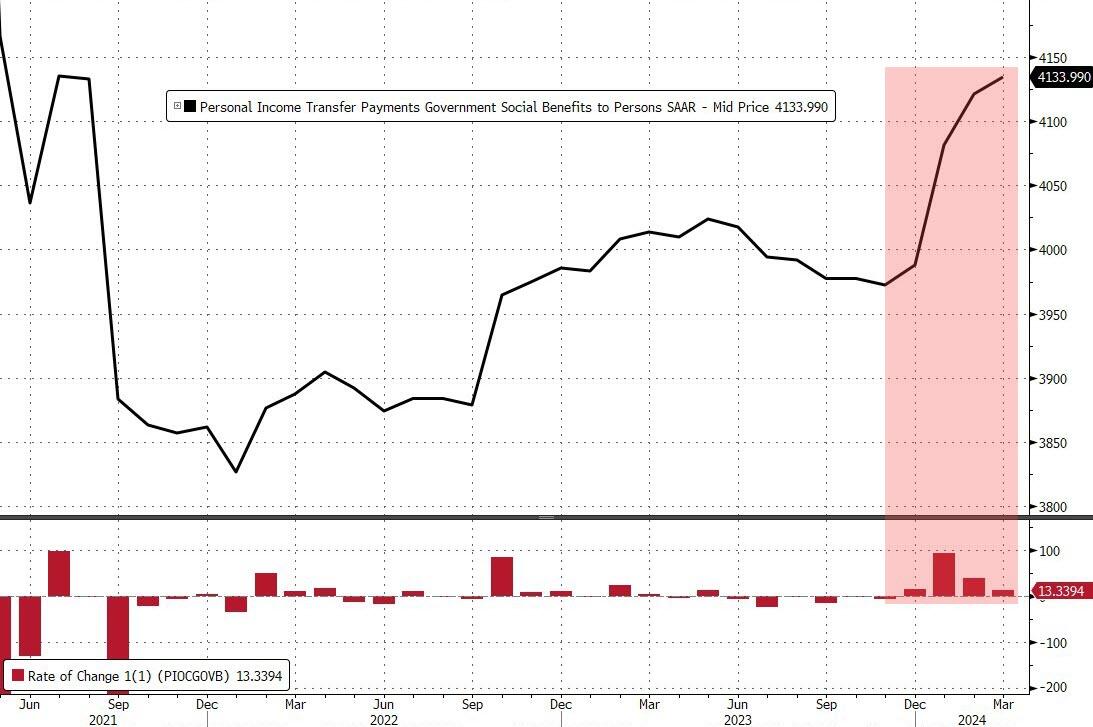
And all this amid the fourth straight month of government handouts…
Source: Bloomberg
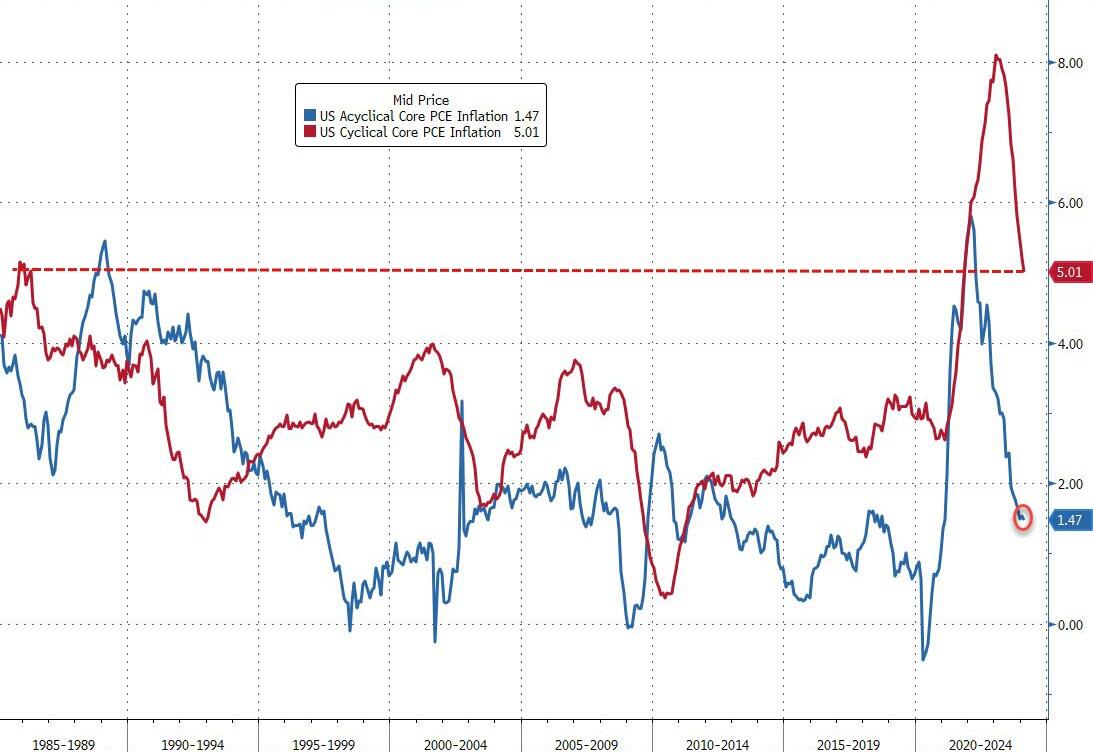
Finally, while the markets are exuberant at the survey-based disinflation, we do note that it’s not all sunshine and unicorns. The vast majority of the reduction in inflation has been ‘cyclical’…
Source: Bloomberg
Acyclical Core PCE inflation remains extremely high, although it has fallen from its highs.
Is The (apolitical) Fed going to be able to cut at all this year like Joe Biden said they would?
The Green Slime! The global movement towards Green Energy (or global Marxist movement) is really The Green Slime! Or maybe it should be renamed “The Red Slime.”
And then we have Hertz dumping its inventory of EVs. A slew of used Teslas have hit the Hertz car sales website after the company announced Thursday it planned to sell off 10,000 more electric vehicles from its fleet than originally planned, bringing the fire sale’s total to 30,000. Perhaps one of the reasons you can get such a good deal on a Tesla at Hertz right now is that the outlook for EV value retention is pretty grim at the moment.
Given the incidents of electric cars catching fire, perhaps saying its a fire sales is a bad choice of words. But what it says is that DESPITE massive incentives to buy EVs, consumer demand stinks. Although Transportation Secretary Pete Buttigieg will claim the market is booming.
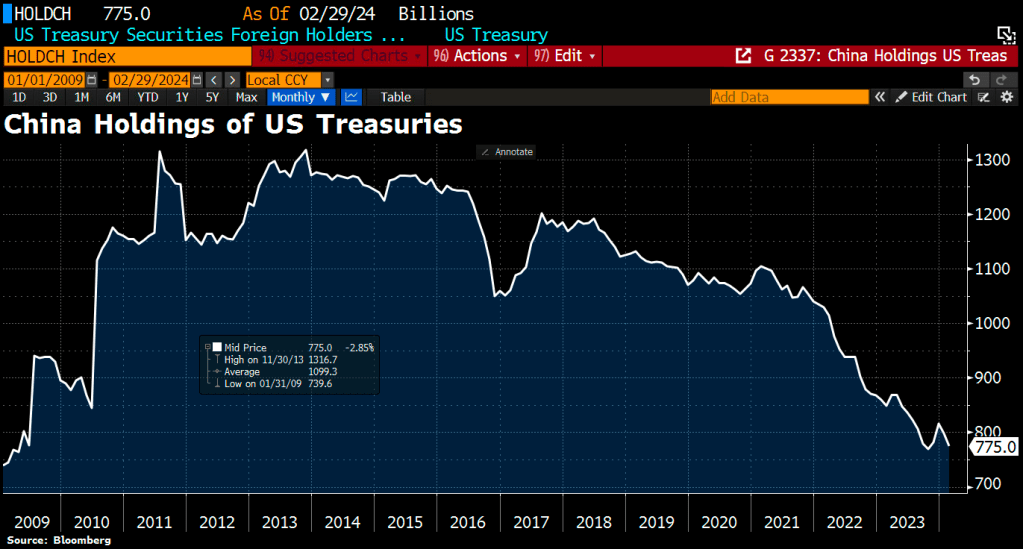
How bad is the trainwreck that is the Biden Regime? China is bailing on US Treasuries.
The Biden Regime is hereafter known as The Green Slime, given their horrible policies. Unfortunately, The Green Slime is here already … and Hertz knows customers don’t want them at least on a temporary basis.
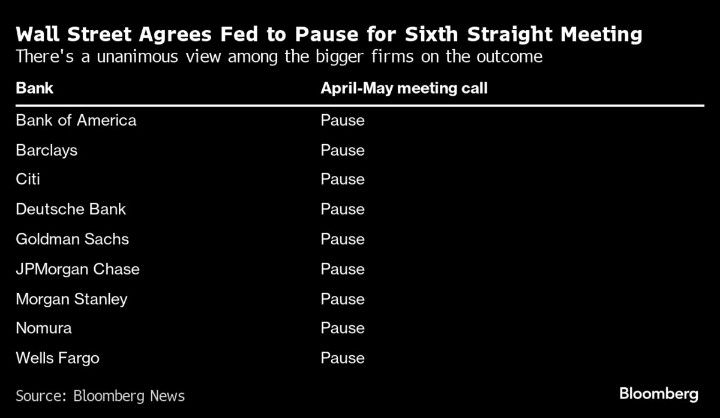
The Federal Reserve is playing the song “Don’t rock the boat” ahead of the Presidential election. Despite the horrible economic news.
1) 4 months of hotter inflation (like today’s stagflationary GDP report)
2) Nearly 1.5 million full-time jobs decline with 1.9 part-time jobs created over a year
3) $2 trillion annual deficits
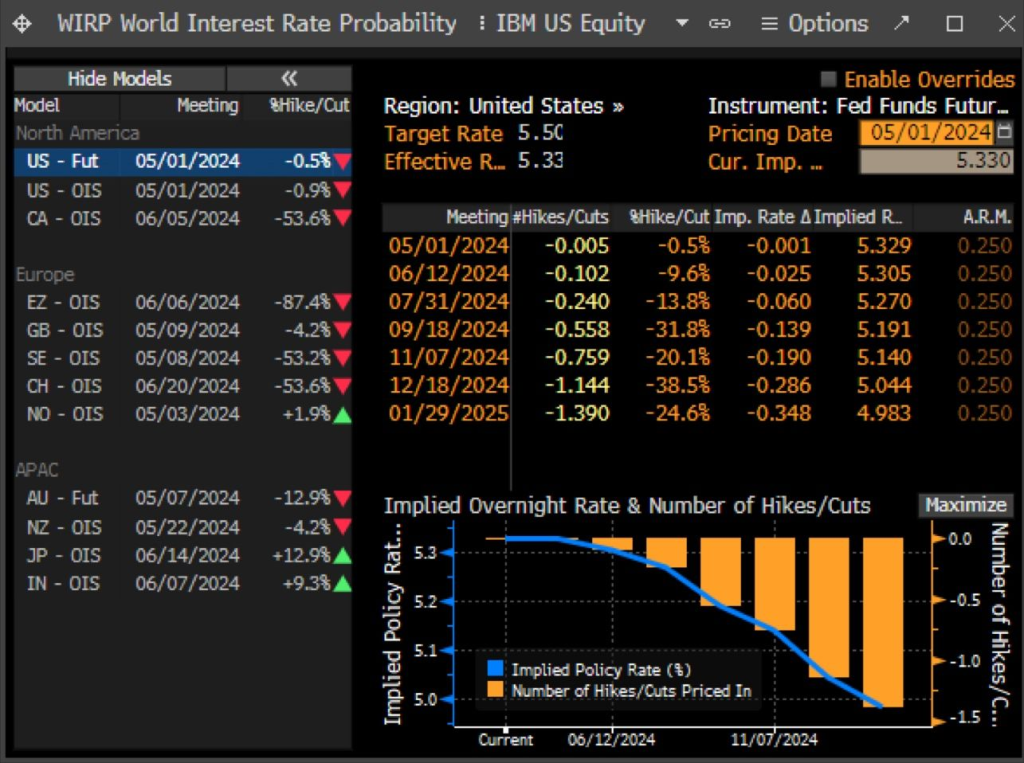
Leading traders to price in 1 rate cut in December 2024. AFTER THE PRESIDENTIAL ELECTION!
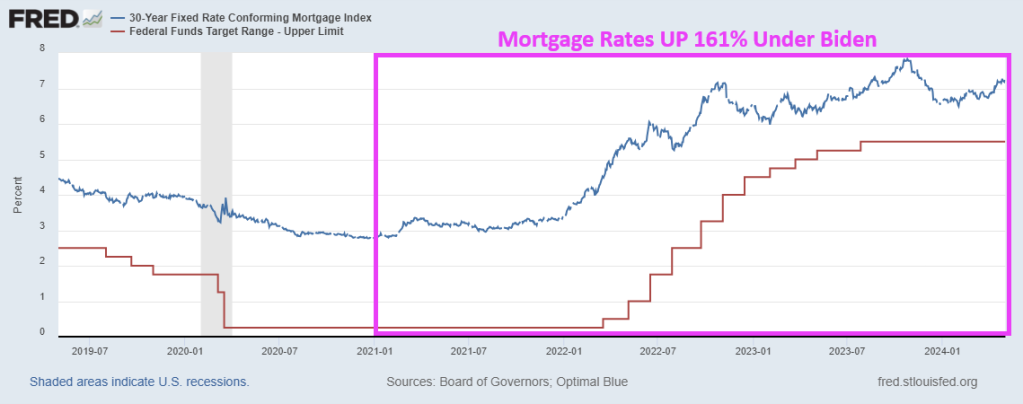
Under Biden, home prices are up 32.5% and conforming 30Y mortgage rates are UP 160%.
One of my colleagues at George Mason University in finance (an economics PhD) constantly quoted Lenin’s famous “You have to break a few eggs to make an omelet.” But why is it always OUR eggs that have to be cracked, never the wealthy elite.
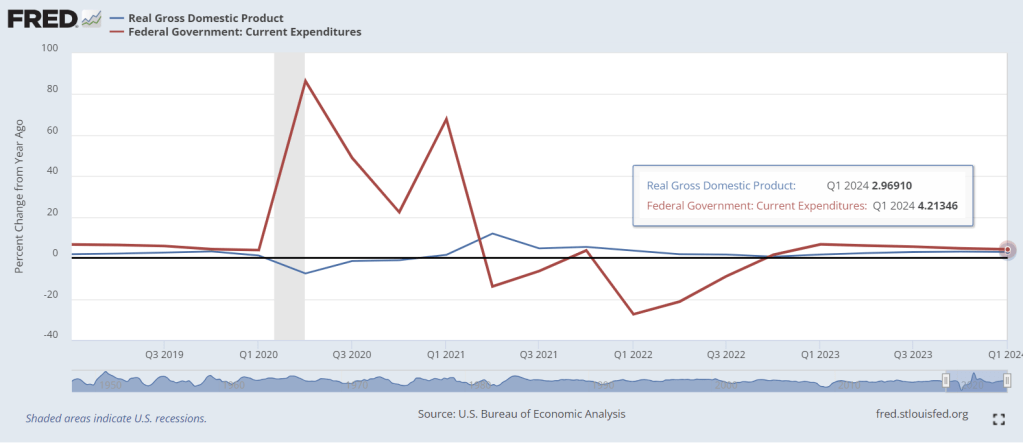
COVID was a gift to Biden. The furious Federal spending of Q2 2020 through Q1 2021 helped keep GDP growth above recession levels.
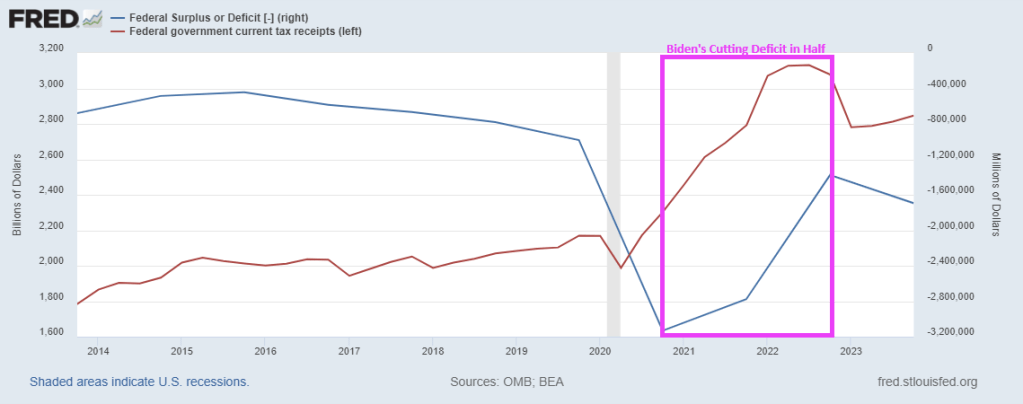
Ignore Biden’s demented rants/lies about cutting the debt in half. Biden has claimed he cut the $34+ trillion national debt by $7 billion, $1.4 trillion, $1.7 billion, $1.7 trillion, and “in half,” depending on the day he rants. He did no such thing. He is confused and is talking about the BUDGET DEFICIT (don’t look to Snopes to fact check “Trucker Joe”, they really only fact check Trump).
Not surprisingly, the Federal deficit spiked with the Covid lockdowns. But when the economy reopened, the budget deficit shrunk because … the economy was open and Federal tax receipts soared. But we are back to rising deficits again.
Today, Q1 GDP numbers were released and it looks great. Real GDP year-over-year was 2.97% while Federal government expenditures YoY were 4.21%. But the US is still processing the tidal wave of COVID-related spending out of Washington DC (red line). The YoY growth in Federal spending was 86.4% in Q2 2020, 48.9% in Q3 2020, 22.4% in Q4 2020, and 67.8% in Q1 2021. Like The Titanic trying to avoid the iceberg, it takes a while for massive Federal spending to work itself through the economic system.
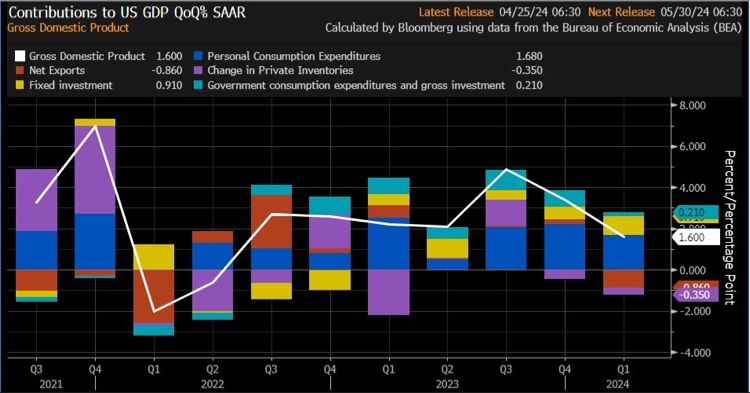
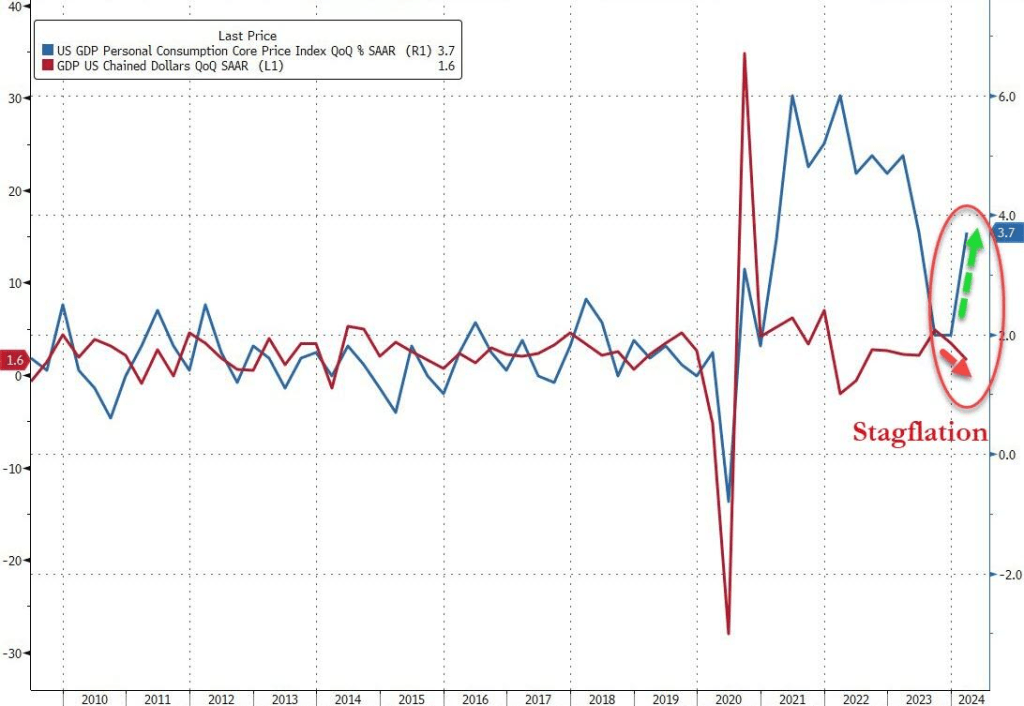
On a QoQ basis, US GDP increased by only 1.60%. Here are the contributions to GDP.
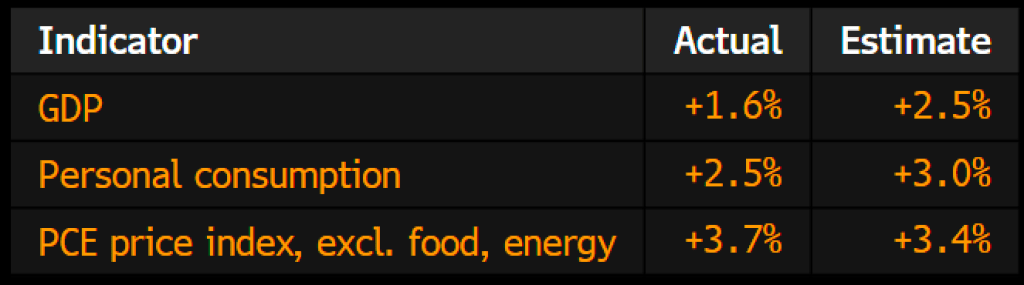
GDP QoQ was up 1.6% while Core PCE Price Index rose 3.7%. Yikes!
Are we entering Stagflation with the worst GDP print in 2 years as prices soar. As COVID stimulus seems to be wearing out.


You must be logged in to post a comment.