There is one song that sums up the mortgage banking industry with proposed tightening of Fed monetary stimulypto: T-R-O-U-B-L-E.
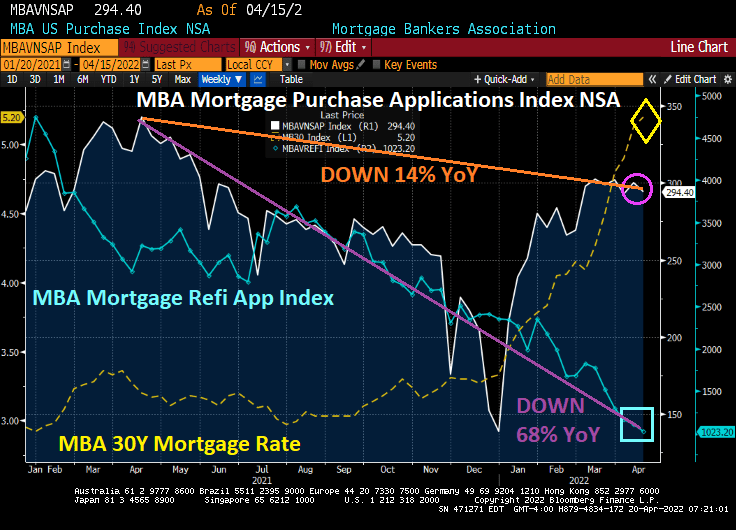
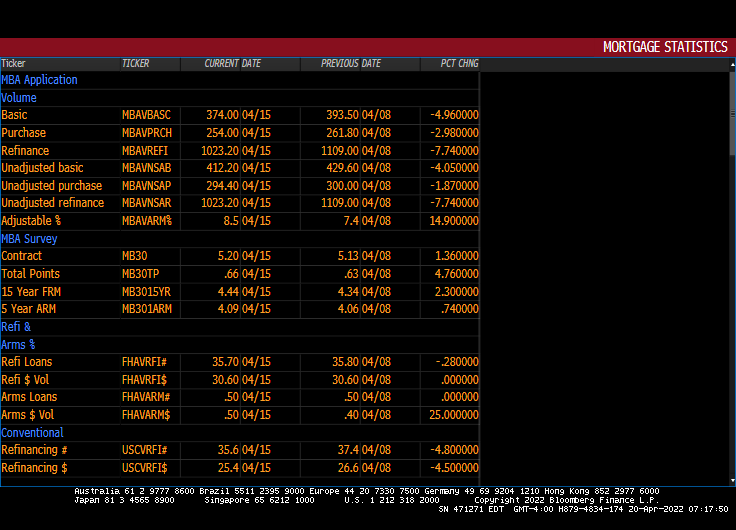
Mortgage applications decreased 5.0 percent from one week earlier, according to data from the Mortgage Bankers Association’s (MBA) Weekly Mortgage Applications Survey for the week ending April 15, 2022.
The Refinance Index decreased 8 percent from the previous week and was 68 percent lower than the same week one year ago. The seasonally adjusted Purchase Index decreased 3 percent from one week earlier. The unadjusted Purchase Index decreased 2 percent compared with the previous week and was 14 percent lower than the same week one year ago.
All together now, mortgage rates are up 76% under Biden.
And yes, The Federal Reserve STILL has its enormous foot on the monetary gas pedal (with hints that they will remove it “soon.”
The number of ARMs increased 14.9% from the previous week.
We have Federal Reserve of St Louis President James “Bully” Bullard saying that The Fed could raise rates by 75 basis points in May, the Japanese Yen to Dollar is crashing as mortgage rates continue to soar.
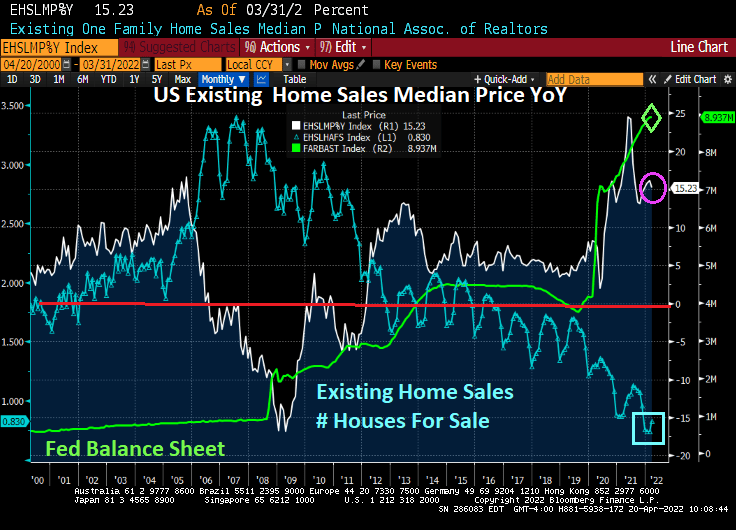
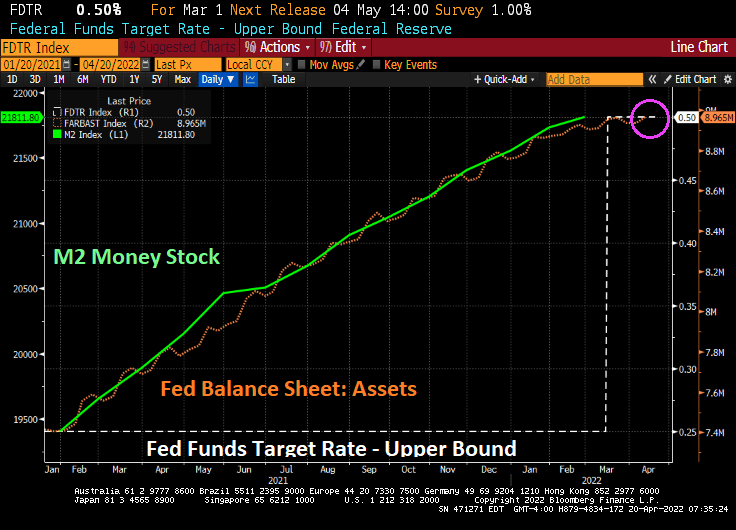
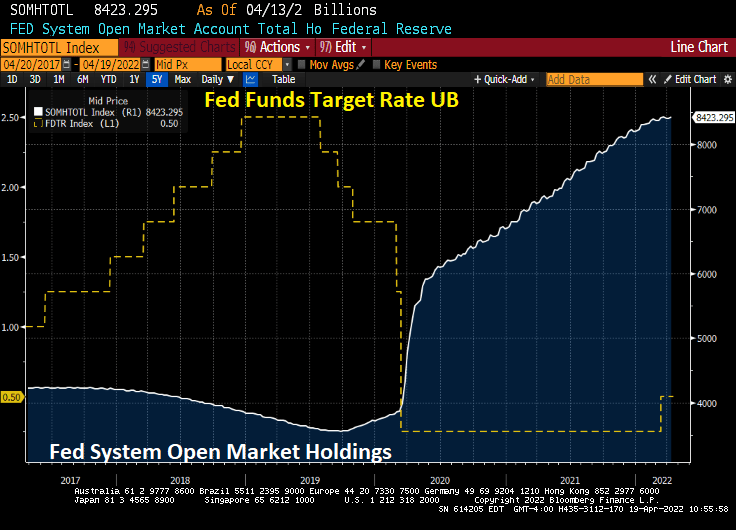
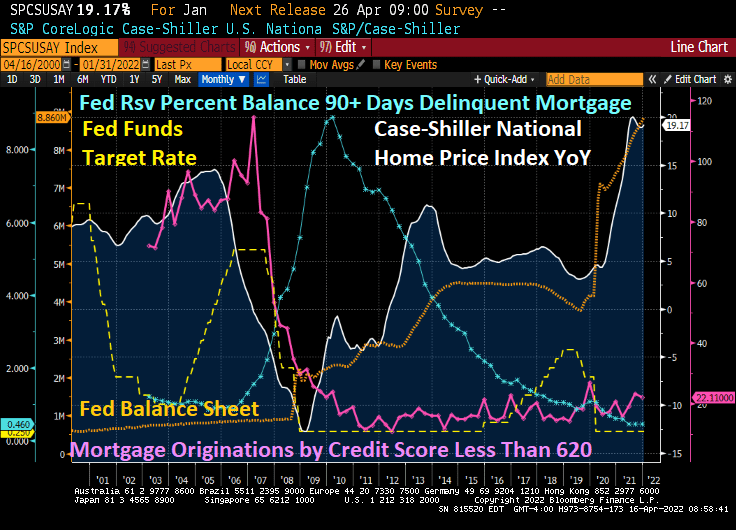
Here is a nice summary of The Fed’s massive balance sheet expansion in reaction to Covid (orange line) and the resulting soaring of home prices. Then The Fed signals that they will remove the “punchbowl” and mortgage rates have boomed. And not in a good day.
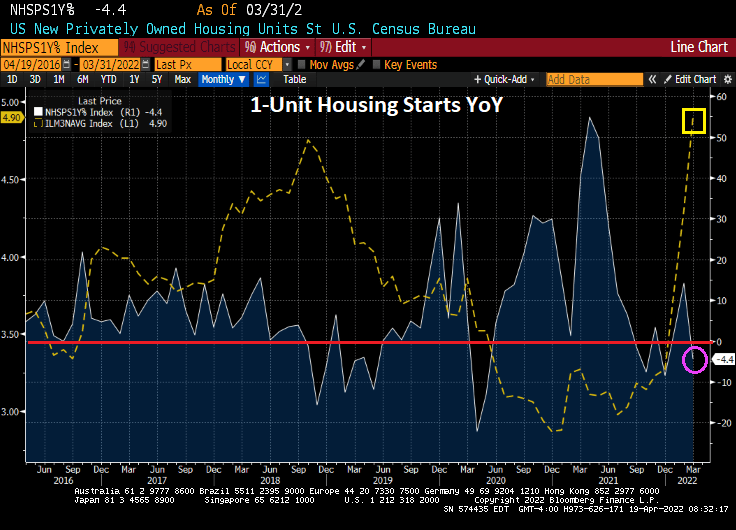
Today we have the US housing starts report. In a nutshell, 1-unit housing starts (single-family detached) declined -4.4% YoY as mortgage rates skyrocket.
5+ unit (aka, apartment stats rose 7.49% MoM in March while 1-unit starts declined by -1.72% MoM. 1-unit permits fell by -4.81% MoM while 5+ units starts rose by 10.89% MoM.
Soaring home prices coupled with soaring mortgage rates equals … apartment living.
Bear in mind that The Fed STILL have massive monetary stimulypto outstanding!!
Fortunately, I refinanced my home mortgage while Trump was still President. When Biden was installed as President, the 30-year mortgage rate was 2.88% (according to Bankrate). It has now risen to 5.25%.
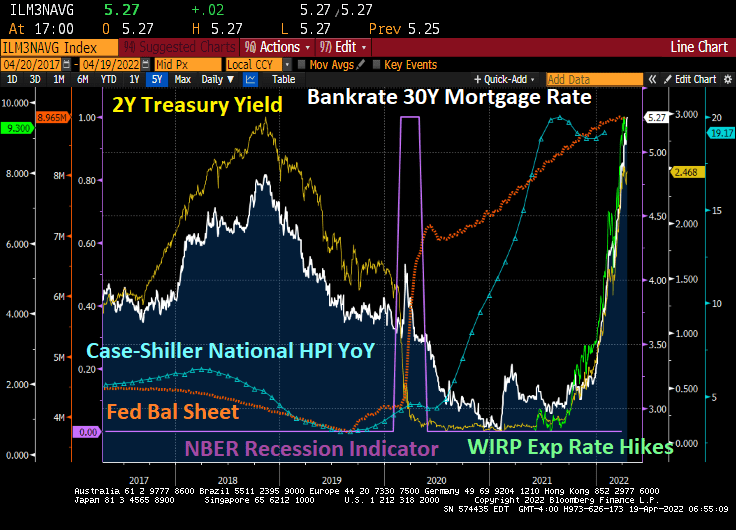
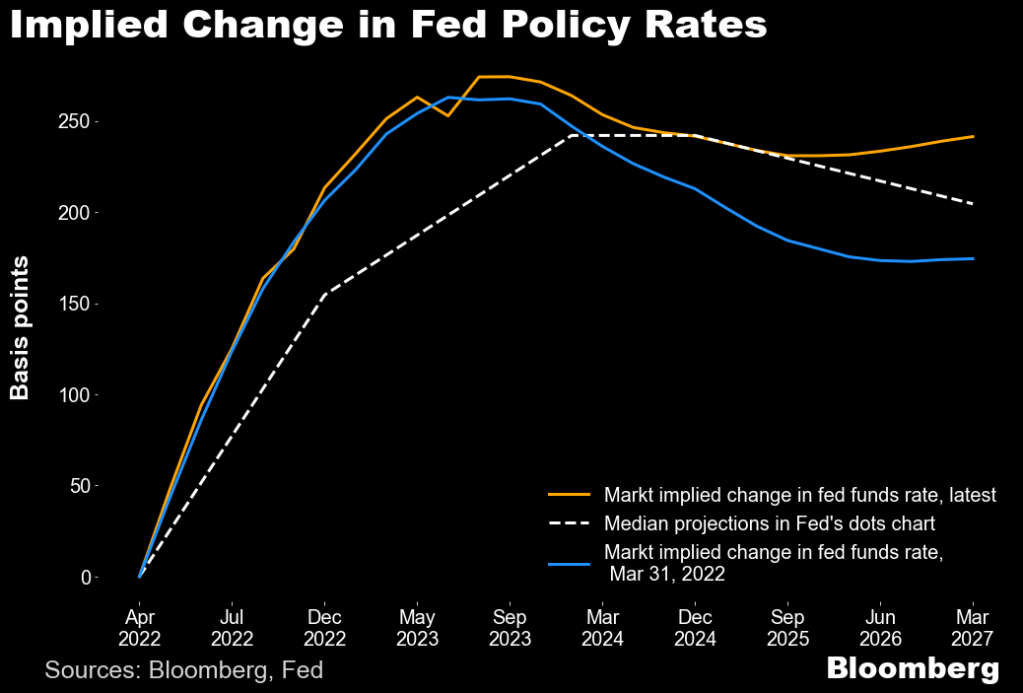
The Federal Reserve is now expected to raise their target rate as much as 50 basis points at the next meeting on May 4, 2022. This chart shows the anticipated rate hikes coming our way, peaking in summer 2023.
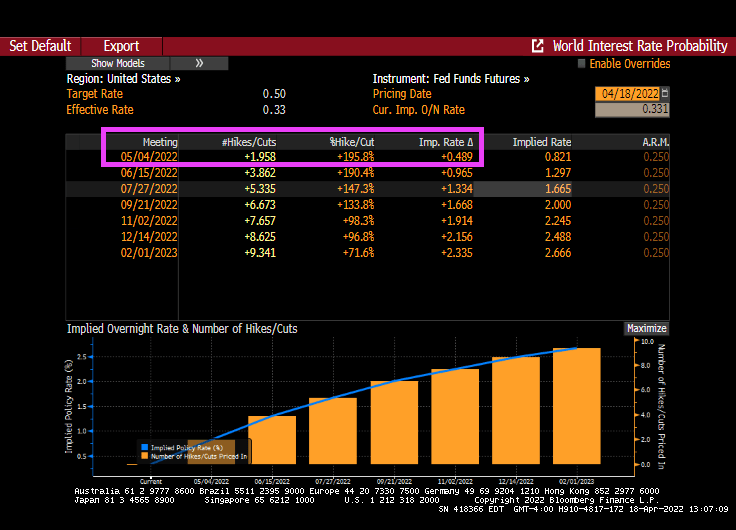
Fed Funds Futures are pricing in a 50 bps rise at the May meeting.
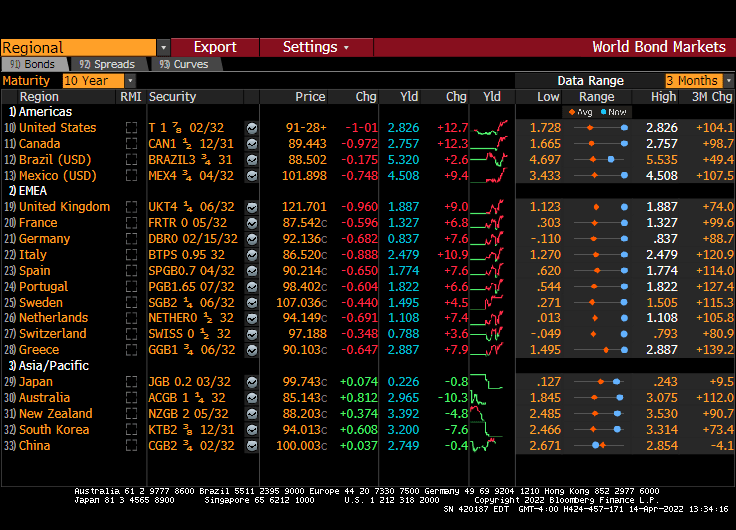
The good news is that the US Treasury actives curve is upward sloping, but is showing fatigue in the forward rates between 7Y and 10Y.
On the hard asset front, precious metals are up over 1% with silver and platinum leading the way.
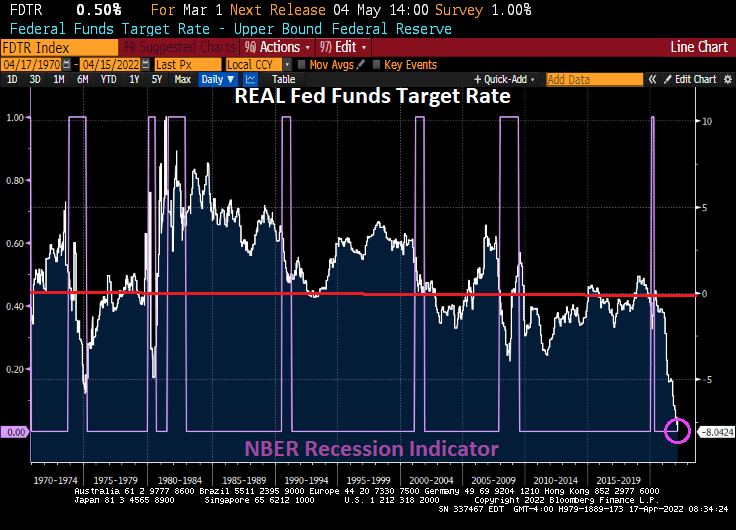
As inflation crushes the middle class and low wage workers, we see that the REAL Fed Funds Target Rate (based on headline inflation) is the lowest in history. Notice that the REAL Fed Funds Target Rate tends to hit its lowest negative reading DURING recessions, although The Fed has had a poor track record since the Dot.com bubble burst and the 2001 recession meaning that the REAL Fed Funds Target rate has been in negative territory (that is, the rate of inflation has exceeded The Fed Funds Target Rate for much of the post-2000 era).
The “good” news? Inflation caused by The Fed’s negative interest rate policy (NIRP?) has actually led to REAL home price growth to slow 11.6855% YoY, lower than the peak of the 2005-2007 house price bubble.
With The Fed’s OVERSTIMULATION of markets with historically low REAL Fed Funds Target Rate, we can see that the US unemployment rate is overheated (that is, below the Congressional Budget Office (CBO) Short-term Natural Rate of Unemployment. Yes, it appears that Slow Walking Fed Chair Jay Powell should be raising The Fed’s target rate AND removing (at least) the Covid monetary stimulus.
Inflation Joe is a career politician, so it is not surprising that he is trying to blame Russia for the horrid inflation in the US. However, inflation grew from 1.4% when Biden took office to 7.9% when Russia invaded Ukraine. The latest inflation report was 8.5%, so Russia is only partly to blame for rising prices since February 24, 2022. The rest is due to Inflation Joe, Slow Walking Jay and Congress.
Again, Congress helped drive prices through the roof by massive Federal spending (aka, Covid stimulus “relief”). Hence, the Four Horsemen of the Inflation Apocalypse is appropriate. And now Biden is once again pitching massive government spending (Build Inflation Back Better?).
The book and movie “The Big Short” revolved around the 2005-2007 housing bubble driven by lending to borrowers with subprime credit (and little or no underwriting). As we know, Bear Stearns, Lehman Brothers and other investment banks too large positions in subprime asset-backed securities (SABS) that became highly toxic once the demand for high-yield subprime ABS dried up. The decline in US home prices coupled with soaring 90-day mortgage delinquencies led to the failure of Bear Stearns and Lehman Brothers along with Fannie Mae and Freddie Mac being put into conservatorship by their regulator.
Fast forward to today. Mortgage originations by credit scores of 620 or less have shriveled while home price growth YoY is even higher than the subprime mortgage crisis of 2005-2007. So, is the US facing another “Big Short” scenario? Yes and no.
The answer is no in that lenders have tightened their credit box sufficiently so that investment banks are no longer buying large quantities of subprime credit paper. The answer is yes if we consider that the current housing bubble is fueled by extraordinary monetary stimulus due to Covid (as well as rampant Federal government stimulus spending).
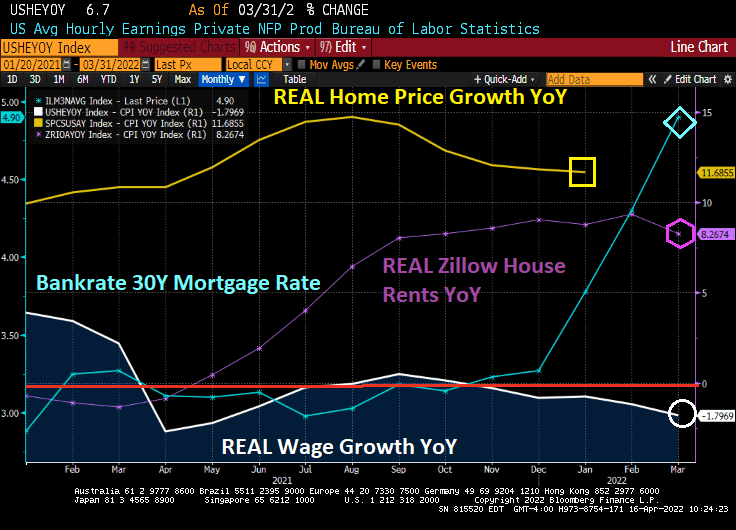
Following the Federal Reserve of Dallas’ lead, here is a chart of REAL home price growth YoY against REAL average hourly earnings YoY. I added REAL Zillow house rents YoY as well.
Look at the affordability gap during the Subprime Bubble of 2004-2006 and then the Fed Bubble of 2020 to today. Both bubbles show a disconnect between REAL home prices and REAL wages. REAL Zillow home rents are not as high as REAL home price growth, but still how a huge gap in rent affordability.
So, what can upset the apple cart? How about Jay and The Gang jacking up mortgage rates making home affordability even worse (unless it slows home price growth).
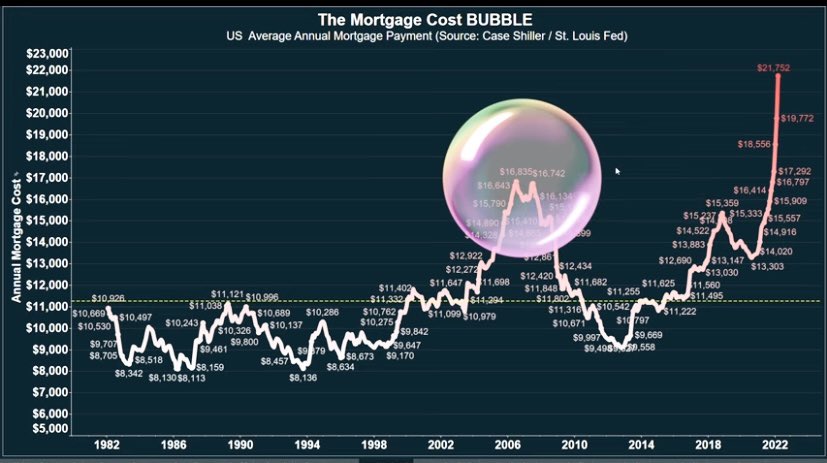
Thanks to The Fed’s propose quantitative tightening, mortgage rates are soaring and mortgage costs along with them. Mortgage costs, thanks to The Fed driving up housing prices AND mortgage rates, are substantially higher than during the subprime mortgage housing bubble.
The Fed’s whipsaw approach helped crash home prices during the subprime mortgage crisis by dropping rates too fast at first (helping to ignite a housing bubble) then raising rates too fast (helping to crash housing prices).
WASHINGTON (AP) — Long-term U.S. mortgage rates continued to climb this week as the key 30-year loan rate reached 5% for the first time in more than a decade amid persistent high inflation.
The average 5% rate on the 30-year mortgage was up from 4.72% last week, mortgage buyer Freddie Mac reported Thursday. The average rates in recent months have been showing the fastest pace of increases since 1994. By contrast, a year ago the 30-year rate stood at 3.04%.
The average rate on 15-year, fixed-rate mortgages, popular among those refinancing their homes, jumped to 4.17% from 3.91% last week.
Yet The Federal Reserve’s balance sheet keeps on growing.
The good news is that US industrial production rose 0.9% in March. The bad news? US capacity utilization rose to 78.3% indicating that the labor market is overheating.
Notice that prior to Covid, The Fed began rising raising its target rate as capacity utilization was increasing towards 80%. But once The Fed Funds Target rate (upper bound) hit 2.50%, capacity utilization started to cool off. Then Covid stuck.
Since Covid struck and The Fed massively expanded its balance sheet, capacity utilization has increased. But this time around, The Fed has been sloth-like in its removal of monetary stimulus.
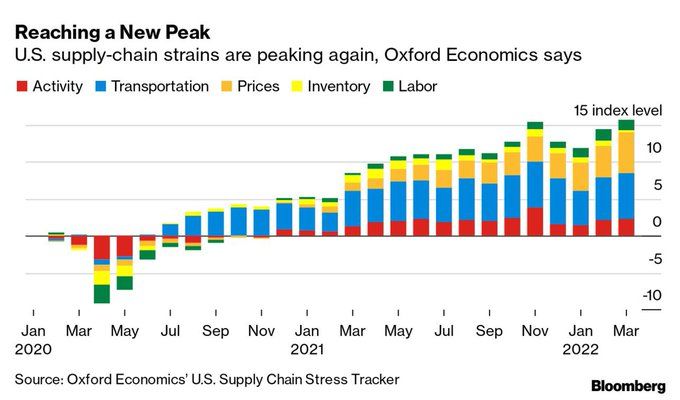
Of course, The Fed has been slow to cool inflation which is the highest in 40 years. And supply-chain strains are peaking again (isn’t Mayor Pete in charge of infrastructure?) This is helping to drive prices up.
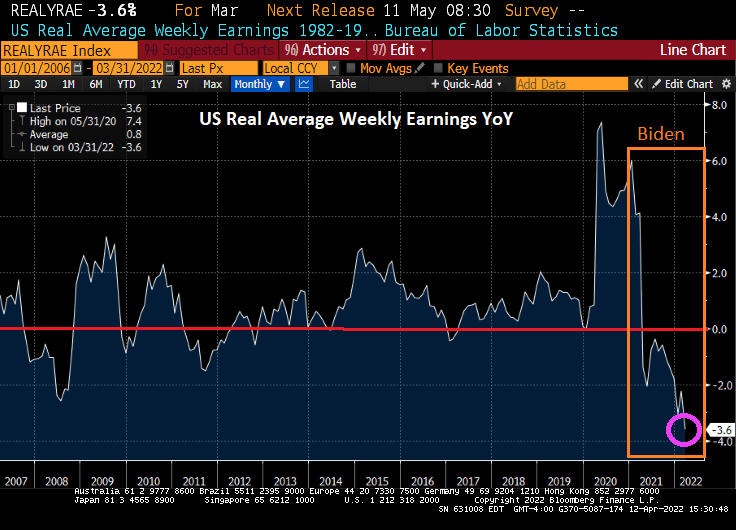
And don’t forget that REAL average weekly earnings YoY are falling.
As we are all aware, The Federal Reserve launched its monetary “stimulypto” in March 2020 to combat the Covid virus. Coupled with the surge in Federal stimulus, we have seen home prices rise over 20% since February 2020.
Specifically, New York City home prices are up 26.3% since February 2020, Chicago home prices are up 21.7%, and Los Angeles home prices are up 32.5%. Fed monetary stimulypto is up 113% since February 2020.
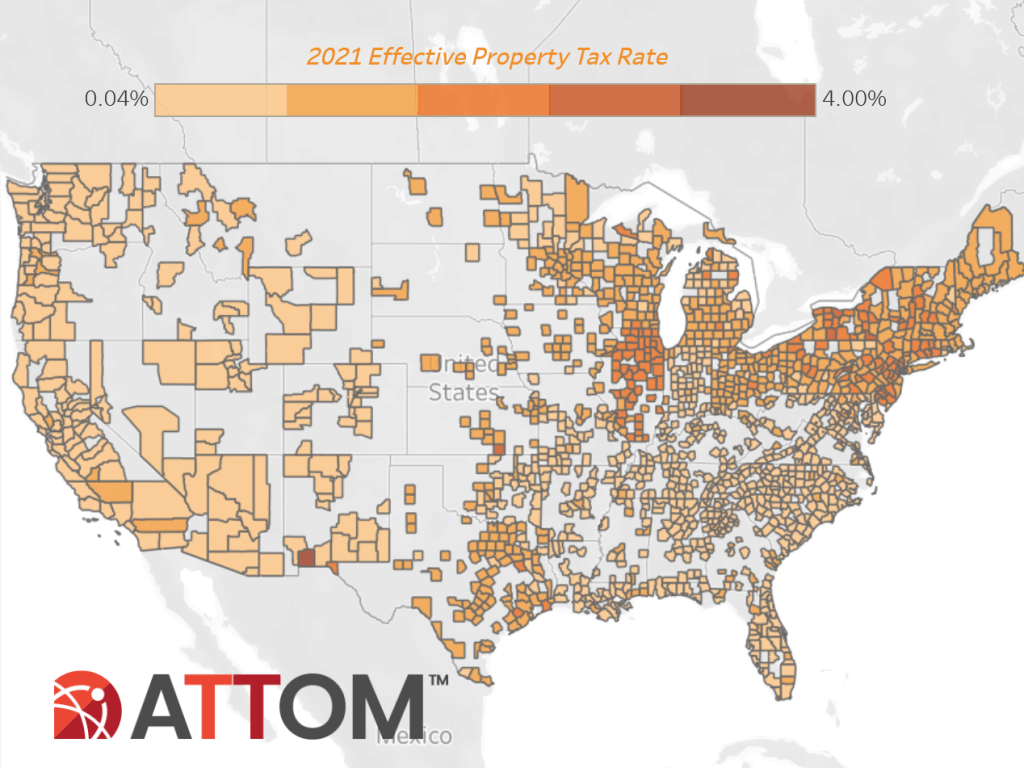
Of course, this has resulted in soaring PROPERTY TAXES as well. According to Attom Data Services, “Among 1,481 U.S. counties with at least 10,000 single-family homes in 2021, 16 had an average single-family-home tax of more than $10,000, including 12 in the New York City metro area. The top five were Kings County (Brooklyn), NY ($13,734); Marin County, CA (outside San Francisco) ($13,719); Westchester County, NY ($13,674); Essex County, NJ ($13,116) and Nassau County, NY ($13,095).”
Of course, not all metro areas raised their property taxes. Major markets with the largest decreases in average property taxes included Pittsburgh, PA (down 35.1 percent); New Orleans, LA (down 20.2 percent); Houston, TX (down 18.7 percent); Dallas, TX (down 12.2 percent) and Austin, TX (down 7.7 percent).
States with the highest effective property tax rates in 2021 were Illinois (1.86 percent), New Jersey (1.73 percent), Connecticut (1.67 percent), Vermont (1.55 percent) and Pennsylvania (1.37 percent).
Even if The Federal Reserve removes its massive monetary stimulypto (MMS), property taxes will remain elevated unless cities reduces their property tax rates. But Democrat-controlled cities tend to be addicted to spending much like The Federal government.
Today, the US Treasury 10-year yield exploded upwards by over 12 basis points. With it, the 30-year mortgage yield is above 5%. And MBA Mortgage Purchase Applications are actually increasing.


You must be logged in to post a comment.