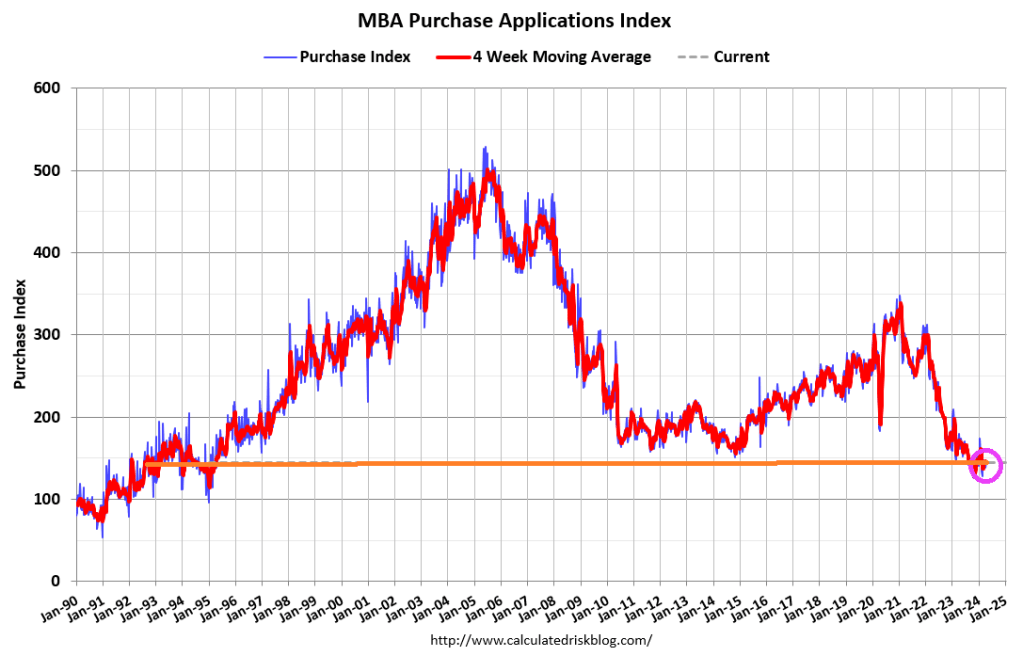
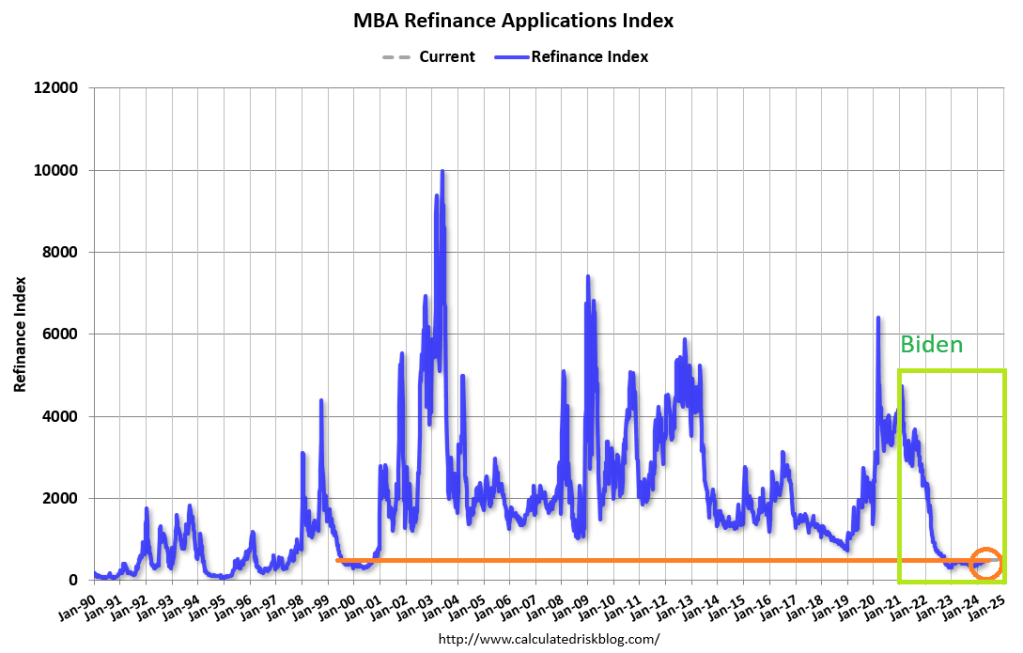
Mortgage applications decreased 2.7 percent from one week earlier, according to data from the Mortgage Bankers Association’s (MBA) Weekly Mortgage Applications Survey for the week ending April 19, 2024.
The Market Composite Index, a measure of mortgage loan application volume, decreased 2.7 percent on a seasonally adjusted basis from one week earlier. On an unadjusted basis, the Index decreased 2 percent compared with the previous week. The seasonally adjusted Purchase Index decreased 1 percent from one week earlier. The unadjusted Purchase Index increased 0.2 percent compared with the previous week and was15 percent lower than the same week one year ago.
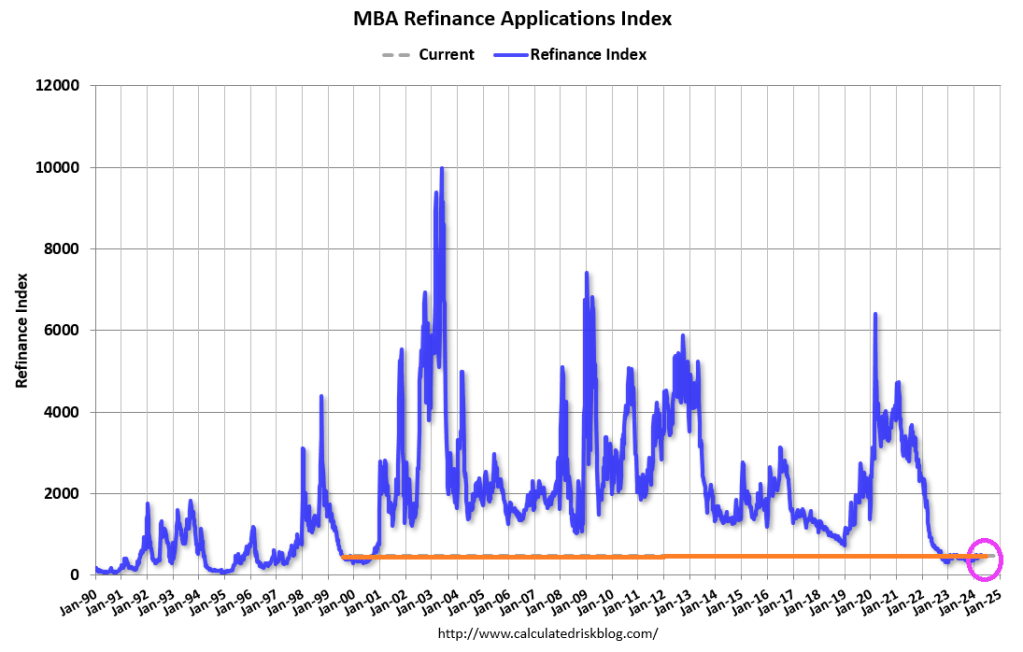
The Refinance Index decreased 6 percent from the previous week and was 3 percent higher than the same week one year ago.
The average contract interest rate for 30-year fixed-rate mortgages with conforming loan balances ($766,550 or less) increased to 7.24 percent from 7.13 percent, with points increasing to 0.66 from 0.65 (including the origination fee) for 80 percent loan-to-value ratio (LTV) loans.
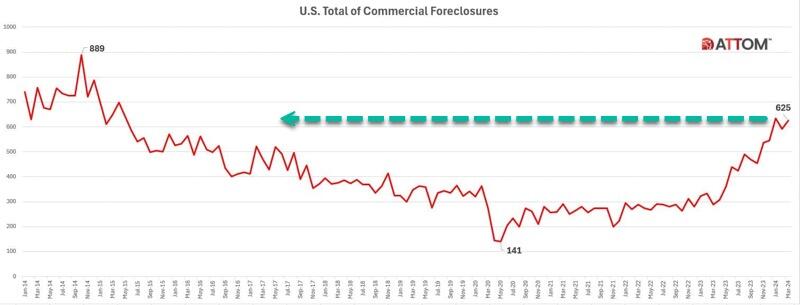
The latest report from real estate data provider ATTOM shows CRE foreclosures topped 625 in March, up 6% from February and 117% from the same period last year.
ATTOM has been tracking commercial foreclosures since 2014. The number of foreclosures is approaching the peak of 889 in October 2014.
“California began experiencing a notable rise in commercial foreclosures in November 2023, surpassing 100 cases and continuing to escalate thereafter,” the report said.
New York, Florida, Texas, and New Jersey also showed increases in CRE foreclosures last month.
Regional banks provide a bulk of the financing for the space. The ongoing mess in the lending space due to tighter conditions adds pressure to the CRE downturn. Banks are expected to set aside more money to cover potential CRE losses.
Last month, Federal Reserve Chair Jerome Powell testified on Capitol Hill, “We have identified the banks that have high commercial real estate concentrations, particularly office and retail and other ones that have been affected a lot,” adding, “This is a problem that we’ll be working on for years more, I’m sure. There will be bank failures, but not the big banks.”
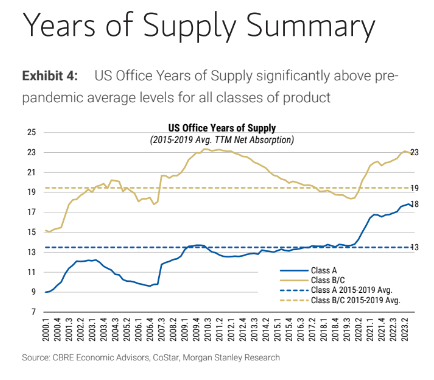
Data from a recent Treasury Department’s Financial Stability Oversight Council (FSOC) warned office vacancy rates have climbed sharply in recent years, reaching a record of 13.1% at the end of 2023.
CoStar analyst Phil Mobley recently noted the “reset in office demand has rocked US markets.”
Morgan Stanley warned earlier this year that office prices could plunge 30% due to sliding demand.
For those wondering why the excess supply of office towers can’t be converted into affordable housing, Goldman also noted that prices must drop 50% for housing conversions to make sense.
Powell has a rolling crisis on his hands. And the goal is to save the fireworks for after the election.
Housing is becoming an exclusively upper-class privilege in a growing number of cities.
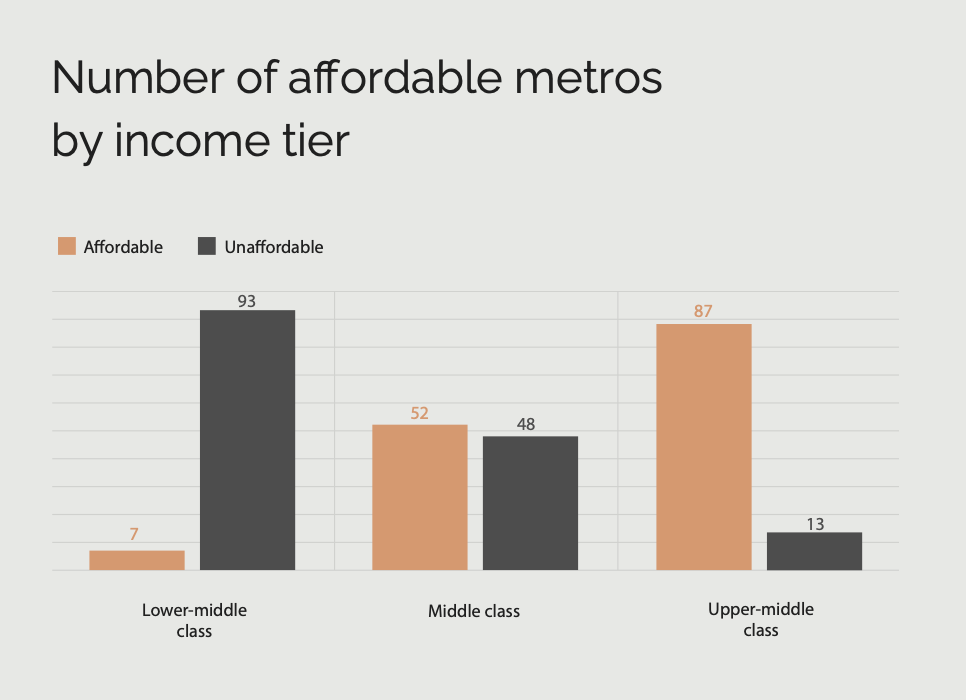
According to a new study by Creditnews Research, in 2024, middle-class households could afford to buy an average home in just 52 of the country’s 100 largest metros.
Just five years earlier, they could afford a home in 91 of the top 100 metros.
The situation is far worse for lower middle-class households, as they can only afford a home in seven of the largest 100 metros.
In total, 41 out of the 100 metros require a gross annual income of $100,000 or more to qualify for an average home. In 13 metros, an average income of more than $155,000 is needed.
In those cities, even the upper-middle class doesn’t qualify for an average home.
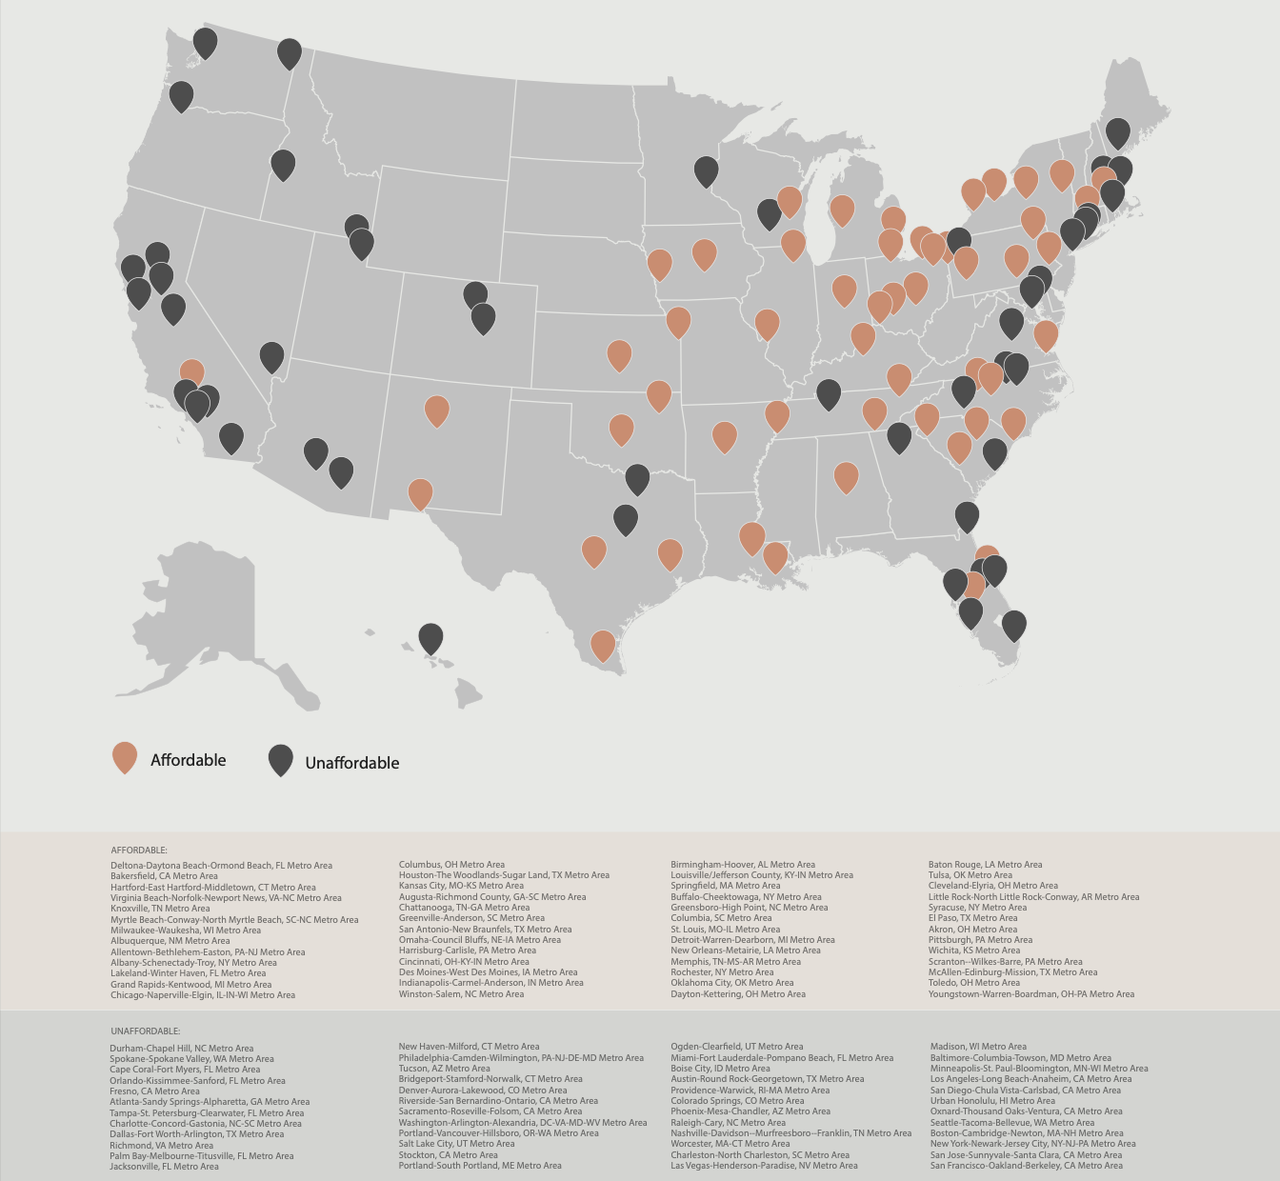
The study determined affordability by looking at how much income households need to earn to afford a down payment, mortgage payment, and related fees for an average home.
A home is considered affordable if monthly housing and mortgage costs don’t exceed 28% of a household’s gross income.
“There’s no two ways about it: Housing affordability has worsened significantly since Covid,” the report said. Since the pandemic, 39 of the most populous metros have fallen below the affordability threshold.
As expected, the most affordable areas for the middle class are located in the Midwest, Rust Belt, and parts of Texas, while the West Coast, Tri-State Area, and Hawaii are largely out of reach.
Affording a home is no longer a guarantee for the middle class
Being considered “middle class” doesn’t carry the same significance as it did just a few years ago.
“In the past, if you were middle class, it was almost assumed you would become a homeowner,” said Ali Wolf, chief economist of Zonda, a housing market research firm.
“Today, the aspiration is still there, but it is a lot more difficult. You have to be wealthy or lucky.”
That’s all thanks to a “perfect storm” of elevated mortgage rates, sky-high home prices, and a lack of inventory, making housing more unaffordable.
The result is that middle-income buyers, or those with an annual income of up to $75,000, could only afford about one-quarter of listings on the market last year.
According to Nadia Evangelou, the director of real estate research at the National Association of Realtors, “Middle-income buyers face the largest shortage of homes among all income groups, making it even harder for them to build wealth through homeownership.”
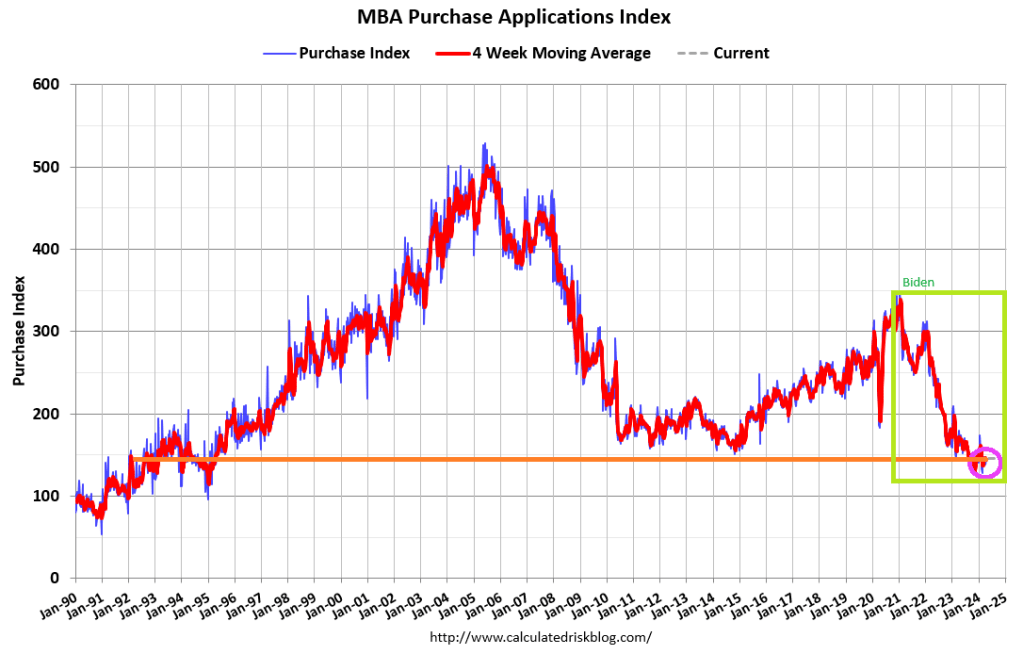
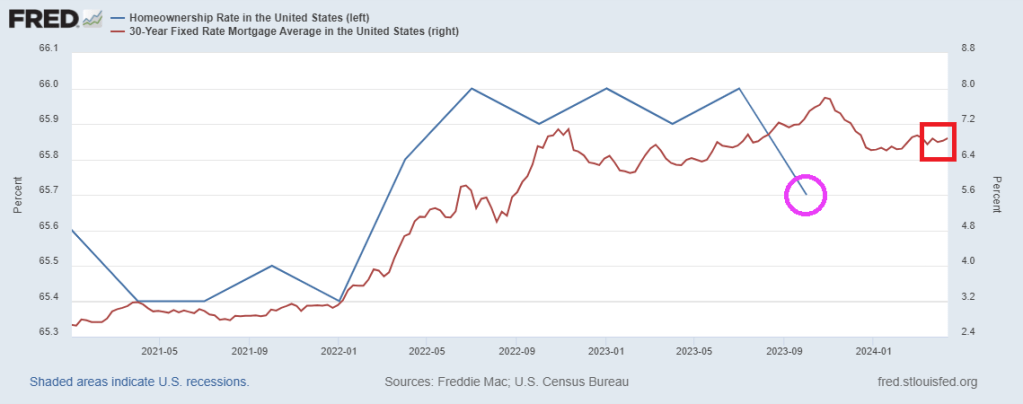
Mortgage rates (blue line) creep closer to 7%. Mortgage rates are UP 168% under Vacation Joe and home prices are up 32.5%.
After falling between November and January, mortgage rates are creeping back up.
According to Freddie Mac, 30-year fixed-rate mortgages reached 6.88% in the week of April 11 and at some point climbed well above 7%.
The reversal seems to be driven by a surprise spike in inflation, which has come out higher than expected for four consecutive months
“For homebuyers, the latest CPI report means mortgage rates will stay higher for longer because it makes the Fed unlikely to cut interest rates in the next few months,” said Chen Zaho, Redfin’s economic research lead.
“Housing costs are likely to continue going up for the near future, but persistently high mortgage rates and rising supply could cool home-price growth by the end of the year, taking some pressure off costs.”
Mortgage applications increased 3.3 percent from one week earlier, according to data from the Mortgage Bankers Association’s (MBA) Weekly Mortgage Applications Survey for the week ending April 12, 2024.
The Market Composite Index, a measure of mortgage loan application volume, increased 3.3 percent on a seasonally adjusted basis from one week earlier. On an unadjusted basis, the Index increased 4 percent compared with the previous week. The seasonally adjusted Purchase Index increased 5 percent from one week earlier. The unadjusted Purchase Index increased 6 percent compared with the previous week and was 10 percent lower than the same week one year ago.
The Refinance Index increased 0.5 percent from the previous week and was 11 percent higher than the same week one year ago.
Bidenomics, a massive subsidy to the political donor class, but heartless towards the middle class.
Joe Biden likes to sell himself as “working class Joe” or “union Joe.” The truth is anything but. He is “Washington DC insider Joe” or “big corporate Joe.”
The US mortgage 30 year rate is down slightly today to 7.30%. That is a whopping 160% increase since Biden’s Presidency began.
Mortgage rates will continue to climb as the US Treasury 10-year yield climbs.
The US homeownership rate is falling as mortgage rates climb.
US CPI on trend for 4-5% at US election in November.
Source: BofA
Above 5%…?
Strong CPI raises market probability of YE25 rates above 5%.
Source: Goldman
Cyclical inflation remains too elevated
“Our measure of cyclical inflation–which should capture the impact of excess demand on prices–appears to be stuck at around 5%, which is too elevated”
Source: Safra
US alone
The US is the only economy in the G10 where the latest inflation print surprised to the upside.
Source: Goldman
200% of GDP
Under current policies, government debt outstanding will grow from 100% to 200% of GDP.
Source: Apollo
Close to $9 trillion in maturities
That’s a significant amount of government debt maturing within the next year.
Source: Apollo
Every year a deficit
OMB forecasts 5% budget deficit every year for the next 10 years.
Source: Apollo
A billion per day….is long gone
US government interest payments per day have doubled from $1bn per day before the pandemic to almost $2bn per day in 2023.
Source: Apollo
Biggest Story of 2020s…Ugly End of 40-year Bond Bull
Chart shows long-term US government bond (15+ year) rolling 10-year annualized returns, %.
Source: Flow Show
Highest yields in 15 years
The intermediate part of the yield curve still offers the highest yields in over fifteen years.
Source: Piper Sandler
Finally, electricity costs keeps rising, ESPECIALLY with the misnamed Inflation Reduction Act (IRA). The real name of the IRA should have been the Large Green Donor Increase Act (LGDIA).
Joe Biden, his Administration, and The Federal Reserve are really “The Alligator People.” Despite what they tell you, they have small brains (particularly Biden) and are hyperfocused on spending.
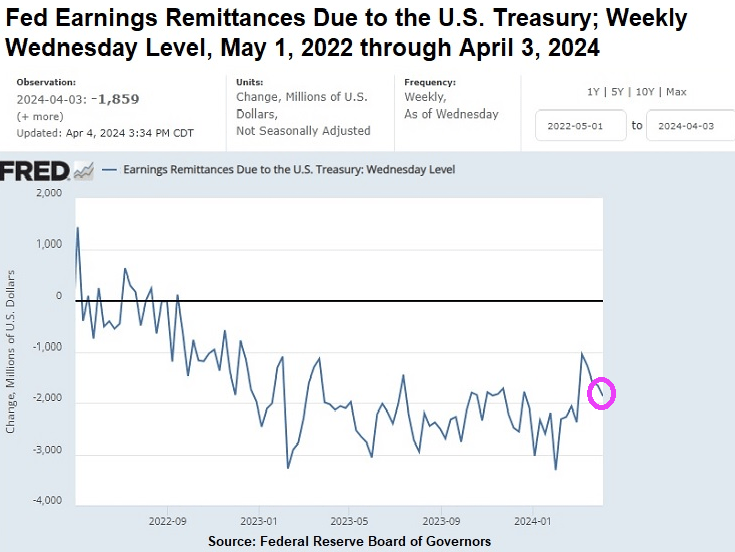
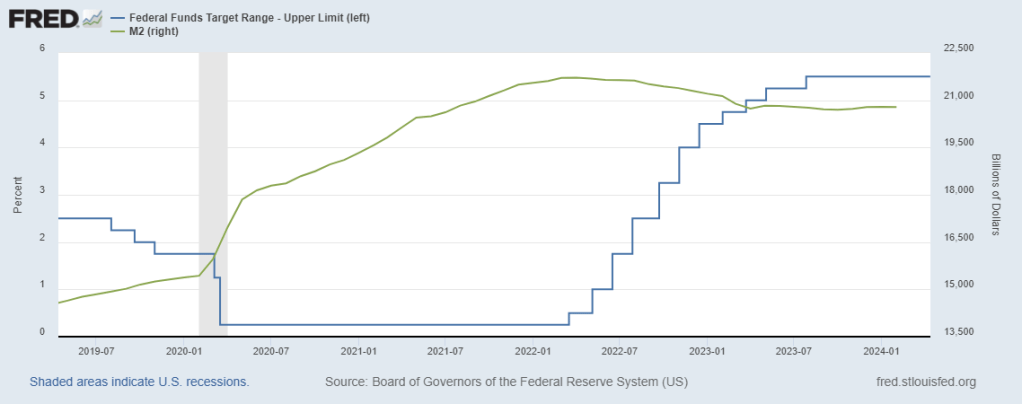
A good example comes from “Wall Street On Parade” where they show that The Federal Reserve is still paying BILLIONS to US Treasury in the form of remittances (losses). While at the same time, paying the mega banks on Wall Street high interest loans.
As of April 3 of this year, the Federal Reserve (Fed) has racked up $161 billion in accumulated losses. We’re not talking about unrealized losses on the underwater debt securities the Fed holds on its balance sheet, which it does not mark to market. We’re talking about real cash losses it is experiencing from earning approximately 2 percent interest on the $6.97 trillion of debt securities it holds on its balance sheet from its Quantitative Easing (QE) operations while it continues to pay out 5.4 percent interest to the mega banks on Wall Street (and other Fed member banks) for the reserves they hold with the Fed; 5.3 percent interest it pays on reverse repo operations with the Fed; and a whopping 6 percent dividend to member shareholder banks with assets of $10 billion or less and the lesser of 6 percent or the yield on the 10-year Treasury note at the most recent auction prior to the dividend payment to banks with assets larger than $10 billion. (This morning the 10-year Treasury is yielding 4.41 percent.)
Operating losses of this magnitude are unprecedented at the of Fed, which was created in 1913. In a press release dated March 26, the Fed stated this: “The Reserve Banks’ 2023 sum total of expenses exceeded earnings by $114.3 billion.”
As the chart above indicates, the Fed’s ongoing weekly losses have ranged from a high of $3.3 billion for the week ending Wednesday, January 31, 2024, to $1.86 billion for the most recent week ending Wednesday, April 3, 2024.
American taxpayers have good reason to sit up and pay attention to the Fed’s giant and ongoing losses. That’s because when the Fed is operating in the green, as it was on an annual basis for 106 years from 1916 through 2022, the Fed, by law, turns over excess earnings to the U.S. Treasury – thus reducing the amount the U.S. government has to borrow by issuing Treasury debt securities. According to Fed data, between 2011 and 2021, the Fed’s excess earnings paid to the U.S. Treasury totaled more than $920 billion.
WHO pays for the student loan forgiveness? It just doesn’t vanish, it is transferred to taxpayers. Alligators like Alexandria Ocasio Cortez going on talk shows to argue the benefits of being free from financial obligations that student voluntarily agreed to. Say, can AOC get my mortgage forgiven?? Just kidding. Now those same students can borrow additional money to get MBA degrees with the expectation that the student loan is “free money.”
Yes, Biden is acting recklessly (no surprise). Here is a picture of King Gator, Joe Biden.
The Biden Administration and The Federal Reserve ARE the alligator people. Except these gators are hungry for your money and votes constantly.
Despite Biden’s rambling that inflation is improving, bear in mind that the inflation rate is at it highest in 50 years. Yes, it has improved from 18% in 2022 to above 10% today.
A recent research paper by four noted economists, including Larry Summers, the former Treasury Secretary under Barack Obama and former Harvard President, discovered that the real inflation rate during the Biden years, using pre-1983 calculations reached 18% in 2022.
The number is the highest inflation rate the country has seen in over 50 years.
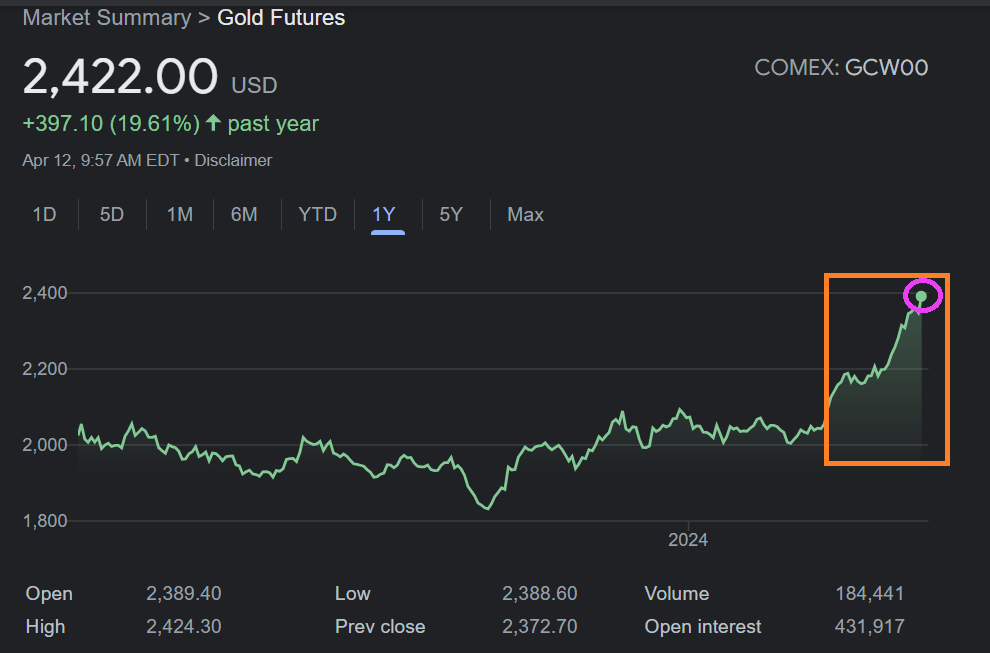
Gold futures prices are soaring and are at $2,422.00. Gold futures prices are up 19.61% over the past year.
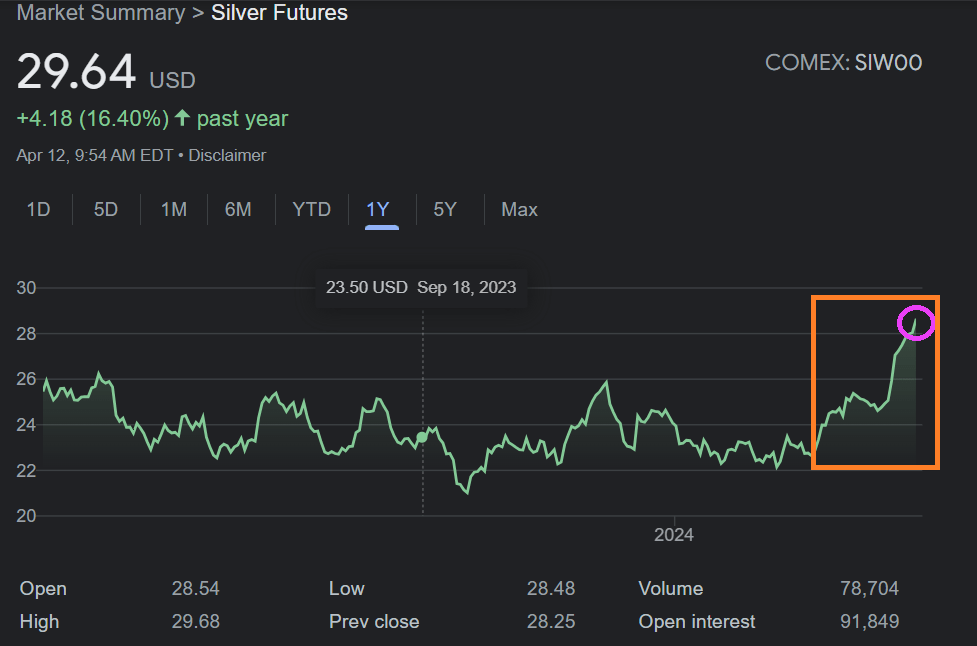
Silver futures prices are also soaring and are at $29.64. Silver futures prices are up 16.40% over the past year.
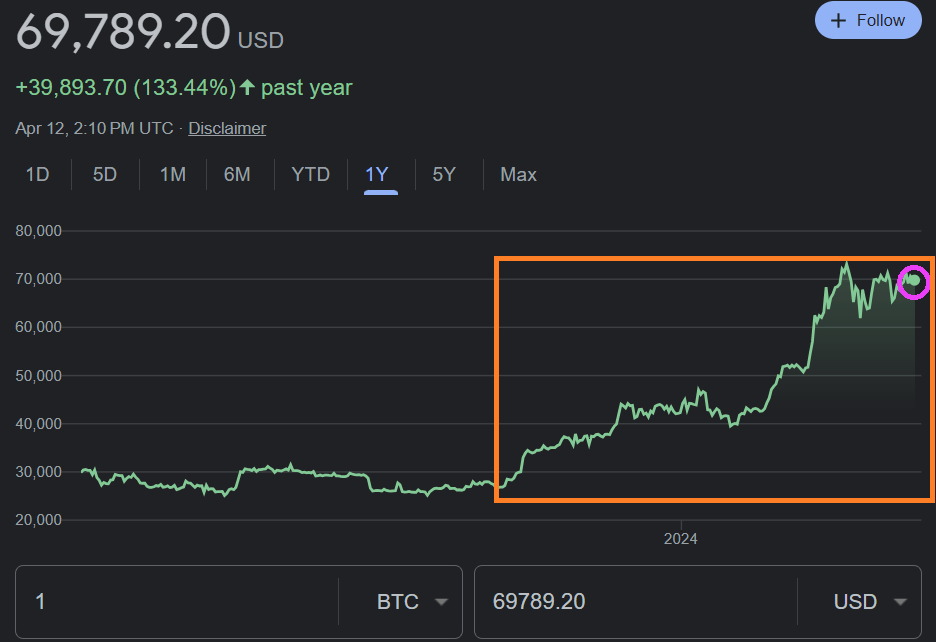
Bitcoin is almost at $70,000 and is up 133.44% over the past year.
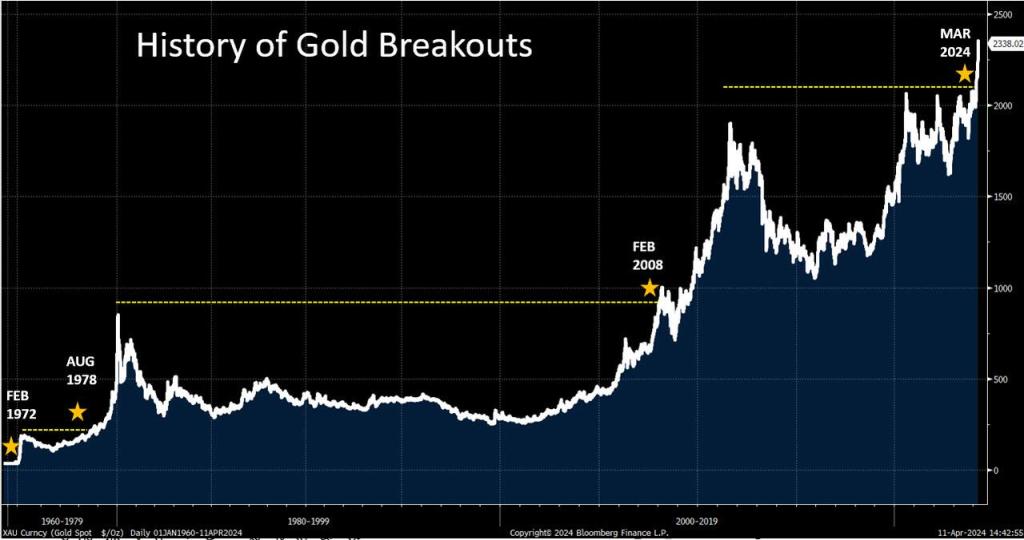
Returning to gold, we are seeing another gold breakout, like the breakout in 2008.
Even central banks are loading up on gold, silver, and cryptos. Why? Primarily fear of US reckless budgets and exploding debts/deficits (don’t listen to Biden talk about how “he” reduced deficits and debt (both have risen to dangerous levels under he inattentive eyes).
However, calming the jangled nerves of pension funds is that the S&P 500 stock market index is up 26.04% over the past year.
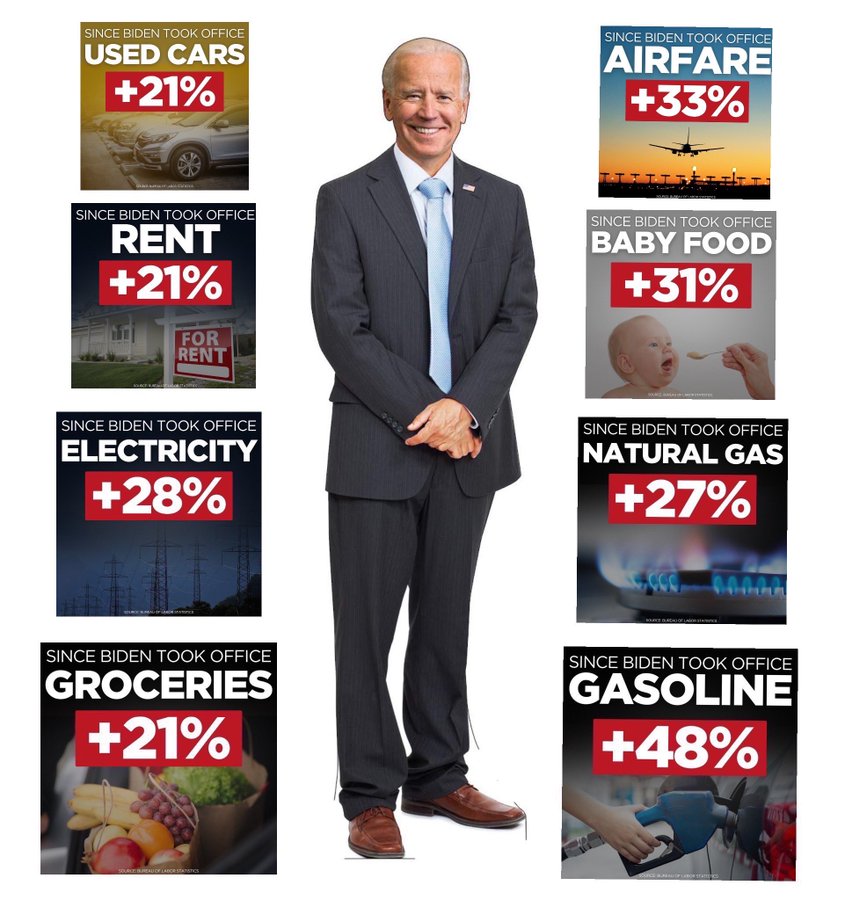
Overall prices are up by 19.4% since Biden took office.
Of course, the S&P 500 is not sustainable given that it has been driven by excessive spending by the Biden Adminstration coupled with still massive monetary stimulus from The Federal Reserve.
In summary, gold, silver and cryptos are rising on FEAR! Of Biden, Congress and The Fed.
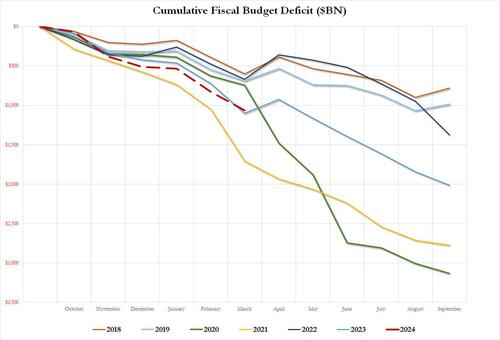
Under Biden’s “Reign of Error”, the interest on US debt just hit a record $1.1 trillion and the US deficit for just the first six months of fiscal 2024 is also $1.1 trillion.
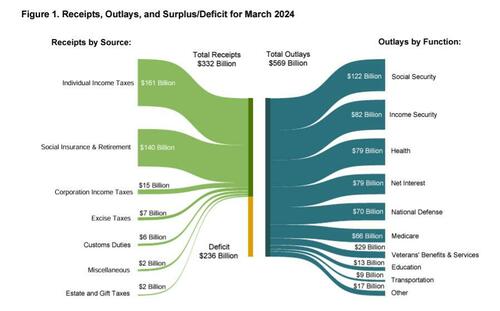
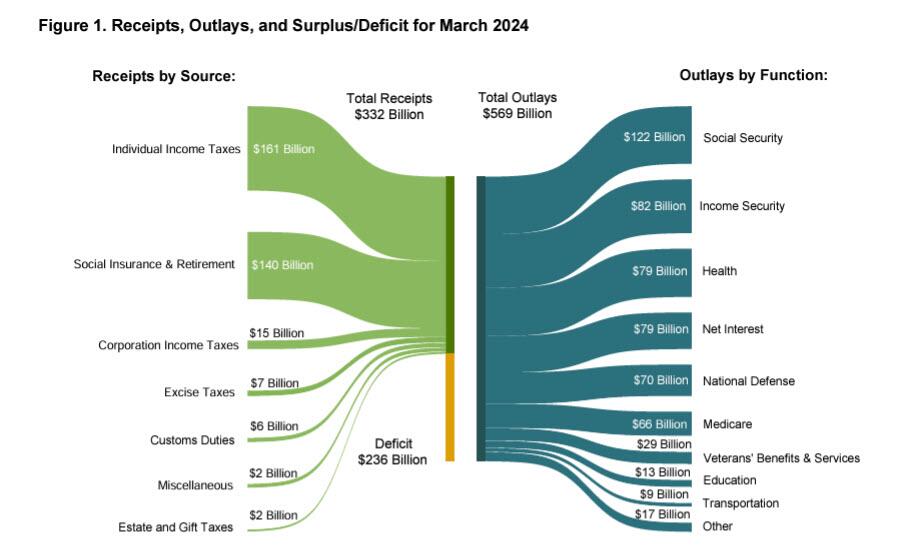
According to the latest Treasury Monthly Statement, in March the US deficit hit $236 billion, some $40 billion more than the $196 billion expected, if below February’s $296 billion…
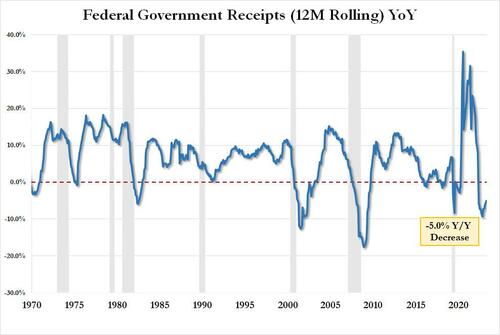
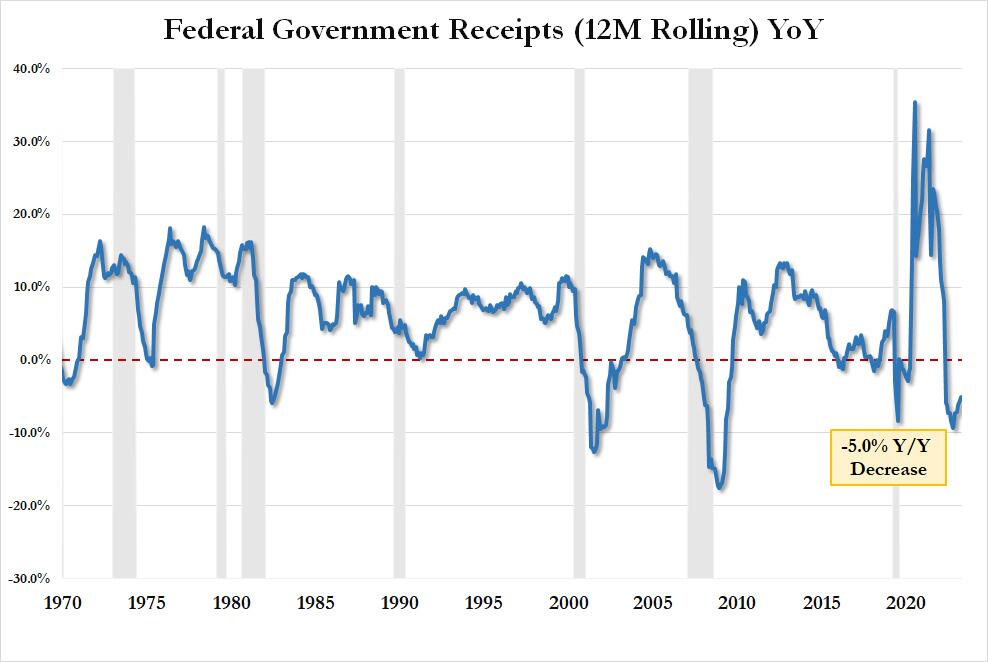
… which was the result of $332 billion in govt tax receipts – translating into $4.580 trillion in LTM tax receipts, and which was down 5% compared to a year ago…
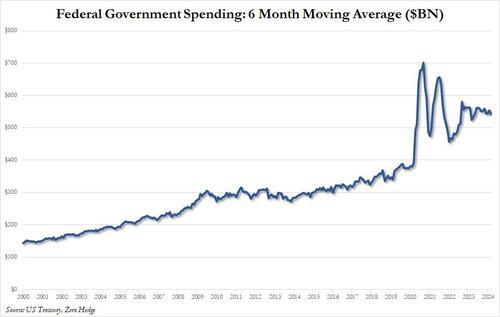
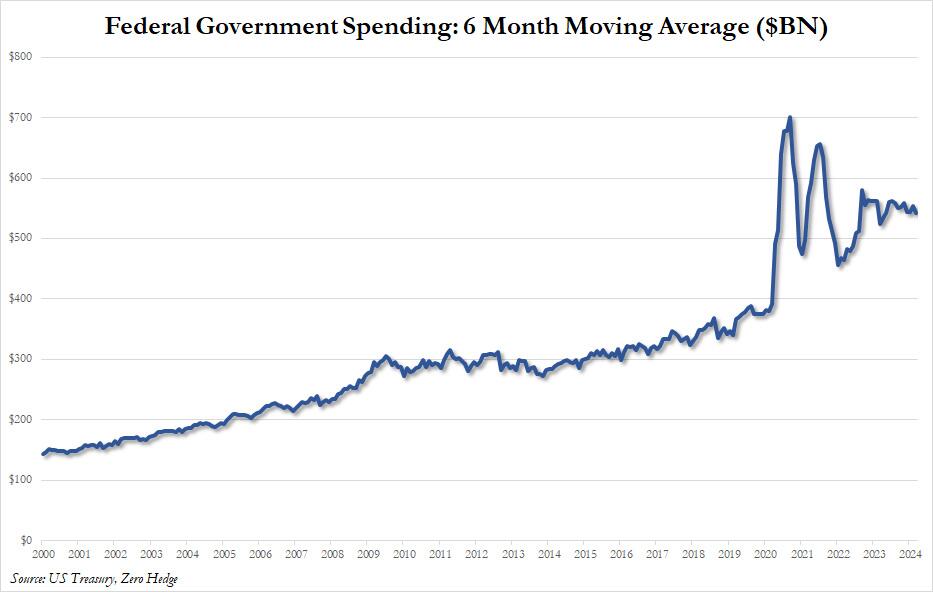
… offset by the now traditional ridiculous monthly outlays, which in March amounted to $568 billion, up from $567 billion in February and the highest monthly spending total in calendar 2024, which translated into a 6 month moving spending average (for smoothing purposes) of $542 billion. Take a wild guess what will happen to the chart below during and after the next recession.
This, incidentally, is a reminder that the US does not have a tax collection problem – it has a spending problem, and no amount of tax changes will fix it; in fact all higher taxes will do is force more billionaires to move to Dubai where they pay zero taxes.
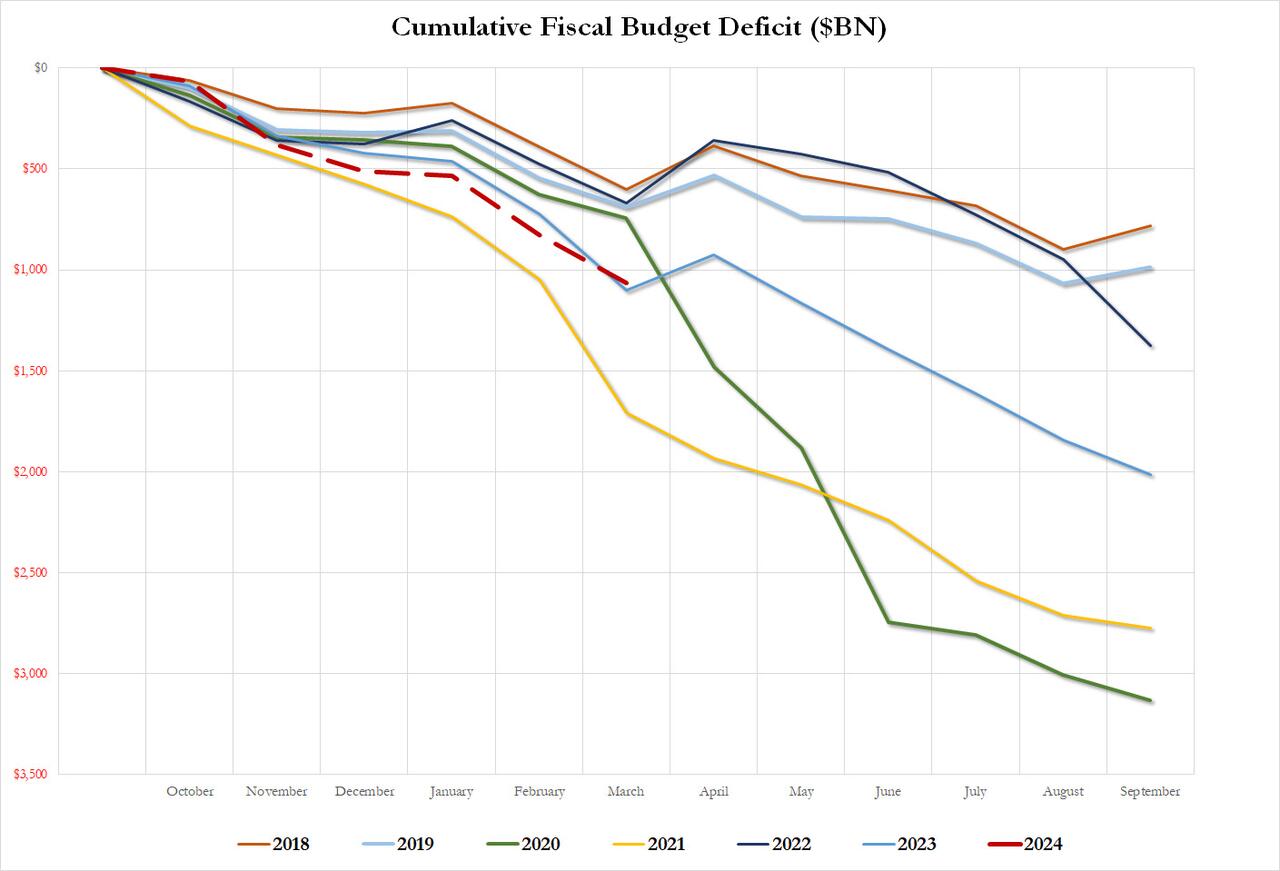
Putting the YTD deficit in context, in the first six months of fiscal 2024, the US deficit hit $1.065 trillion, just shy of the $1.1 trillion reached last year, which was the 2nd highest on record and only the post-covid 2021 was worse. Annualized, we expect total deficit to hit $2.2 trillion in fiscal 2024, a year when the US is supposedly “growing” at a nice, brisk ~2.5% pace. One can only imagine what the GDP growth would be if the US wasn’t set to have a wartime/crisis deficit…
… and we can’t even imagine what US deficit will be after the next recession/depression.
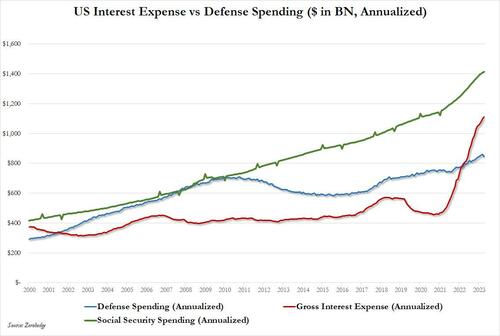
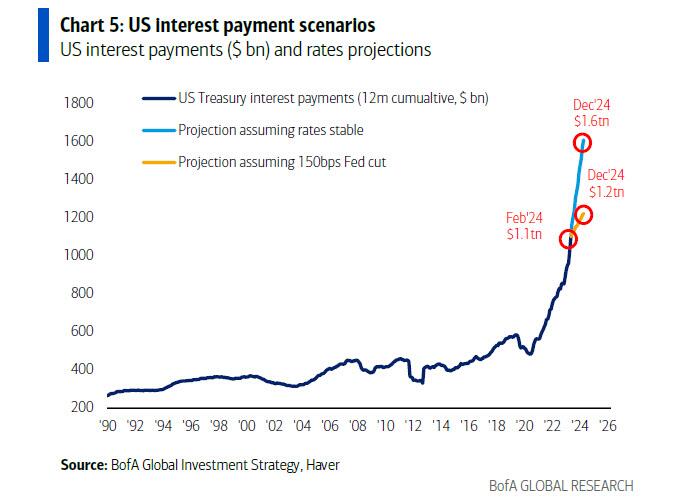
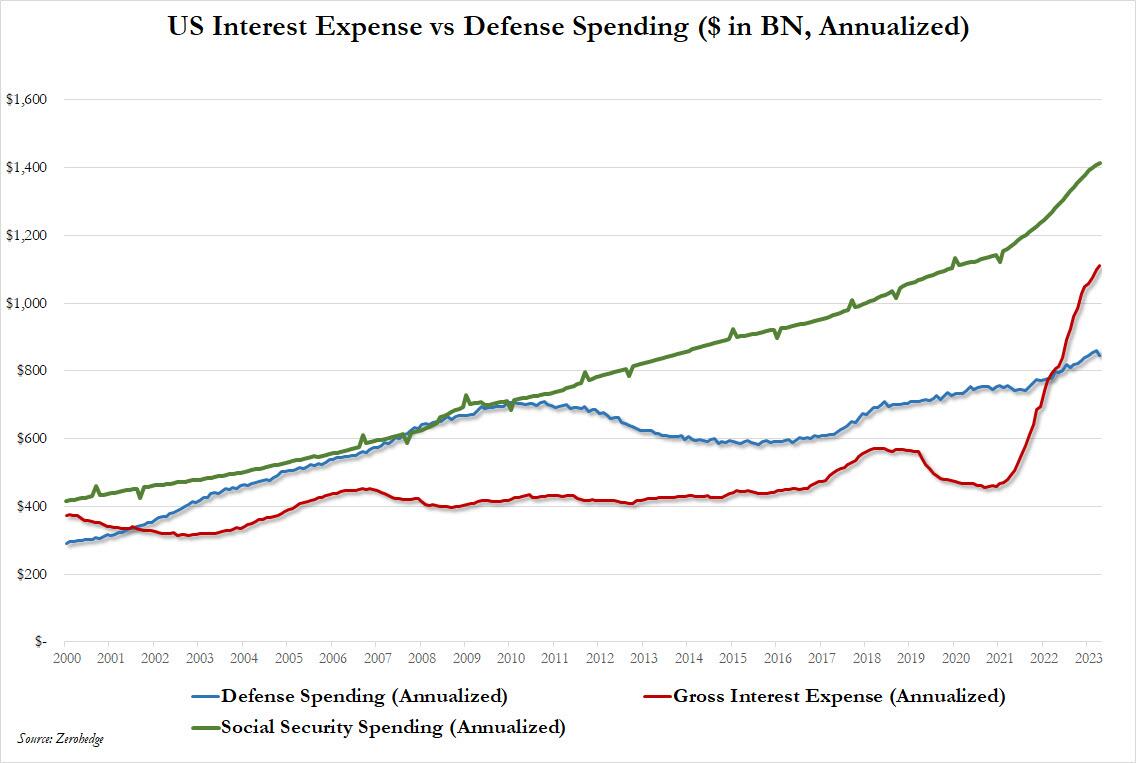
Meanwhile, as reported previously, total US interest continues to explode, and after surpassing total annual defense spending about a year ago, just the interest on US debt will soon become the single largest government outlay as it surpasses social security by the end of 2024, when according to BofA’s Michael Hartnett it hits $1.6 trillion…
.. and surpasses Social Security spending as the single largest spending category in the US government.
Biden has wanted to get rid of Social Security for a long-time and now wants to get rid of Medicare Advantage programs and put everyone on Medicare. Looks like Cloward-Piven!
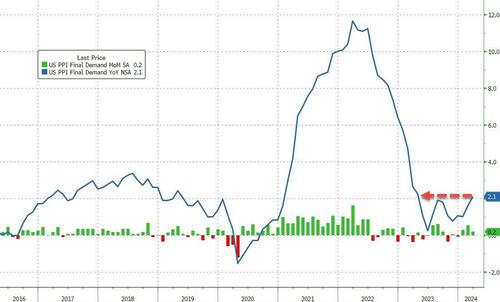
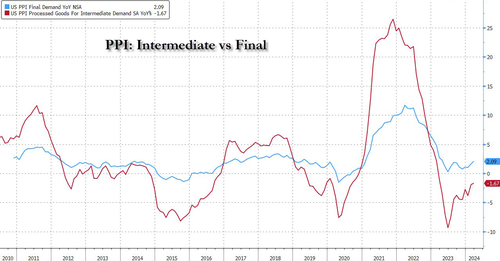
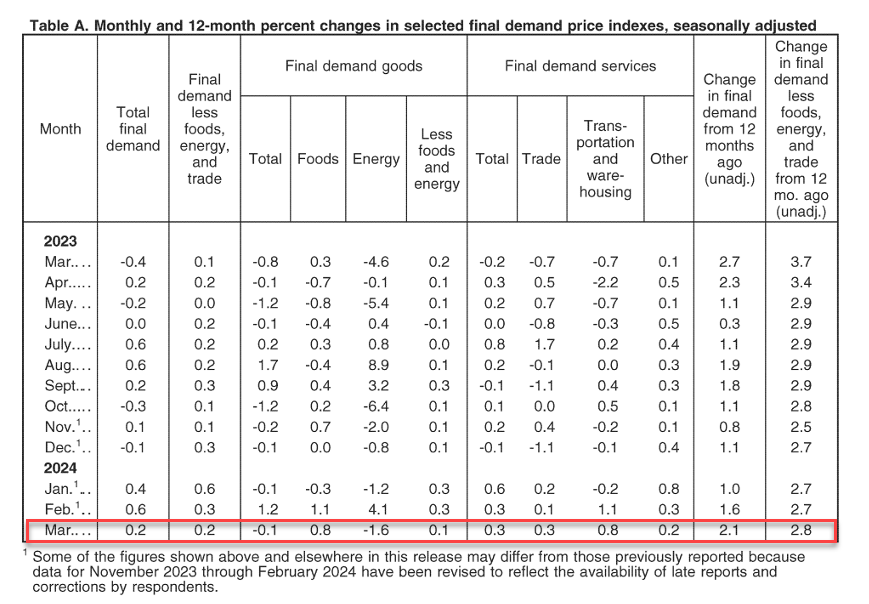
On top of skyroceting budget deficits, we have Producer Prices rising at fastest pace in a year in March.
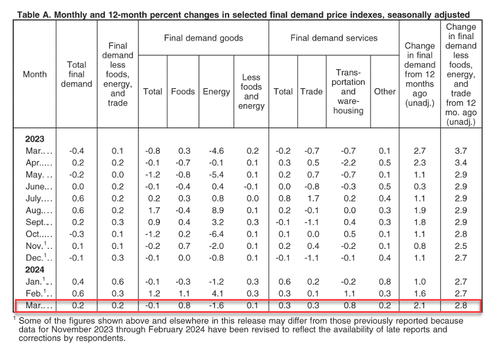
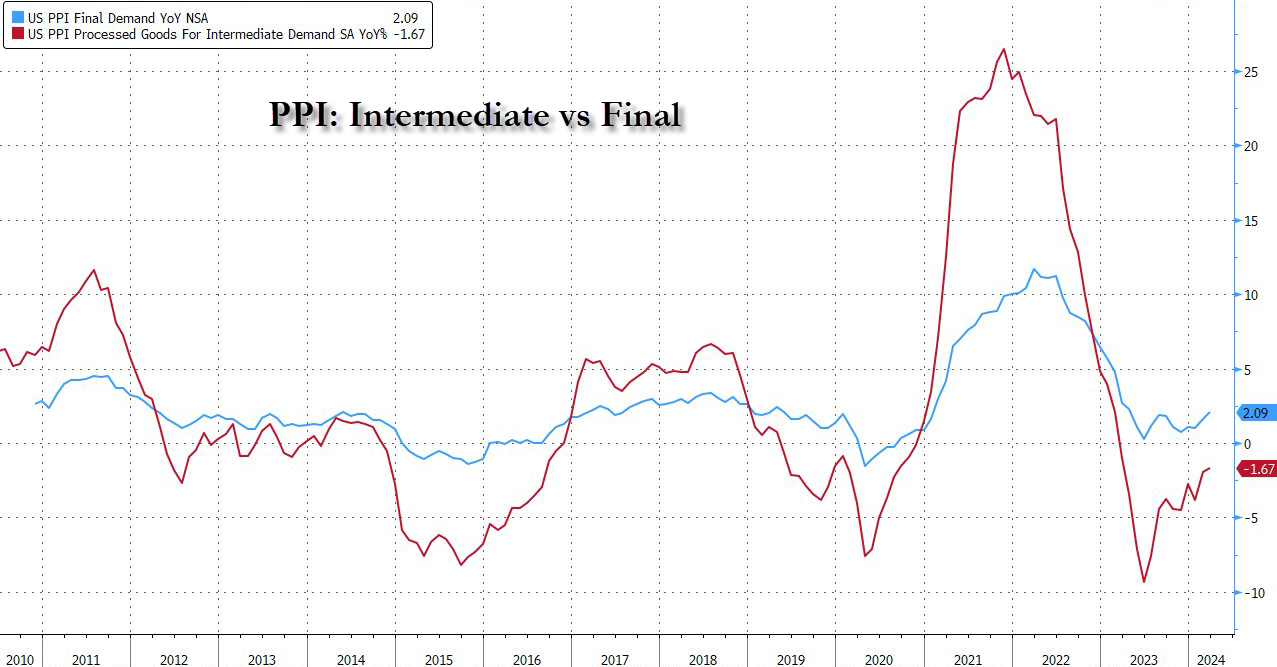
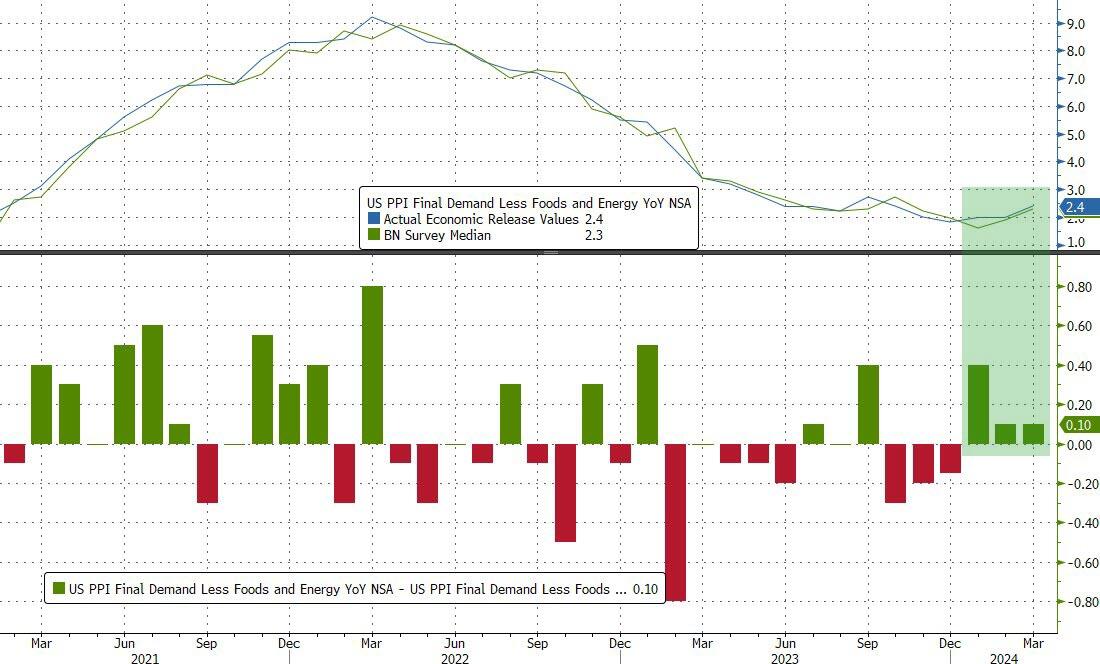
After yesterday’s CPI-surge, PPI followed along, with headline producer prices rising 0.2% MoM (+0.3% MoM exp), pushing the YoY PPI to +2.1% (+2.2% exp) from +1.6% – the highest since April 2023…
Source: Bloomberg
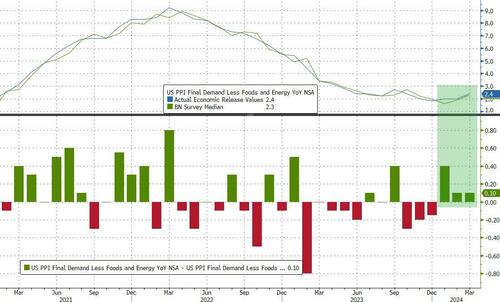
Core CPI rose 2.4% YoY (hotter than the expected 2.3%) – the third hotter-than-expected core PPI print in a row…
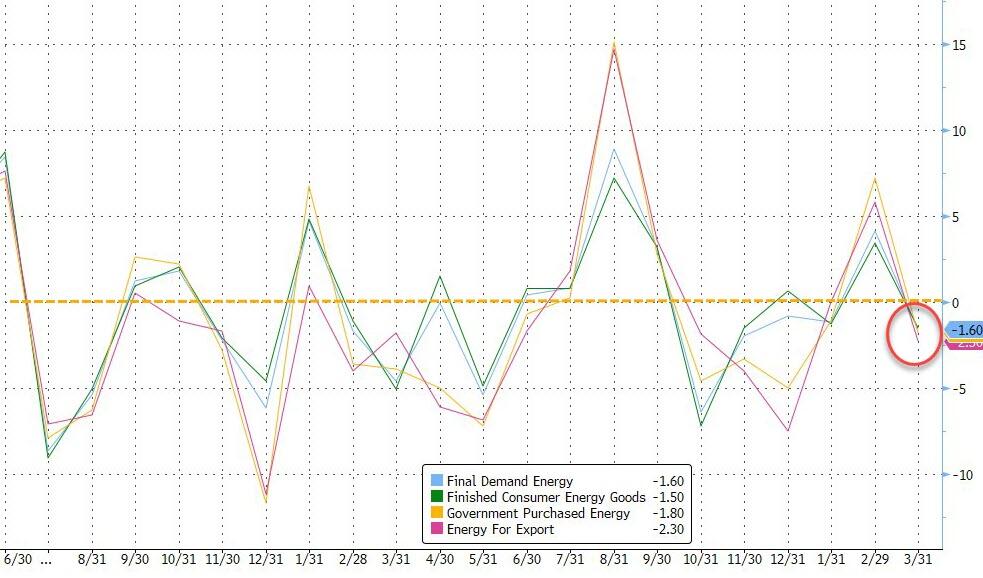
Under the hood, Services prices rose while goods prices declined MoM.
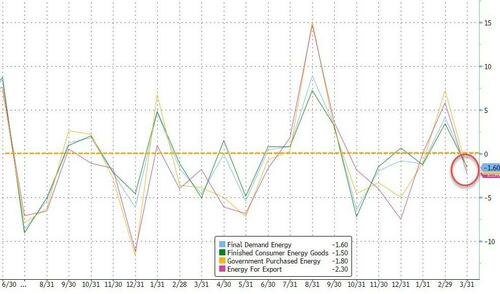
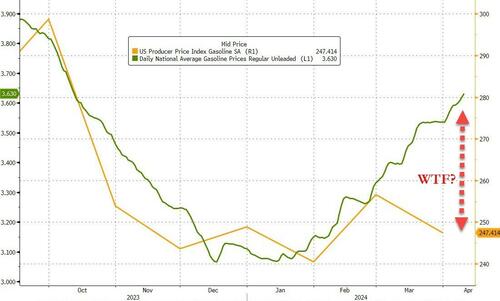
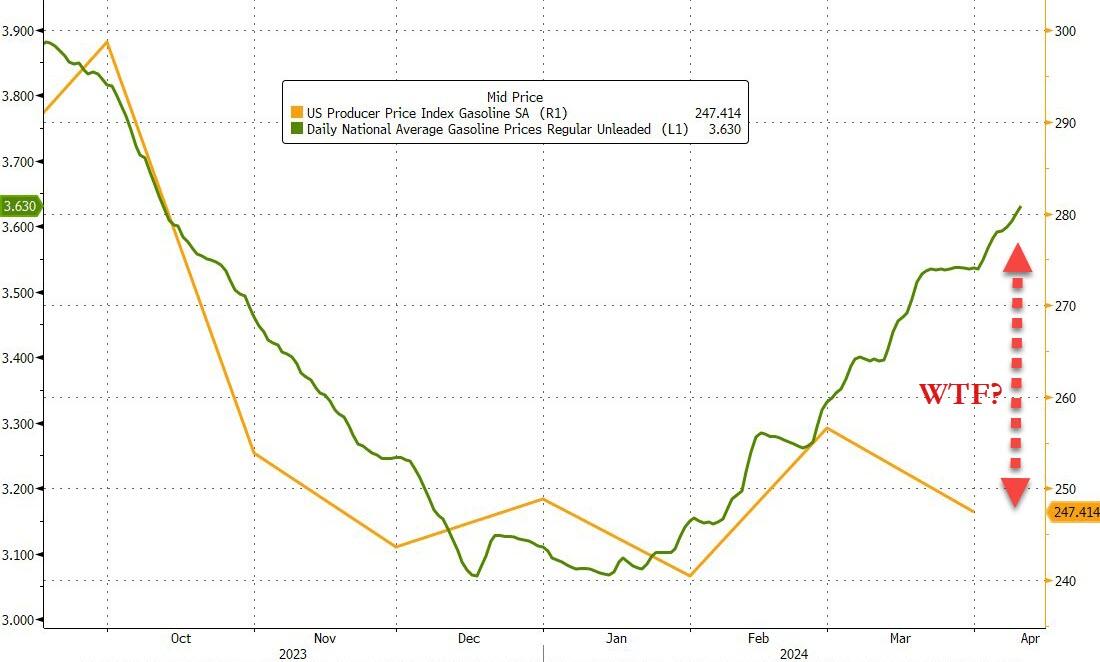
One thing that stands out as rather odd is the 1.6% MoM decline in Energy costs in the month… as prices soared for crude and gasoline?
Leading the March decline in the index for final demand goods, prices for gasoline decreased 3.6 percent…
And blame the markets for why the print was hot:
A major factor in the March increase in prices for final demand services was the index for securities brokerage, dealing, investment advice, and related services, which rose 3.1 percent.
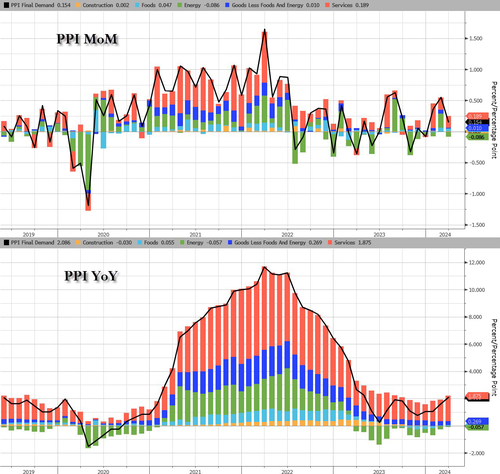
And on a YoY basis, Services costs are accelerating…
Pressure continues to build in the inflation pipeline too…
While some may cling with grim hope to the ‘cooler than expected’ headline PPI print, core PPI is hot, damn hot, and headline PPI is rising. Not at all what The Fed, or Biden, wants to see – no matter how hard they spin it.
This is Victor Davis Hansen from Stanford’s Hoover Institute.


You must be logged in to post a comment.