Three regional Fed reports I like to watch are New York’s Empire State Outlook, Philly Fed’s Outlook and Richmond Fed’s outlook. Today, The Richmond Fed released their manufacturing outlook and … it declined to -11.
So the big three are all down (Philly down to -8.9 while NY’s Empire State outlook is down to -32.9.
On the Treasury front, the US 10Y-3M yield curve inverted further (a signal of impending recession) just tanked to -126.462 basis points.
Ah, the start of a new week with Treasury Secretary Janet Yellen arguing (with a straight face) that there is no room in the Federal budget for cuts. Apparenly, Yellen never read any of the massive, pork-laden spending bills signed by Biden (no one else did in Congress either, nor did Biden).
Let’s start with the US credit default swap (1 year). It remains high at 68.72 (the price of insuring against a US default). And the US Treasury yield curve (10Y-3M)? It remains deeply inverted at -114 basis points this morning signaling an impending US recession.
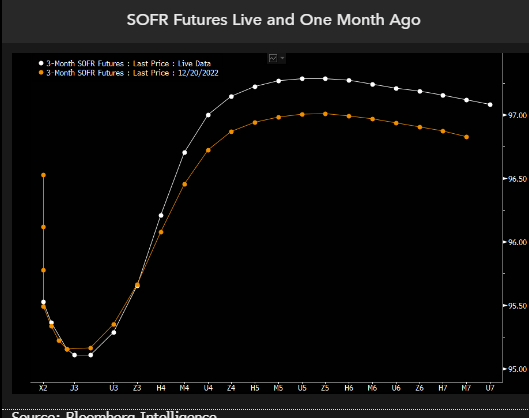
Then we have SOFR (Secured Overnight Financing Rate). SOFR futures are pricing for the Federal Reserve to hike rates a few more times and to start cutting before the end of this year. The pricing for the 2023 rate path is little changed from a month ago, but this year the market has priced in deeper cuts in 2024, with SOFR now seen below 3% by early 2025 before stabilizing. The implication is that hedging recession and significant rate cuts in 2024 now seems to be fully priced in, yet there’s a risk that the Fed cuts even deeper than the market is factoring in.
We think the market is partially preparing for the risk of even deeper rate cuts than linear instruments are pricing. To see how dramatic those are, we can look at options on SOFR futures and model what’s being priced by the volatility surface.
We are seeing the same story if we look at Fed Funds Futures data. Fed rate hikes until June, then rate cuts to follow.
How did Biden’s lawyers and now the DOJ figure out that Biden has classified documents all over the place? Probably from reading “The Hardy Boys.” Except that Biden didn’t cleverly hide classifed documents. Rather, he carelessly left them lying around at The Penn Biden Center and his home in Wilmington Delaware that he shared with his son, Hunter. And probably on the Amtrak train he would take from Wilmington to Union Station in DC. And probably at Chinatown Garden, a short walk from The White House.
I must admit, Joe Biden has a horribly misleading nickname “Middle Class Joe.” Between Biden’s horrible energy policies and Pelosi’s/Schumer’s spending binges, the US middle class and low wage workers have suffered mightely with the inflation tax. Throw in Jerome Powell and The Federal Reserve’s manic money printing and the American middle class has a problem.
US inflation peaked at 9.1% year-over-year (YoY), but has declined to a still painful 7.1% YoY as The Fed removes it aggressive monetary stimulus. But to cope with persistent US inflation, consumers have had to dip into savings and use more credit cards. As a consequence, personal savings plunged -64.8% YoY while consumer credit rose 7.9% YoY.
The other tax on the middle class and low-wage workers is the 21 straight months of negative REAL weekly earnings growth.
On the housing front, REAL home prices are growing at 1.5% YoY while REAL weekly wage growth is still NEGATIVE at -3.13% YoY.
Make no mistake, inflation caused by The Fed and Federal governments spending is a tax on the middle class and low wage workers.
Biden, Pelosi, Schumer and Powell are the 4 Horseman of the Inflation Apocalypse.
First, US default risk as measured by credit default swaps remains elevated (primarily because Biden and Democrats refused to cut wasteful spending or reign in non-retirees on Social Security). And NY Fed’s Reverse Repos remain elevated.
And then we have Citi’s economic surprise index for the US at -17 as The Fed slows money growth to 0%.
I wish I knew a place where inflation and insane Federal government spending and policies doesn’t exist.
We got trouble in Potomac City! No, I’m not talking about the numerous Top Secret documents that Biden carelessly left in his garage in Delaware and the UPenn Biden Center. And they found more over the weekend. I’m talking about the US Treasury 10Y-2Y yield curve being inverted for 135 straight days. And thanks to inflation, REAL wage growth has been negative for 21 straight months.
All this is happening while M2 Money growth (green line) stalls to 0% YoY.
Swaps 5Y are rising as The Fed withdraws monetary stimulus.
Its that time again when Congress does its Kabuki Theater drama about raising the US debt limit. Of course, everyone in Congress and the Biden Administration want to spend trillions of dollars so they will hike the debt limit.
With the US government facing the danger of a payments default later this year, Congress has a variety of paths to avert economic disaster and boost the debt ceiling.
All of them would likely involve going right up to the market-rattling brink, according to current and former lawmakers and aides.
The timeline kicks off within weeks, when Treasury Secretary Janet Yellen is expected to advise that the government will deploy extraordinary accounting measures to avoid running out of cash. Those steps are forecast to be exhausted after July.
Republicans now in control of the House are demanding deep spending cuts as the price for an increase in the ceiling, while President Joe Biden and congressional Democrats reject such an outcome.
Nothing has been the same since the financial crisis of 2008 and the ascension of all-time big spender Nancy Pelosi as House Speaker. Budget deficits have never been the same. The last budget surplus was under House Speaker Newt Gingrich. But since the financial crisis of 2008, Federal spending seems to have increased its trajectory.
Note that mandatory spending (Medicare, Social Security, etc) is growing like a wild fire while discretionary spending is seemingly flat. So, it mandatory spending that Congress will pretend to cut.
Yes, it is Medicare for our aging population that has blown out of control.
Then we have defense spending. The Ukraine spending should come from this pot, but forces decisions to make between Ukraine and taking care of our Navy (to compete with the growing Chinese navy).
Of course, as The Fed fights inflation, we are seeing the COST of Federal debt soaring since Covid.
Yes, Congress NEEDS to cut back the spending, particularly on Social Security and Medicare (not to mention Ukraine spending), but it is all Kabuki theater. Queue the screams of “Republicans will take away …”.
I wish everyone in Congress were like Kentucky U.S. Senator Rand Paul, not the other spendaholic Kentucky Senator.
I don’t think this is a record that Biden can run on for re-election: 21 straight months of NEGATIVE REAL WAGE GRWOTH. Fortunately for Fed Chair Jay Powell, he is not an elected official.
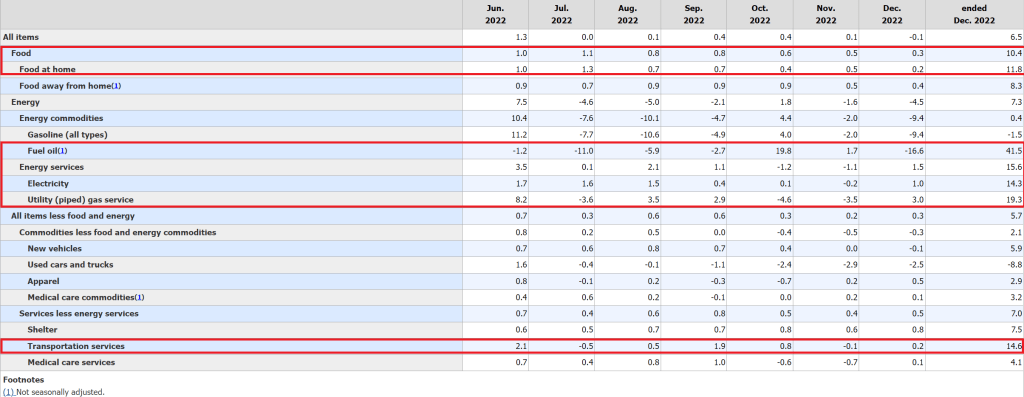
The December inflation report still shows elevated inflation in the US, but only -0.1% since November (MoM), but still high compared to last year (6.5% YoY). That is still over 3x The Fed’s target inflation rate of 2%.
While headline inflation fell to 0.1% MoM, CORE inflation (removing food and energy) rose again 0.3% MoM and 5.7% YoY.
What exactly went up in price in December? Food and energy were all over 10% YoY growth.
At 6.50% YoY headline inflation, the Taylor Rule suggests a Fed Funds Target rate of … 13.13%. Well, I guess that Powell will say there is more rate hikes to be done.
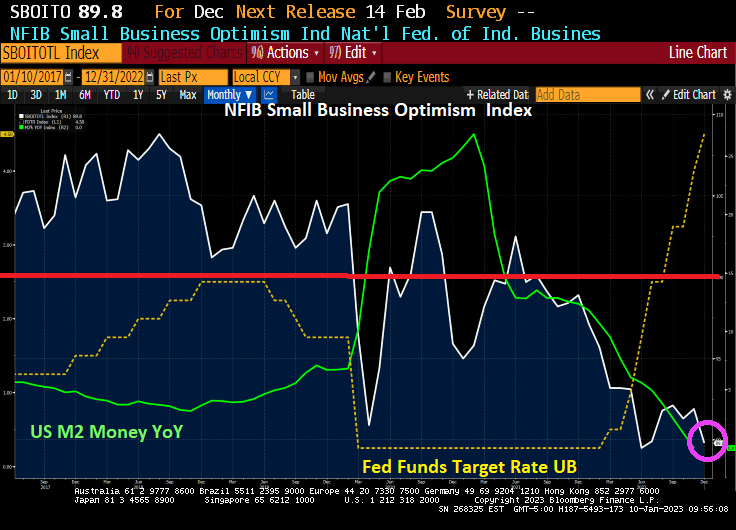
The NFIB Small Business Optimism Index is plunging and just fell below 90. The index was above 100 before the Wuhan virus outbreak in 2020, but has only been at 100 or above for only two months under Biden. And the trend is definitely looking bleak as The Federal Reserve fights inflation with M2 Money growth having collapsed to 0% YoY growth.
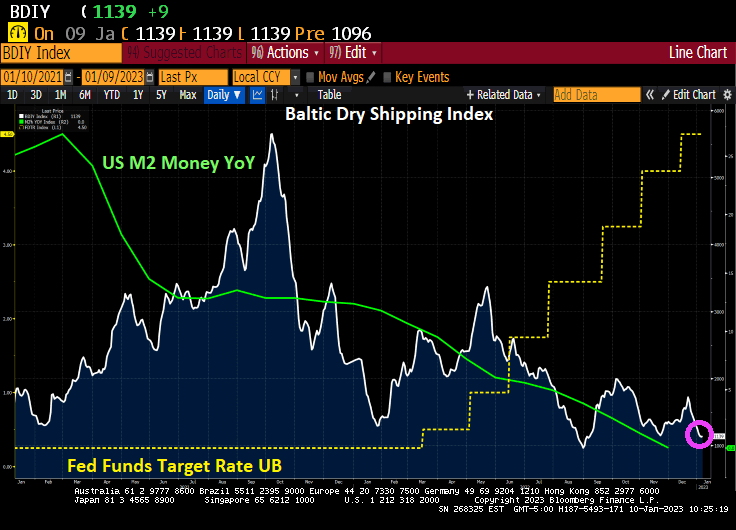
And the Baltic Dry shipping index is falling with M2 Money growth YoY.
I wonder what Fed Chair Jerome Powell is thinking?
Today is all quiet of the financial market front since the US stock
Today is all quiet of the financial market front since the US stock and bond markets are closed. But as the new year starts, we have to ask the following question: is the US already in a recession?
A simple measure of IMPENDING recession is the US yield curve which is currently inverted. Typically, a recession occurs within months of the yield curve inverting. But if we look at real GDP growth, the Atlanta Fed GDP tracker is at 3.7%, so no recession there (two consecutive quarters of negative GDP growth is often used as a measure of recession).
But another indicator of “all is not well” is the CBOE Put/Call Ratio. Typically, the Put/Call Ratio spikes during a recession. But on December 28, 2022, the Put/Call Ratio spiked to its highest level since 1996. Although it has calmed down to 0.84 on December 30, 2022. Suffice it to say that there is enormous uncertainty in markets.
Covid begat massive Fed monetary stimulus and an excuse for the Federal government to go on a series of spending sprees (Covid “relief”, Instrastructure, Inflation Reduction, and now the $1.7 Trillion pork-laden Omnibus bill). Now that historic big spender Nancy Pelosi (CA-D) is no longer Speaker, will her successor have such a voracious spending appetite? The US economy is still benefitting from Covid-related stimulus which also helped generate 40-year highs in inflation.
Thanks to inflation, US workers have had 20 consecutive months of negative wage growth. But as M2 Money growth slows to a halt, so will real average hourly earnings.
The traditional measures of recession (unemployment and Real GDP growth) are NOT pointing to recession, but 20 straight months of negative wage growth points to bad news for workers. Throw in an inverted yield curve and massive volatility in the CBOE Put-Call Ratio and we have a party … that I don’t want to attend.


You must be logged in to post a comment.