Heartaches in heartaches. US GDP growth for Q2 has stumbled to 0.446% as The Fed is launching quantitative tightening (QT) to fight the inflation that they caused in the first place.
According to the Atlanta Fed’s GDPNow real-time GDP tracker, US GDP growth has stumbled to a meager 0.446%. Despite the massive stimulus from The Federal Reserve and Washington DC’s massive fiscal stimulus.
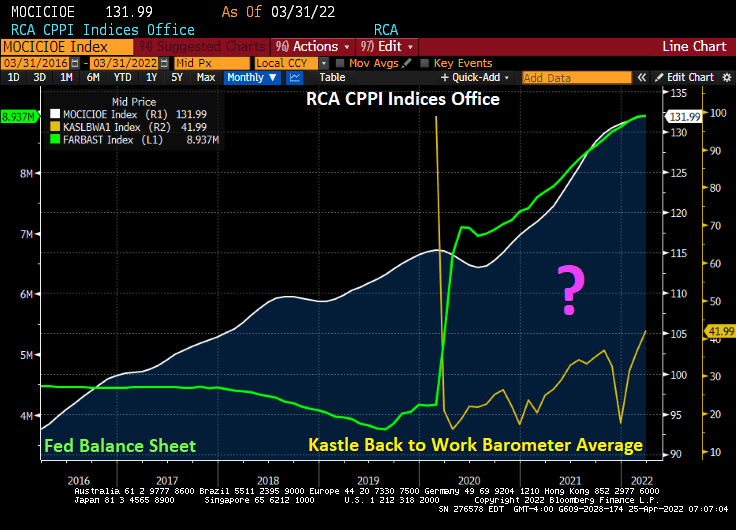
Do you want to see a magic trick? Like how governments shut down the US economy resulting in collapsing office occupancy rates while the price of office buildings rose dramatically (+16.3% since Q2 2020)?
Kastle’s “Back to work barometer” is showing that the 10 city average occupancy rate in the US is now only 42.8% as remote working has caught on. And the fear of yet another Covid mutation is keeping office occupancy below 50%.
Even Washington DC, home of Dr. Anthony Fauci, has only a 37.5% occupancy rate. Of the top 10 cities, Austin TX has the highest office occupancy rate at 62.4%.
So, the magic trick is not why America is so slow to return to the office, but why commercial office prices are rising so fast. Ah, Federal government STIMULYTPO! Aka, The Federal Reserve has been overstimulating the economy since 2008 and particularly since 2020 and Covid.
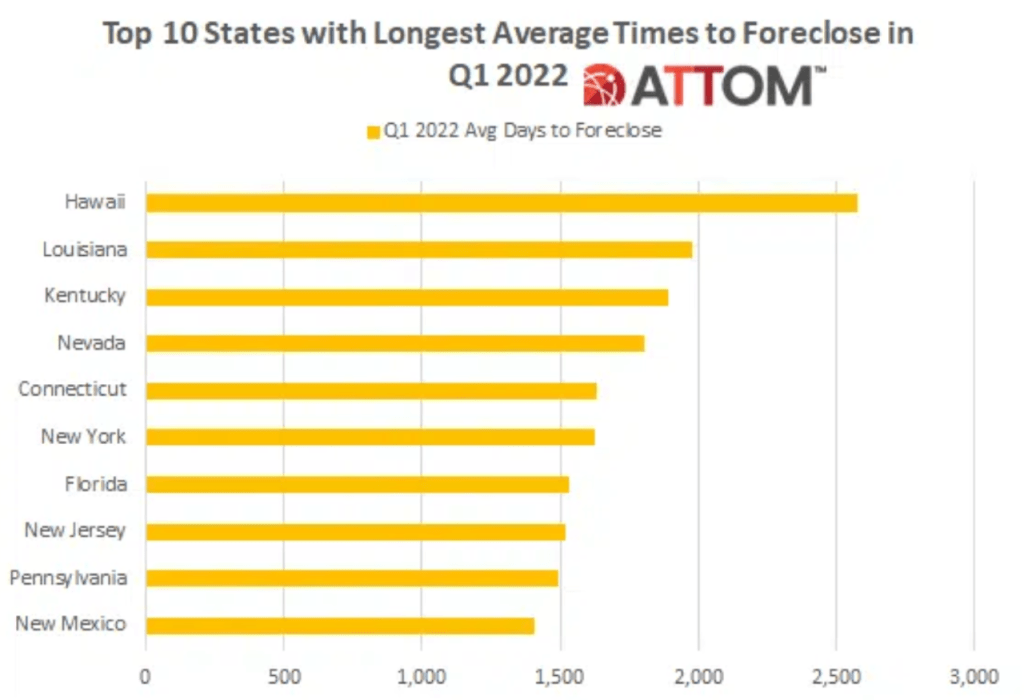
Speaking of a magic trick, here is how government’s make the average time to foreclosure up to over 7 years in Hawaii and 4.4 years in New York. In simple terms, you can buy a home in New York, never make a mortgage payment and live rent free for an average of 4.4 years.
So, the government’s magic trick is to 1) shut down local economies in fear of Covid, 2) provide excessive fiscal and monetary stimulus to combat the shutdown, 3) watch office building prices soar with stimulus as office occupancy remains below 50%.
Do you want to see a magic trick? Watch The Fed try to tighten monetary easing and NOT crash the economy.
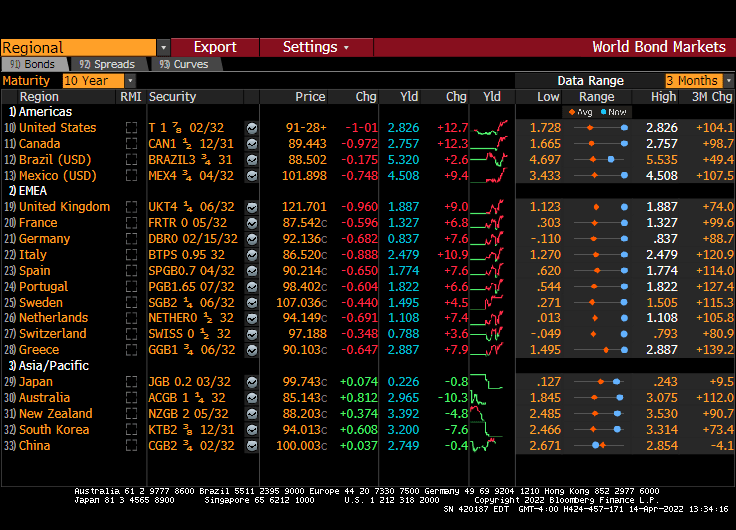
Update for 04/25/2022. 10Y Treasury yields DOWN 8.7 bps.
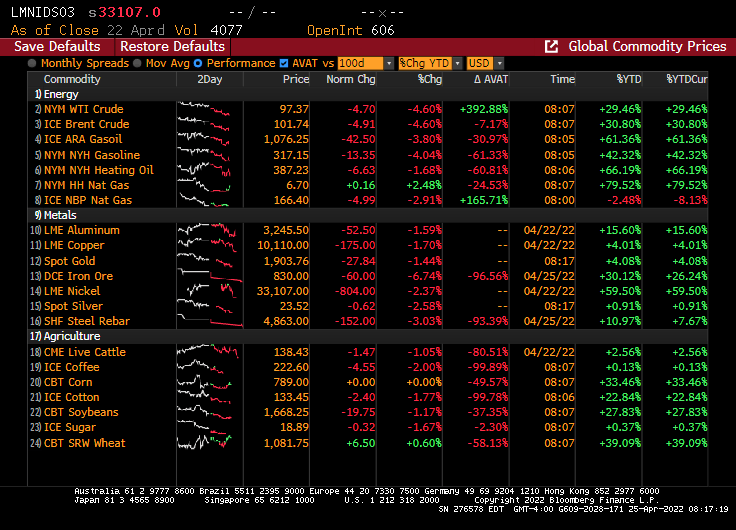
And commodities are tanking. WTI oil is down 5%, iron ore is down almost 7%.
And the Dow is diving with increased expectations of Fed monetary tightening, but the expectations (green line) have been declining this morning.
US President Biden went green and signed executive orders on his first day to limit oil and natural gas exploration of Federal lands and offshore (also, killed the Keystone Pipeline), helping to drive up energy prices and food prices. These orders begat inflation (also caused by the massive Covid relief by the Federal government). The highest inflation in 40 years begat The Federal Reserve signalling a tightening of Fed monetary policy … to fight the problem caused by The Fed in the first place … too much monetary stimulus for too long. Fiscal and monetary fanaticism and ignorance is forever busy and needs feeding
There was an interesting article on MarketWatch entitled “Bond rout exposes Social Security’s insanity.” The headline was “Every dollar of yours that’s invested in the Social Security trust fund is invested in low-yielding government bonds.”
Yes, another disastrous consequence of The Fed’s lax monetary policy since 2008, helping to push Treasury yields extremely low. And REAL Treasury yields into negative territory.
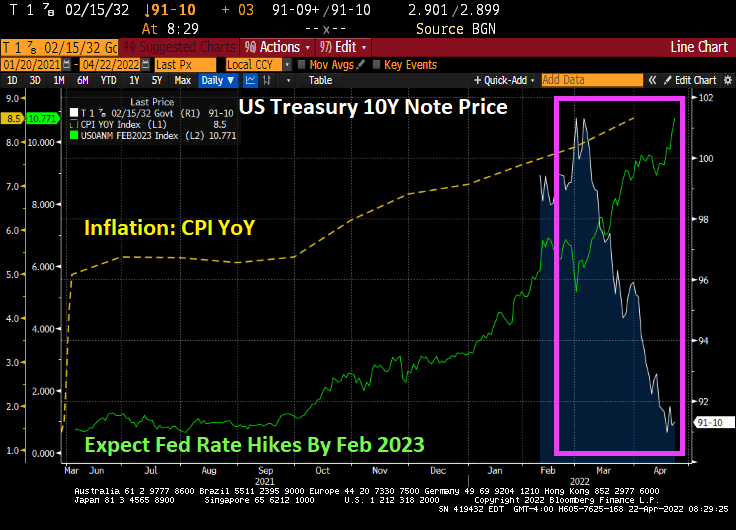
But here we sit today with The Fed threatening to trim their balance sheet and raise rates … to combat the inflation they helped create in the first place. Now we have the 10-year Treasury Note price falling like a paralyzed falcon with expected hate hikes going above rate hikes by February 2023 (based on Fed Funds Futures prices).
Most pension funds also invest heaving in US Treasuries, along with agency Mortgage-backed Securities (AgencyMBS).
Under President Biden’s Reign of Error, inflation is the highest in 40 years. But Powell and The Fed are still overstimulating the economy, and Congress is contributing to the inflation disaster with short-sighted political policies and spending (flooding the economy with stimulus spending helping to drive up prices). Even Democrat US Senator Elizabeth Warren gets it.
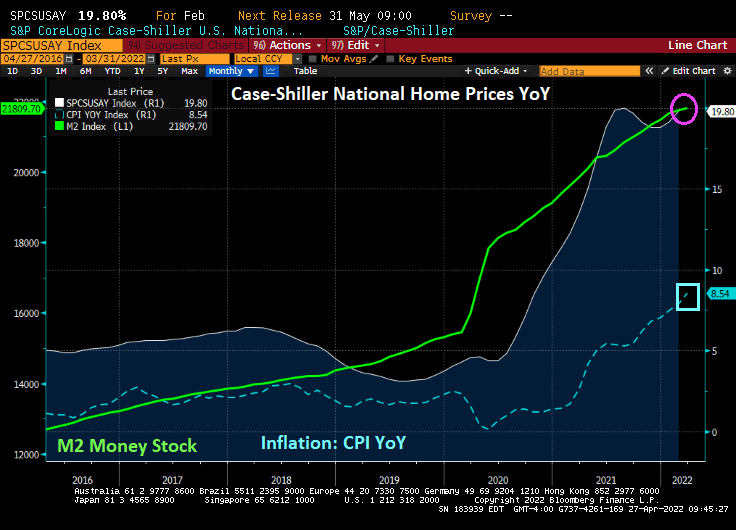
Here is Biden’s inflation scorecard in one chart. Under Inflation Joe, foodstuffs are up 58%, gasoline is up 72%, diesel fuel is up 154%, and green energy element Lithium is up 645% (no wonder electric car manufacturer Telsa is raising their prices 10%). Of course, The Federal Reserve keeps on expanding its balance sheet, UP 50.3% under Inflation Joe.
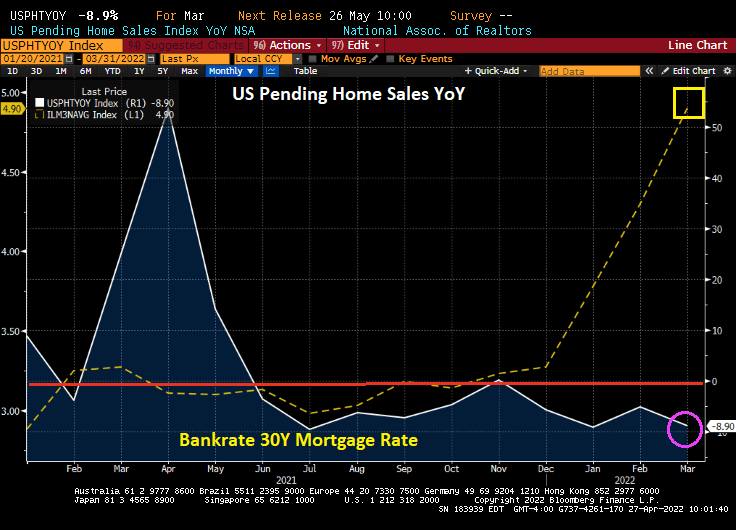
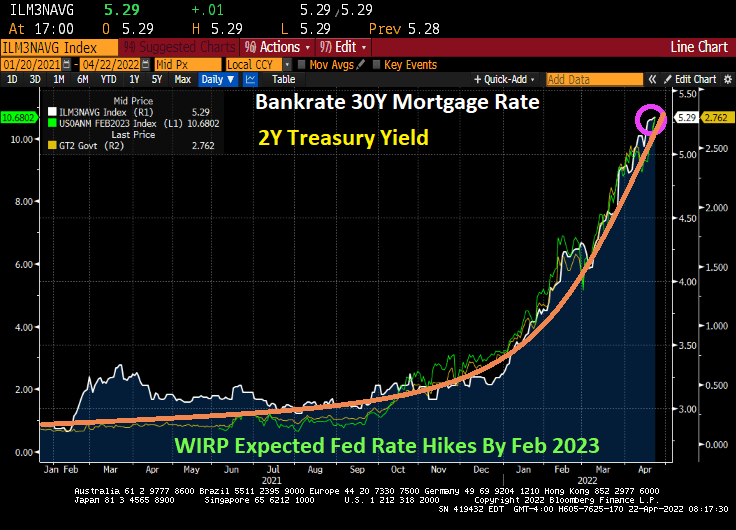
House price growth is up 69% and the 30-year mortgage rate is UP 83.3% and currently is at 5.28%. The orange line is the growth path.
Yes, prices have risen even more after Russia Invaded Ukraine on February 24, 2022. But most of the inflation was baked-in prior to the Russian invasion. Sorry Jen Psaki, but you are wrong about inflation being all Putin’s fault.
There is one song that sums up the mortgage banking industry with proposed tightening of Fed monetary stimulypto: T-R-O-U-B-L-E.
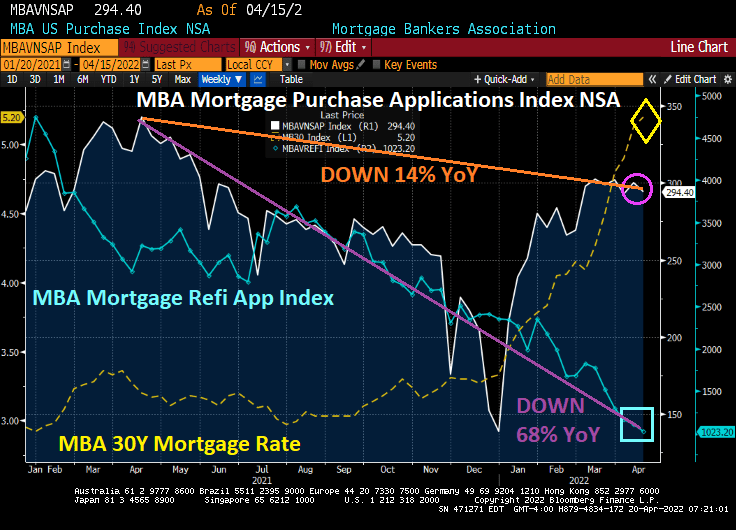
Mortgage applications decreased 5.0 percent from one week earlier, according to data from the Mortgage Bankers Association’s (MBA) Weekly Mortgage Applications Survey for the week ending April 15, 2022.
The Refinance Index decreased 8 percent from the previous week and was 68 percent lower than the same week one year ago. The seasonally adjusted Purchase Index decreased 3 percent from one week earlier. The unadjusted Purchase Index decreased 2 percent compared with the previous week and was 14 percent lower than the same week one year ago.
All together now, mortgage rates are up 76% under Biden.
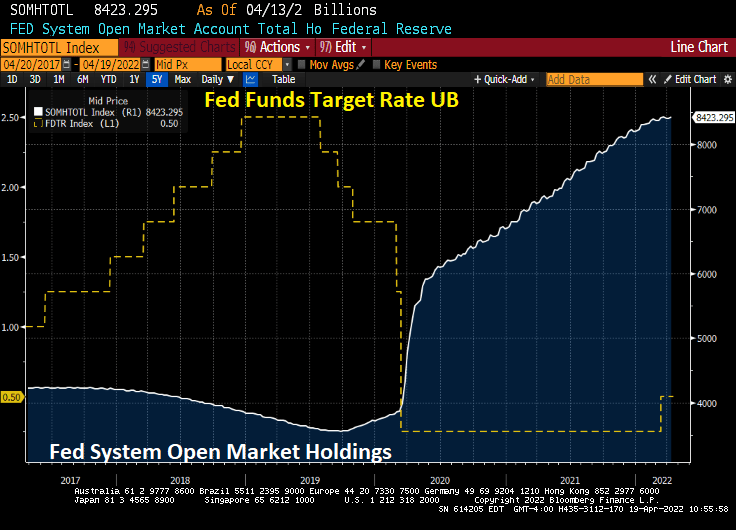
And yes, The Federal Reserve STILL has its enormous foot on the monetary gas pedal (with hints that they will remove it “soon.”
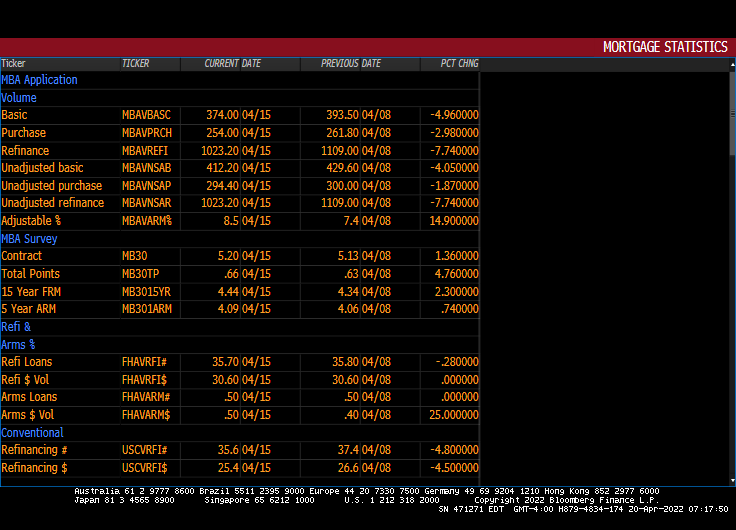
The number of ARMs increased 14.9% from the previous week.
We have Federal Reserve of St Louis President James “Bully” Bullard saying that The Fed could raise rates by 75 basis points in May, the Japanese Yen to Dollar is crashing as mortgage rates continue to soar.
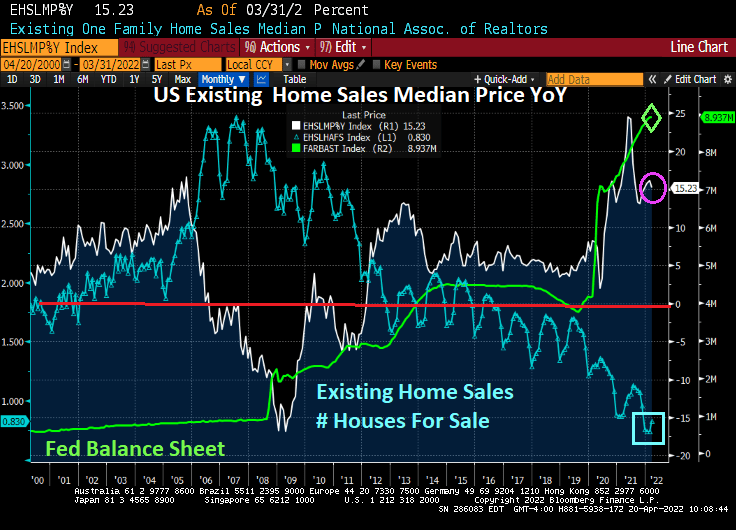
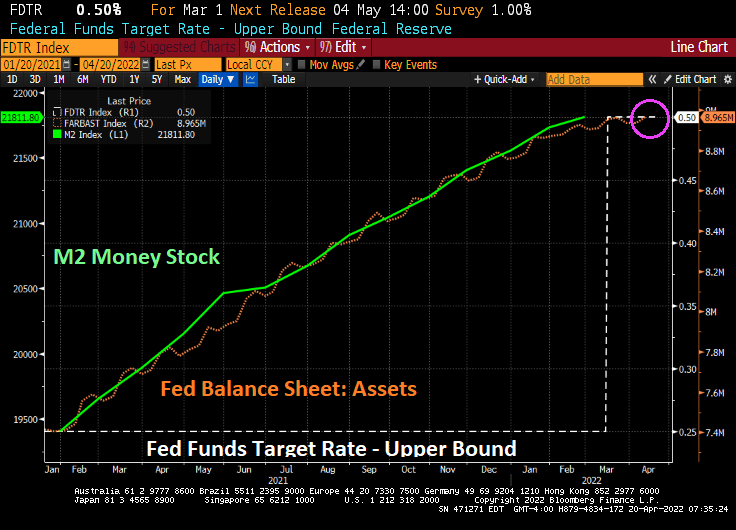
Here is a nice summary of The Fed’s massive balance sheet expansion in reaction to Covid (orange line) and the resulting soaring of home prices. Then The Fed signals that they will remove the “punchbowl” and mortgage rates have boomed. And not in a good day.
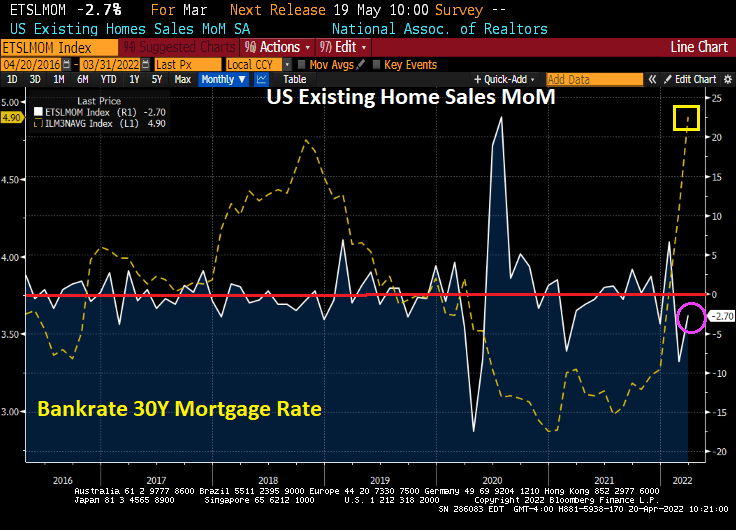
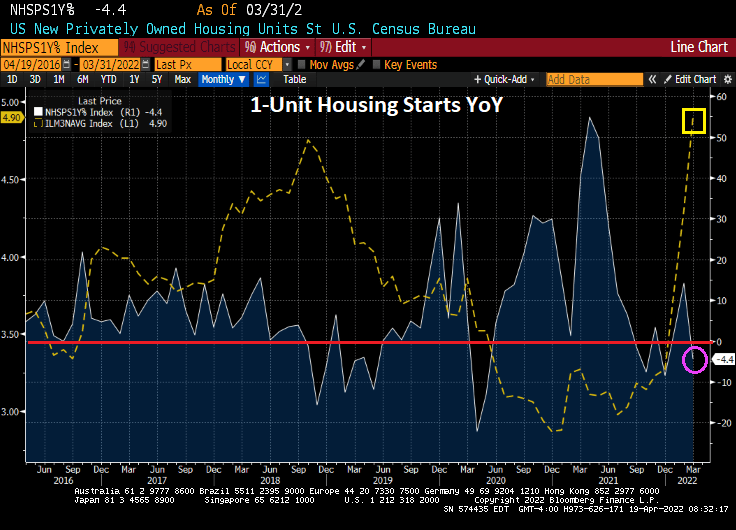
Today we have the US housing starts report. In a nutshell, 1-unit housing starts (single-family detached) declined -4.4% YoY as mortgage rates skyrocket.
5+ unit (aka, apartment stats rose 7.49% MoM in March while 1-unit starts declined by -1.72% MoM. 1-unit permits fell by -4.81% MoM while 5+ units starts rose by 10.89% MoM.
Soaring home prices coupled with soaring mortgage rates equals … apartment living.
Bear in mind that The Fed STILL have massive monetary stimulypto outstanding!!
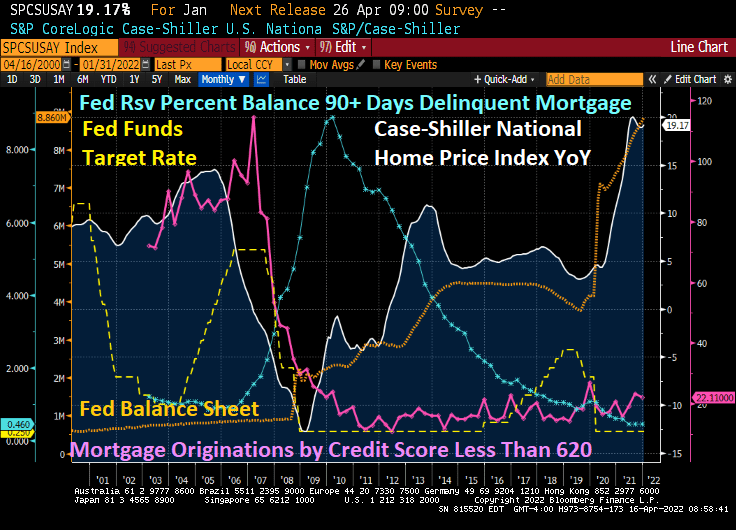
The book and movie “The Big Short” revolved around the 2005-2007 housing bubble driven by lending to borrowers with subprime credit (and little or no underwriting). As we know, Bear Stearns, Lehman Brothers and other investment banks too large positions in subprime asset-backed securities (SABS) that became highly toxic once the demand for high-yield subprime ABS dried up. The decline in US home prices coupled with soaring 90-day mortgage delinquencies led to the failure of Bear Stearns and Lehman Brothers along with Fannie Mae and Freddie Mac being put into conservatorship by their regulator.
Fast forward to today. Mortgage originations by credit scores of 620 or less have shriveled while home price growth YoY is even higher than the subprime mortgage crisis of 2005-2007. So, is the US facing another “Big Short” scenario? Yes and no.
The answer is no in that lenders have tightened their credit box sufficiently so that investment banks are no longer buying large quantities of subprime credit paper. The answer is yes if we consider that the current housing bubble is fueled by extraordinary monetary stimulus due to Covid (as well as rampant Federal government stimulus spending).
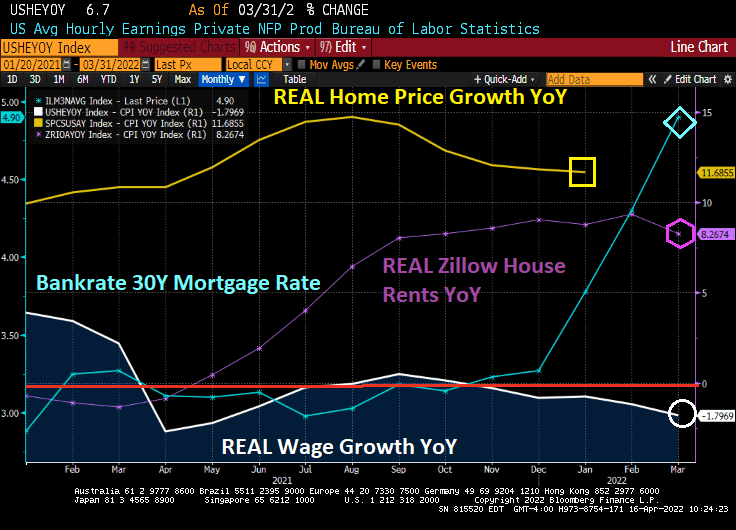
Following the Federal Reserve of Dallas’ lead, here is a chart of REAL home price growth YoY against REAL average hourly earnings YoY. I added REAL Zillow house rents YoY as well.
Look at the affordability gap during the Subprime Bubble of 2004-2006 and then the Fed Bubble of 2020 to today. Both bubbles show a disconnect between REAL home prices and REAL wages. REAL Zillow home rents are not as high as REAL home price growth, but still how a huge gap in rent affordability.
So, what can upset the apple cart? How about Jay and The Gang jacking up mortgage rates making home affordability even worse (unless it slows home price growth).
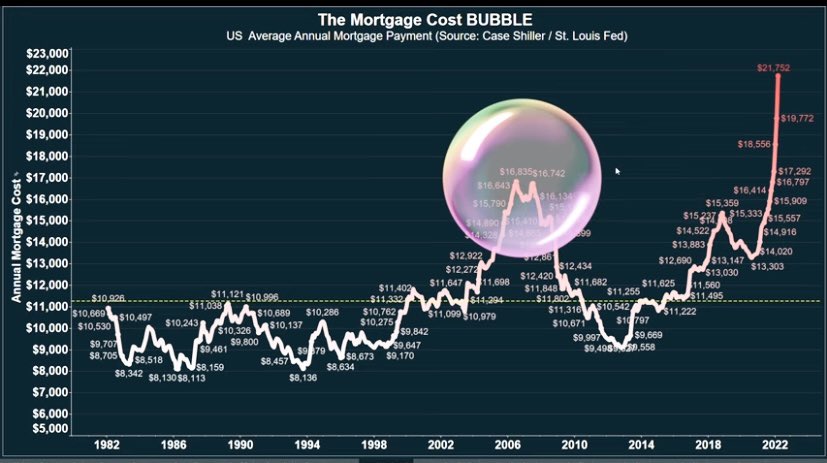
Thanks to The Fed’s propose quantitative tightening, mortgage rates are soaring and mortgage costs along with them. Mortgage costs, thanks to The Fed driving up housing prices AND mortgage rates, are substantially higher than during the subprime mortgage housing bubble.
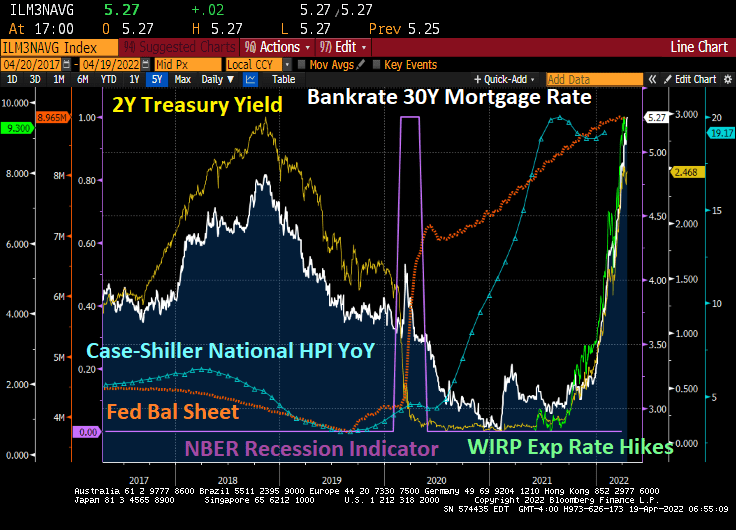
The Fed’s whipsaw approach helped crash home prices during the subprime mortgage crisis by dropping rates too fast at first (helping to ignite a housing bubble) then raising rates too fast (helping to crash housing prices).
WASHINGTON (AP) — Long-term U.S. mortgage rates continued to climb this week as the key 30-year loan rate reached 5% for the first time in more than a decade amid persistent high inflation.
The average 5% rate on the 30-year mortgage was up from 4.72% last week, mortgage buyer Freddie Mac reported Thursday. The average rates in recent months have been showing the fastest pace of increases since 1994. By contrast, a year ago the 30-year rate stood at 3.04%.
The average rate on 15-year, fixed-rate mortgages, popular among those refinancing their homes, jumped to 4.17% from 3.91% last week.
Yet The Federal Reserve’s balance sheet keeps on growing.
Today, the US Treasury 10-year yield exploded upwards by over 12 basis points. With it, the 30-year mortgage yield is above 5%. And MBA Mortgage Purchase Applications are actually increasing.


You must be logged in to post a comment.