Stop! Stop! Stop! US Public Debt Will Reach $60 Trillion By End Of 10-year Budget Window

Stop! Stop! Stop! … all the printing!

These people have to be stopped!

We are talking about the nation’s unhinged monetary politburo domiciled in the Eccles Building (The Federal Reserve), of course. It is bad enough that their relentless inflation of financial assets has showered the 1% with untold trillions of windfall gains, but their ultimate crime is that they lured the nation’s elected politician into a veritable fiscal trance. Consequently, future generations will be lugging the service costs on insuperable public debts for years to come.

For more than two decades these foolish PhDs and monetary apparatchiks drove the entire Treasury yield curve to rock bottom, even as public debt erupted skyward. In this context, the single biggest chunk of the Treasury debt lies in the 90-day T-bill sector, but between December 2007 and June 2023 the inflation-adjusted yield on this workhorse debt security was negative 95% of the time.

That’s right. During that 187-month span, the interest rate exceeded the running (LTM) inflation rate during only nine months, as depicted by the purple area picking above the zero bound in the chart, and even then by just a tad. All the rest of the time, Uncle Sam was happily taxing the inflationary rise in nominal incomes, even as his debt service payments were dramatically lagging the 78% rise of CPI during that period.

Inflation-Adjusted Yield On 90-Day T-bills, 2007 to 2022

The above was the fiscal equivalent of Novocain. It enabled the elected politicians to merrily jig up and down Pennsylvania Avenue and stroll the K-Street corridors dispensing bountiful goodies left and right, while experiencing nary a moment of pain from the massive debt burden they were piling on the main street economy.

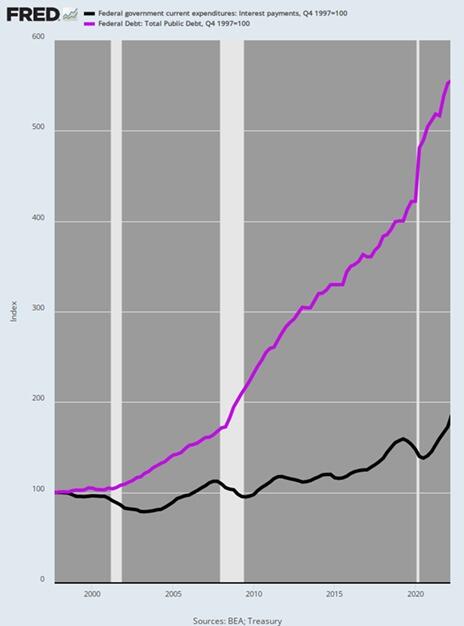
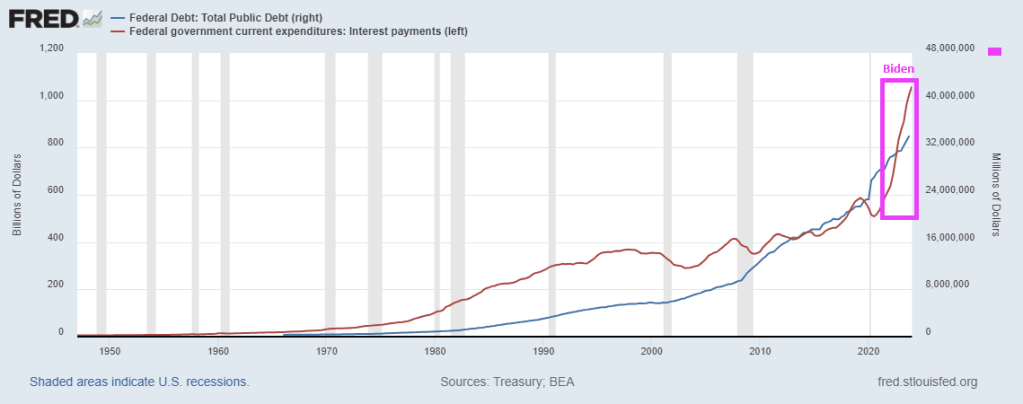
Accordingly, during the quarter-century between Q4 1997 and Q1 2022 the public debt soared from $5.5 trillion to $30.4 trillion or by 453%. In any rational world a commensurate rise in Federal interest expense would have surely awakened at least some of the revilers.

But not in Fed World. As it happened, Uncle Sam’s interest expense only increased by 73%, rising from $368 billion to $635 billion per year during the same period.  By contrast, had interest rates remained at the not unreasonable levels posted in late 1997, the interest expense level by Q1 2022, when the Fed finally awakened to the inflationary monster it had fostered, would have been $2.03 trillion per annum.

In short, the Fed reckless and relentless repression of interest rates during that quarter century fostered an elephant in the room that was one for the ages. Annualized Federal interest expense was fully $1.3 trillion lower than would have been the case at the yield curve in place in Q4 1997.

Alas, the missing interest expense amounted to the equivalent of the entire social security budget!

So, we’d guess the politicians might have been aroused from their slumber had interest expense reflected market rates. Instead, they were actually getting dreadfully wrong price signals and the present fiscal catastrophe is the consequence.

Index Of Public Debt Versus Federal Interest Expense, Q4 1997-Q1 2022

Needless to say, the US economy was not wallowing in failure or under-performance at the rates which prevailed in 1997. In fact, during that year real GDP growth was +4.5%, inflation posted at just 1.7%, real median family income rose by 3.2%, job growth was 2.8% and the real interest rates on the 10-year UST was +4.0%

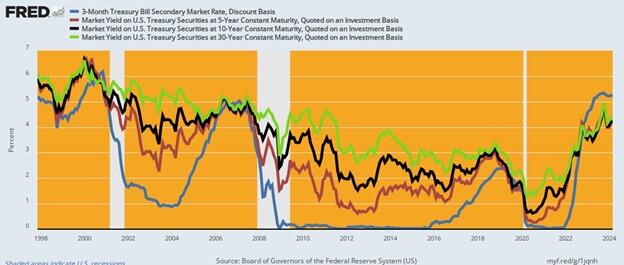
In short, 1997 generated one of the strongest macroeconomic performances in recent decades—even with inflation-adjusted yields on the 10-year UST of +4.0%. So there was no compelling reason for a massive compression of interest rates, but that is exactly what the Fed engineered over the next two decades. As shown in the graph below, rates were systematically pushed lower by 300 to 500 basis points across the curve by the bottom in 2020-2021.

Current yields are higher by 300 to 400 basis points from this recent bottom, but here’s the thing: They are only back to nominal levels prevalent at the beginning of the period in 1997, even as inflation is running at 3-4% Y/Y increases, or double the levels of 1997.

US Treasury Yields, 1997 to 2024

Unfortunately, even as the Fed has tepidly moved toward normalization of yields as shown in the graph above, Wall Street is bringing unrelenting pressure for a new round of rates cuts, which would result in yet another spree of the deep interest rate repression and distortion that has fueled Washington’s fiscal binge since the turn of the century.

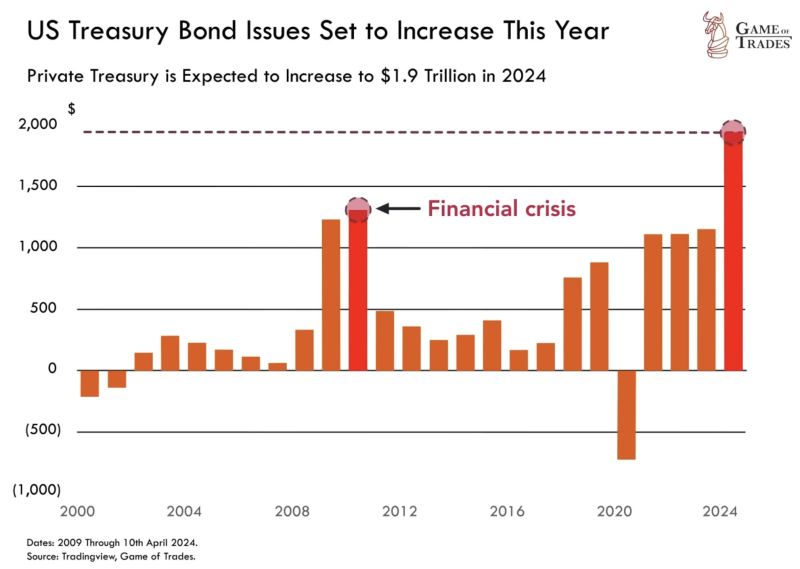
As it is, the public debt is already growing at an accelerating clip, even before the US economy succumbs to the recession that is now gathering force. And we do mean accelerating. The public debt has recently been increasing by $1 trillion every 100 days. That’s $10 billion per day, $416 million per hour.

In fact, Uncle Sam’s debt has risen by $470 billion in the first two months of this year to $34.5 trillion and is on pace to surpass $35 trillion in a little over a month, $37 trillion well before year’s end, and $40 trillion some time in 2025. That’s about two years ahead of the current CBO (Congressional Budget Office) forecast.

On the current path, moreover, the public debt will reach $60 trillion by the end of the 10-year budget window. But even that depends upon the CBO’s latest iteration of Rosy Scenario, which envisions no recession ever again, just 2% inflation as far as the eye can see and real interest rates of barely 1%. And that’s to say nothing of the trillions in phony spending cuts and out-year tax increases that are built into the CBO baseline but which Congress will never actually allow to materialize.

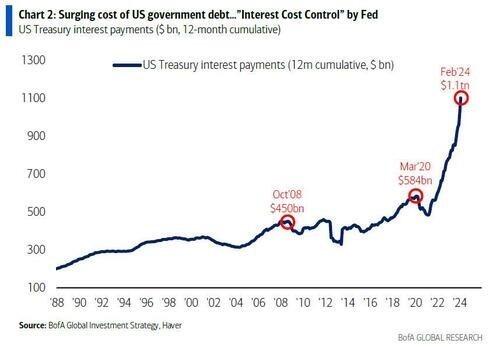
What is worse, even with partial normalization of rates, a veritable tsunami of Federal interest expense is now gathering steam. That is because the ultra-low yields of 2007 to 2022 are now rolling over into the current market rates shown above—at the same time that the amount of public debt outstanding is heading skyward. As a result, the annualized run rate of Federal interest expense hit $1.1 trillion in February and is heading for $1.6 trillion by the end of the current fiscal year in September.

Finally, even as the run-rate of interest expense has been soaring, the bureaucrats at the US Treasury have been drastically shortening the maturity of the outstanding debt, as it rolls over. Accordingly, more than $21 trillion of Treasury paper has been refinanced in the under one-year T-bill market, thereby lowering the weighted-average maturity of the public debt to less than five- years.

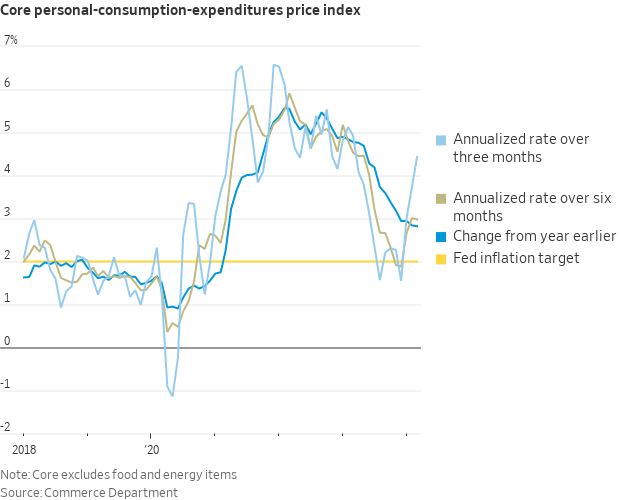
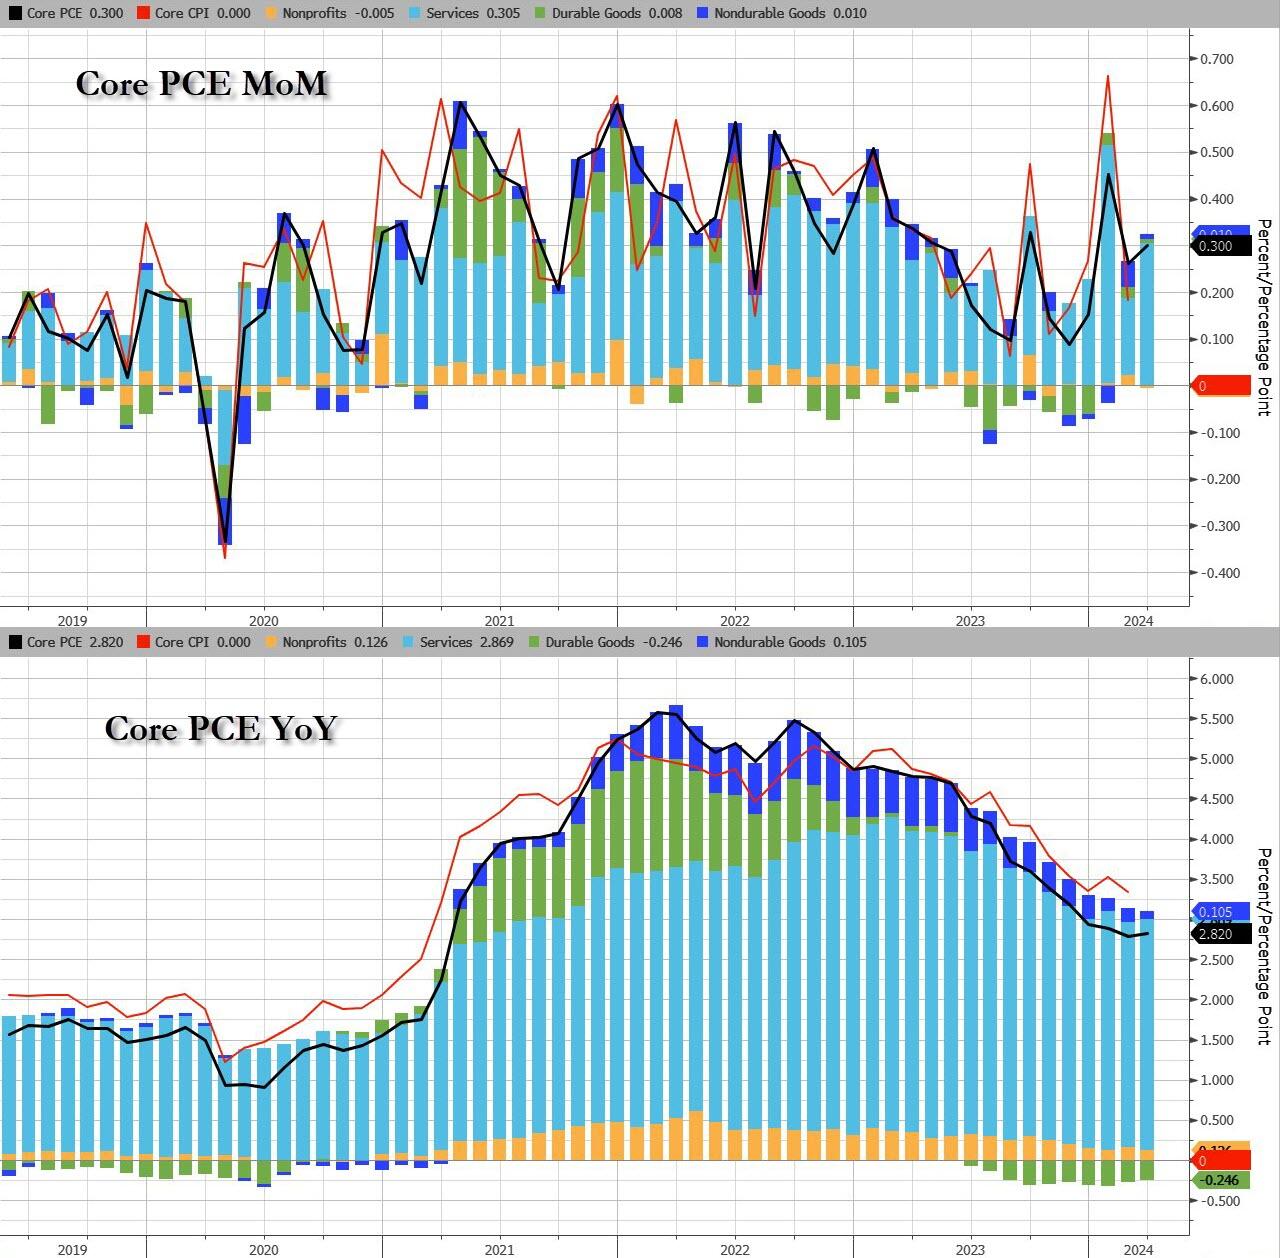
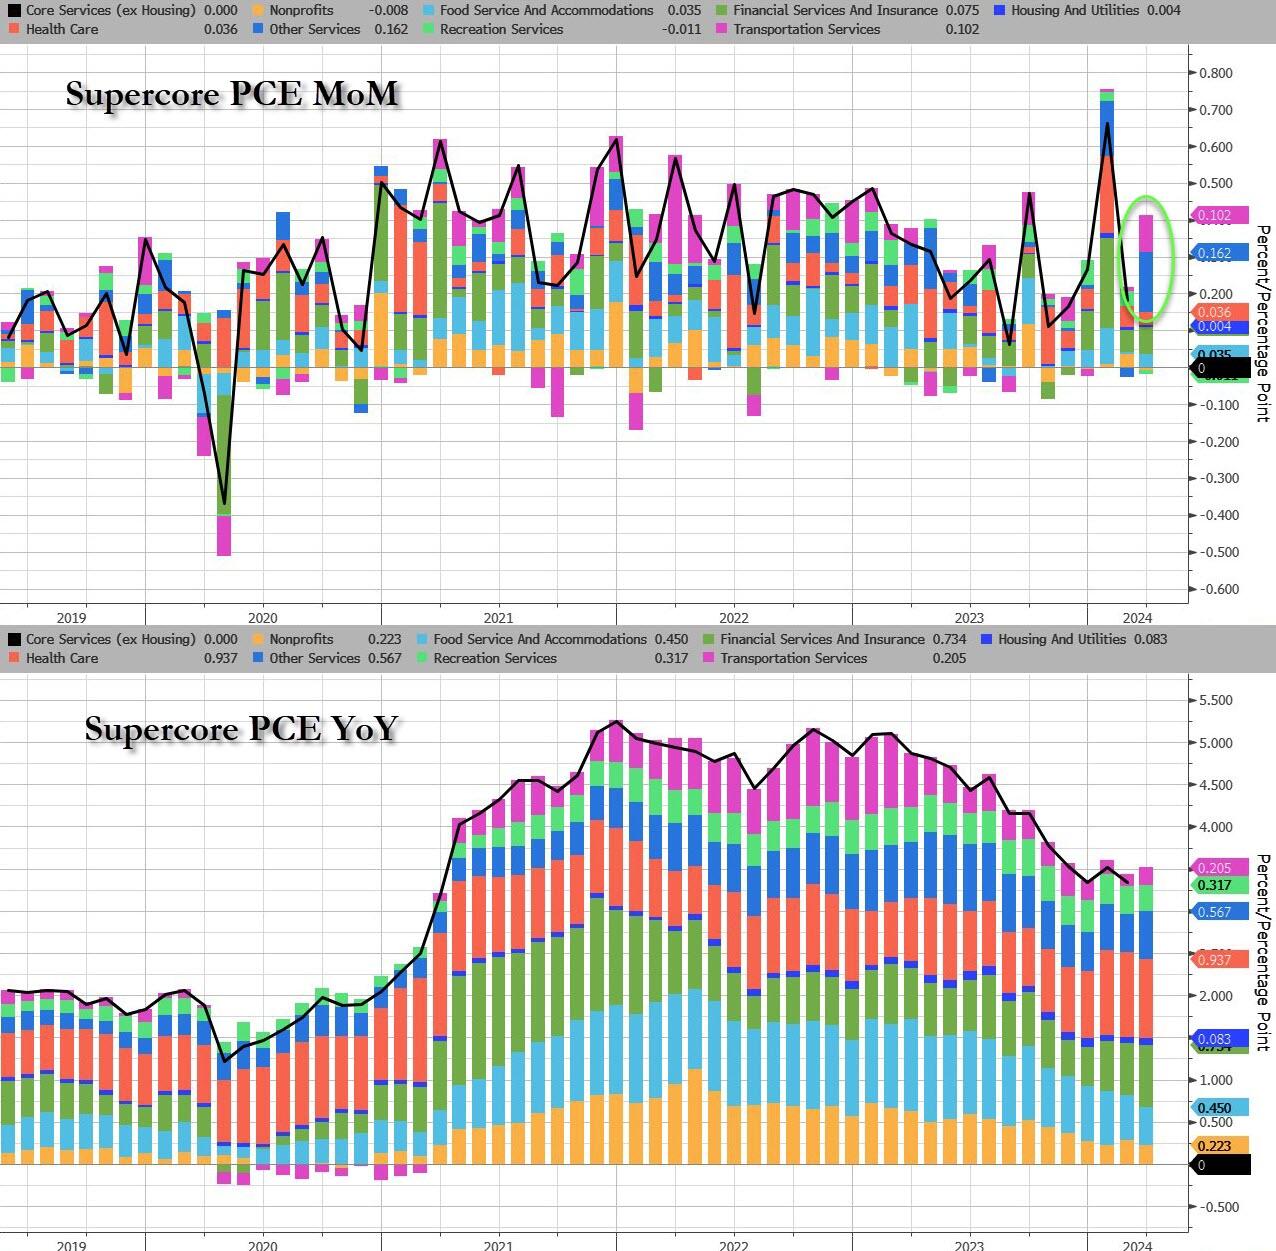
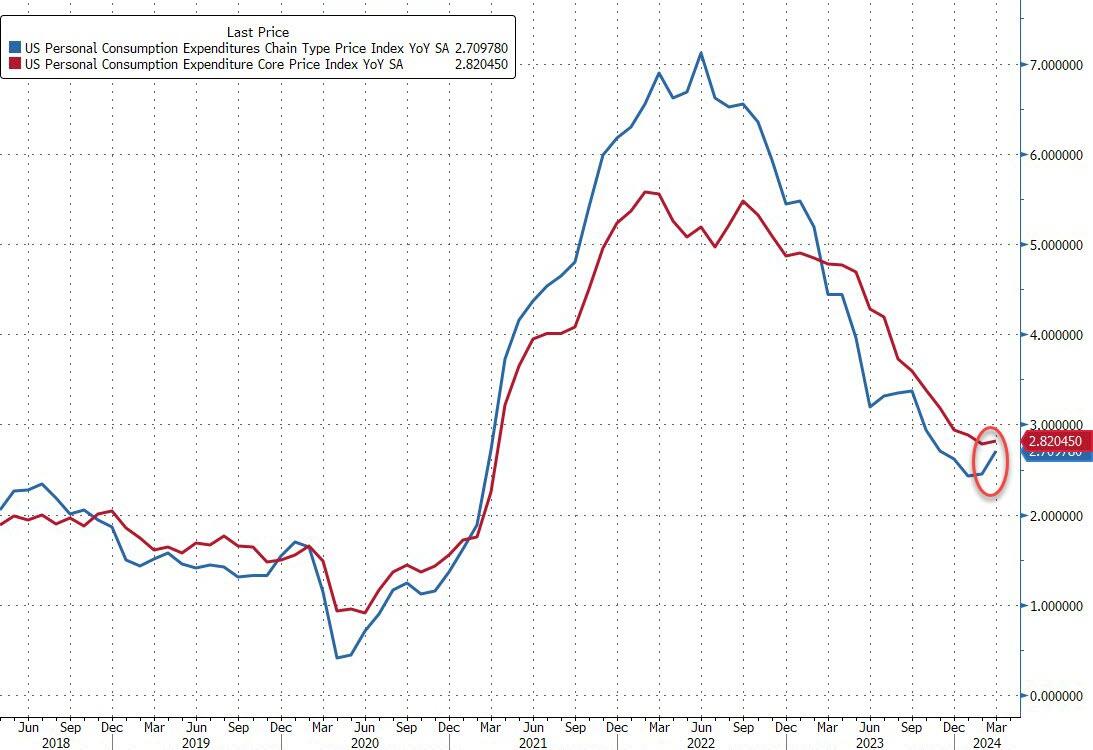
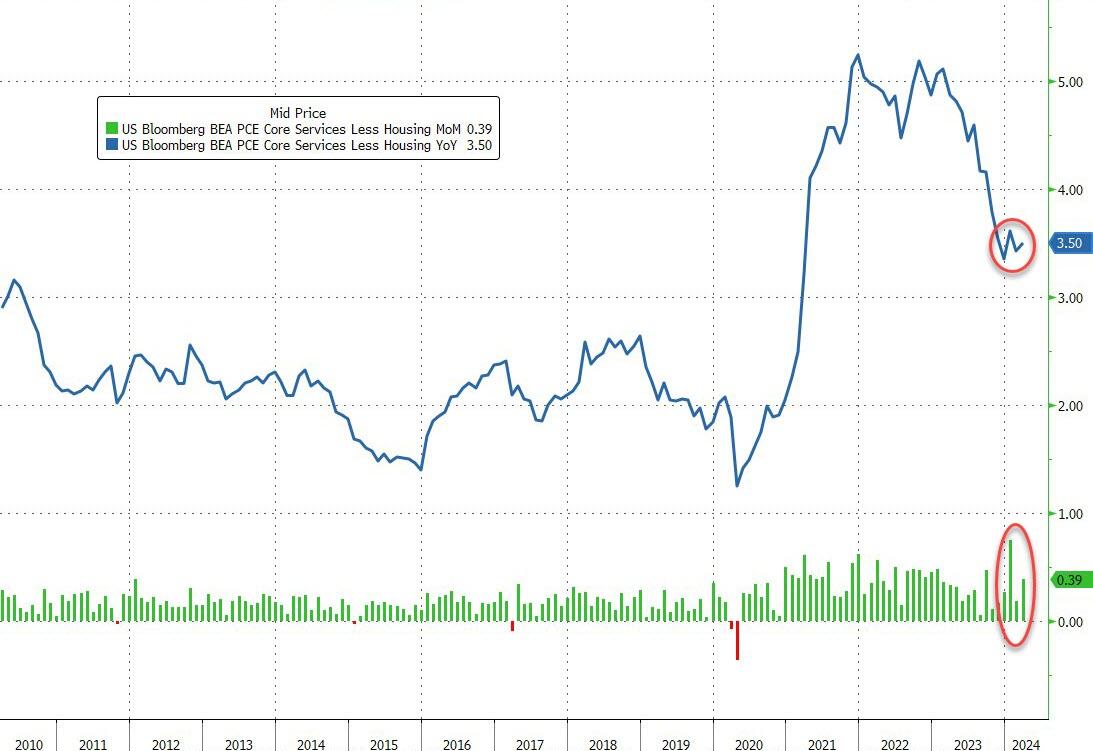
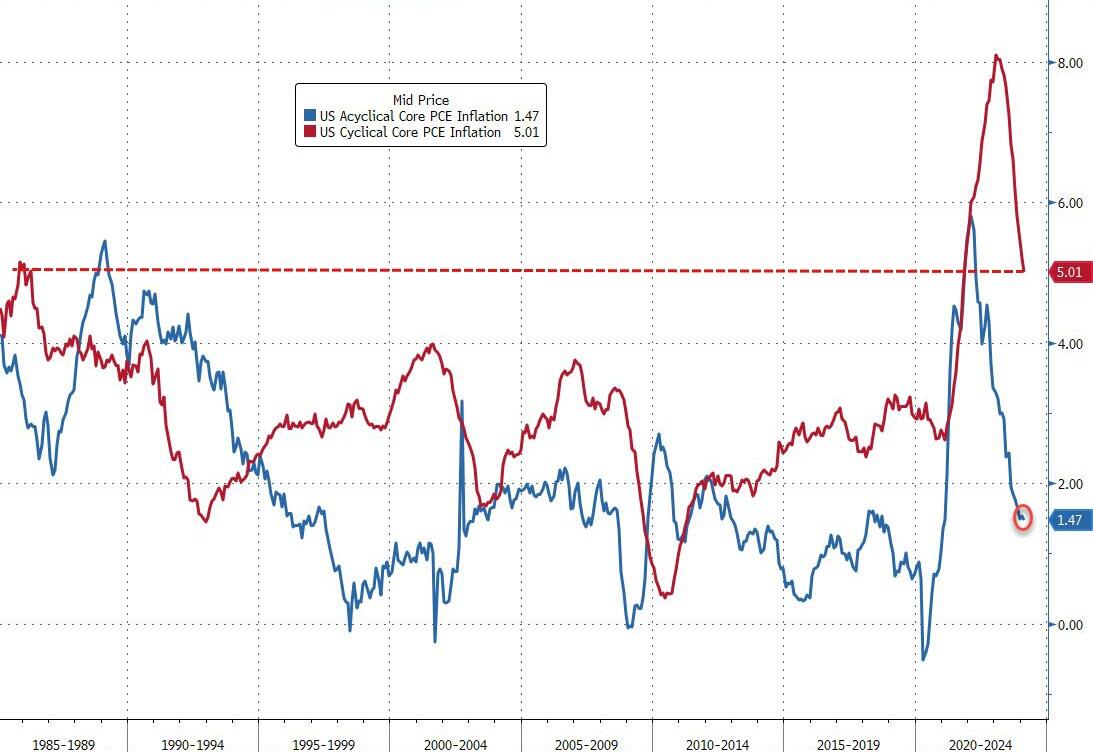
The apparent bet is that the Fed will be cutting rates soon. As is becoming more apparent by the day, however, that’s just not in the cards: No matter how you slice it, the running level of inflation has remained exceedingly sticky and shows no signs of dropping below its current 3-4% range any time soon.

What is also becoming more apparent by the day is that the money-printers at the Fed have led Washington into a massive fiscal calamity. It is only a matter of time, therefore, until the excrement hits the fan like never before.

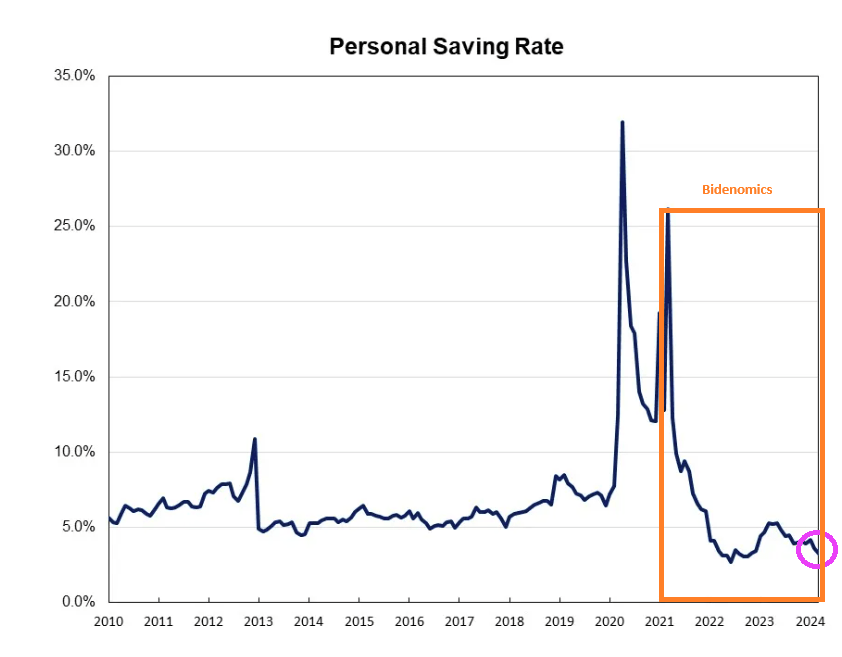
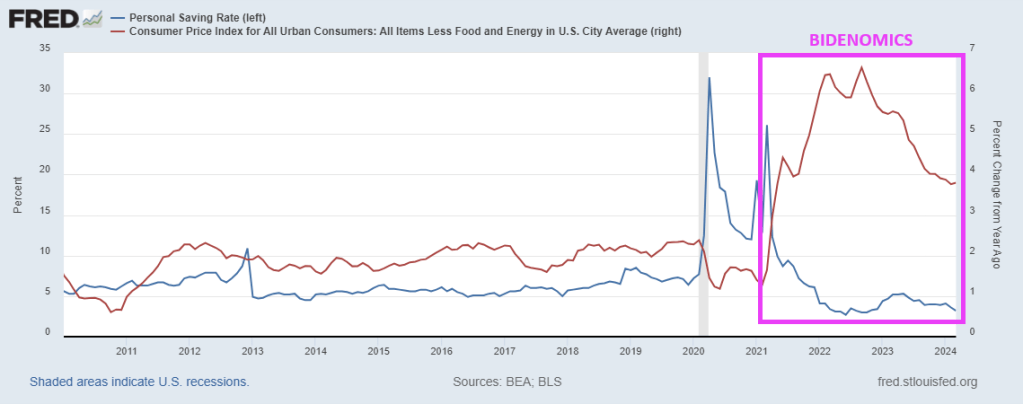
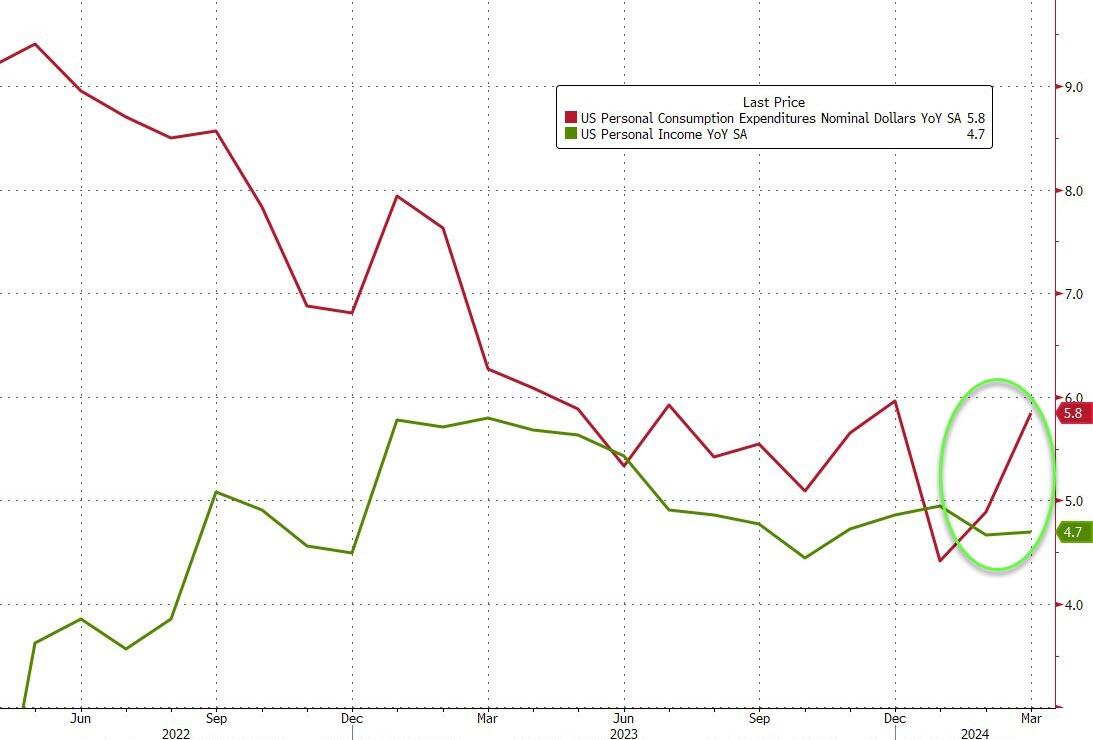
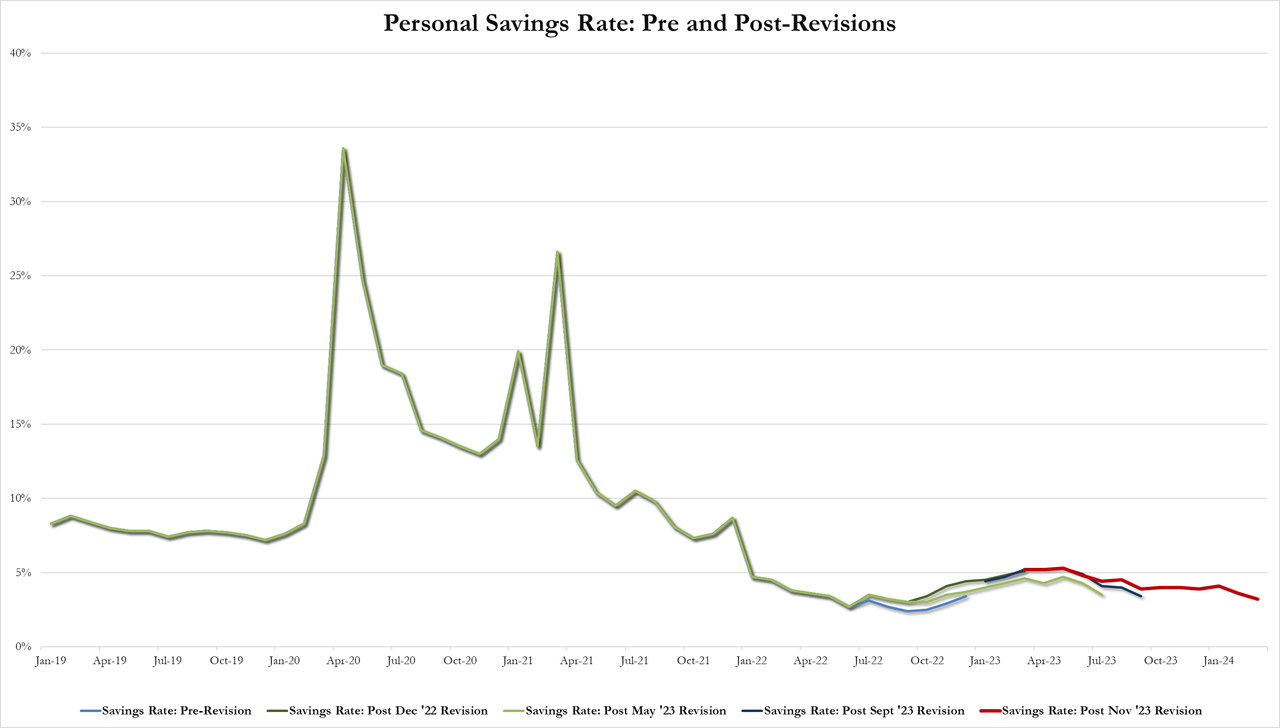
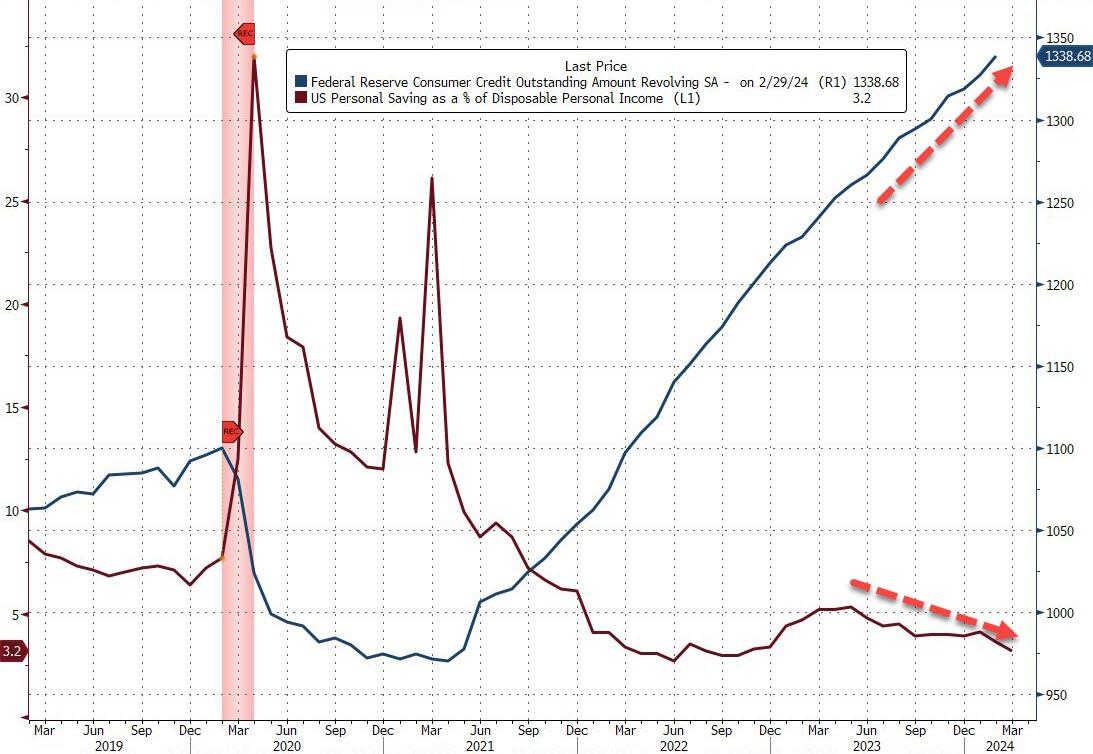
And with Bidenomics killing off household excess savings, we won’t be going down to the nightclub anymore.

Surprise! Citi Economic Surprise Index Crashes To -7.30 (Home Prices UP 32% Under Biden, Mortgage Rates UP 160%)

Surprise! Just in time for the November election, this is a negative surprise that Biden doesn’t want to hear.

The Citi Economic Surprise index crashed to -7.30, the lowest since January 2023.

Under Biden’s leadership (hell, he and his family already own several mansions … on a Senator’s pay), home prices are up 32% under Biden and mortgage rates are up a staggering 160%.

Getting young households who rent to buy a home in this environment will require magic.

Biden’s Misrepresentation On Trump Tax Cuts, Someone Who Is Married With Two Kids Making $85,000 Will Pay $1,700 More In Taxes (Inflation Tax Is 166% Higher Than Under Trump)

I doubt if Biden really understands what he is saying. He simply reads (badly) off a teleprompter.

Biden has repeatedly claimed that no new taxes on anyone making less than $400,000. Remember, he has repeatedly said “You have my word as a Biden.” Which is worthless, by the way.

There are TWO taxes that are hitting people making under $400,000 per year. First, the INFLATION tax coming from Biden’s/Congresses spending binge, The Fed printing gobs of money, and insane regulations.

Biden and his mouthpieces like Karine Jean Pierre (KJP) claim that Biden inherited inflation from Trump. FALSE. Inflation was only 1.3% YoY in December 2020. Inflation was 3.5% YoY in March 2024, an increase of 166% over Trump’s final month in office. THAT is one heck of an inflation tax.

In House testimony, Treasury Secretary Janet Yellen (falsely) claimed that Biden’s massive tax increase won’t hit middle class households. That is a plain lie. the Tax Foundation said that someone who’s married, two kids, making $85,000 would pay $1,700 more in taxes. A married couple with two children making $165,000 annually would pay $2,450.50 more than in the previous year, while a family with three kids pulling in $200,000 per year will shell out almost $7,500 more per year.

So much for Biden’s “No one making under $400,000 will pay and additional penny of tax.” Between the inflation tax and Biden letting Trump’s Tax Cuts and Jobs Act’s (TCJA) expire, people making under $400,000 per year will get scalded. All so Biden/Congress can keep spending on Ukraine, fund endless wars, and buy countries cooperation with the US.

Janet Yellen Says It’s ‘Almost Impossible’ For First-Time Homebuyers To Enter Housing Market (Blames Rates Being Too Low That Households Locked-in Rates)

Treasury Secretary Janet Yellen told the House Ways and Means Committee that housing is impossible for first-time homebuyers. But doesn’t bother to confess that she is partly responsible because of her “too low for too long” Fed policies under Obama/Biden.

Yellen: Mortgage rates have been so low for so long that it’s created a lock-in effect where people don’t want to sell their homes to buy new ones for fear of losing their attractive rates.

That’s made it “almost impossible” for first-time homebuyers to enter the housing market, U.S. Treasury Secretary Janet Yellen said during her testimony before the House Ways and Means Committee.

Now hold on a minute, Janet. YOU were the one that kept rates too low for too long as Federal Reserve Chair.

Janet L. Yellen took office as chair of the Board of Governors of the Federal Reserve System in February 2014, for a four-year term ending February 3, 2018. She was succeeded by Jerome Powell.

What was her record on mortgage rates? Yellen kept the Fed target rate (upper bound) at 25 basis points under Obama/Biden until December 2015, so only one rate hike under Obama/Biden. Then came the election of Donald Trump in November 2016. Then Yellen raised The Fed target rate 4 times after Trump was elected.

Mortgage rates fell to 3.78% by November 2017, so Yellen helped keep mortgage rates low. But mortgage rates soared after Trump’s election to 4.22% by the end of her term.

There are other reasons why first-time homeownership is so difficult, like local NIMBY (not in my back yard) policies and the absolutely lousy labor market.

She added that Biden’s massive tax increase won’t hit middle class households (other than the massive INFLATION tax that was levied by Biden). That is a plain lie. the Tax Foundation says that someone who’s married, two kids, making $85,000 would pay $1,700 more in taxes. A married couple with two children making $165,000 annually would pay $2,450.50 more than in the previous year, while a family with three kids pulling in $200,000 per year will shell out almost $7,500 more per year.

So much for Biden’s “No one making under $400,000 will pay and additional penny of tax.”

Simply Unaffordable! Mortgage Demand (Purchase Applications) Fall 14% Compared To One Year Ago While HUD Energy Rules Will Add Up To $31,000 To New Home Prices (Payback Time Is 90 Years)

Housing in the US is simply unaffordable, particularly after HUD levied new regulation rising the cost of new housing up to $31,000. Wait for this to kick into the data for mortgage demand!

Mortgage applications decreased 2.3 percent from one week earlier, according to data from the Mortgage Bankers Association’s (MBA) Weekly Mortgage Applications Survey for the week ending April 26, 2024.

The Market Composite Index, a measure of mortgage loan application volume, decreased 2.3 percent on a seasonally adjusted basis from one week earlier. On an unadjusted basis, the Index decreased 1.4 percent compared with the previous week. The seasonally adjusted Purchase Index decreased 2 percent from one week earlier. The unadjusted Purchase Index decreased 1 percent compared with the previous week and was 14 percent lower than the same week one year ago.

The Refinance Index decreased 3 percent from the previous week and was 1 percent lower than the same week one year ago. 

MBS returns are weak and volatile.

How is the Biden Regime making homeownership more affordable? They aren’t. The are using regulations, to drive the cost of new housing way up. New HUD energy rules will raise the cost of home construction by imposing stricter building codes. The National Association of Home Builders says the energy rules can add as much as $31,000 to the price of a new home. Payback time is 90 years (how long it will take the recoup the initial investment).

Under Biden’s “leadership” we are all addicted to gov. But at least Ukraine and Zelenskyy will be getting a guaranteed 10 years of financial support from the US … while E Palestine Ohio and Maui remain destroyed.

Keep On Printing! Home Prices Continue To Soar, Case-Shiller National Index UP 6.4% YoY In February

Janet Yellen, world class propagandist (US version of Baghdad Bob) and US Treasury Secretary under Biden, was so wrong about inflation. Instead of being “transitory”, turns out to be seemingly permanent.

Today’s Case-Shiller home price report was released for February. The National Home Price index was up 6.4% year-over-year. But look at the explosion of M2 Money and home prices. Hmm.

If we look at home prices and M2 Money on a year-over-year (YoY) basis, we can see the surge in money printing with COVID and the corresponding surge in home prices. As M2 Money growth slowed, the Case-Shiller National HPI slowed as well … until The Fed slowed the declined in M2 Money growth resulting in rising home price growth again.

So, The Fed will likely have to keep on printing. You can see Janet Yellen dancing to the thought of printing more money.

Tumbling Markets! Q1 Employment Cost Index Saw Biggest QoQ Jump Most In A Year (Stocks Decline, Treasury Yields Rise)

The Biden regime highlights the problem of politicians running the economy. Call it “Tumbling Markets.”

Highlighting just how sensitive the market is to any ‘inflation/deflation’ narrative questions, the Q1 Employment Cost Index (ECI) – a data point that is typically of secondary import – printed hotter than expected this morning and sent markets reeling.

The ECI rose from +0.9% QoQ in Q4 to +1.2% QoQ in Q1 (well above the +1.0% QoQ expected). That is the biggest QoQ jump in a year…

That was higher than the highest forecast…

Which leaves the civilian worker ECI up 4.2% YoY, stalling the disinflationary path it had been on…

In other words, persistent wage pressures are keeping inflation elevated.

This sent stocks tumbling lower…

…and Treasury yields higher…

Just add this data point to the ‘the disinflation narrative is dead’ side of the ledger.

US Treasury Bond Issue Set To Increase To $1.9 Trillion In 2024 As Personal Saving Rate Crashes To Near Low Since 2010 (Goverment Displacing Households)

Joe Biden could barely eat his dinner at the White House Correspondents’ Dinner. And we think he is calling the shots in The White House?? Oh well. Perhaps it is Treasury Secretary Janet Yellen or Klaus Schwab of the World Economic Forum.

In any case, Treasury bond issuance in 2024 is expected to hit $1.9 TRILLION. Surpassing levels seen even during the 2008 financial crisis.

And with inflation, the US personal saving rate is near the lowest level since Obama (2010).

And with the core inflation rate still higher than anytime since 2010, households are paying more for … everything depleting their savings.

With Biden and Congress spending like drunken sailors on shore leave, and no end in sight, this will eventually explode. Ukraine, foreign aid, no border security, virtually no money for Maui fire, E. Palestine Ohio is still a wreck, etc. They always have money for someone else. And if Trump is elected in November, watch CNN and MSNBC and Biden/Congress blame Trump.

Commodities are a way to protect yourself against the government and their insane spending and debt.

My point? Gold keeps rising!

The leading foreign holder of US debt is Japan, which is following the insane path as the US and resembles a banana republic.

Former Fed chair under Obama and current Treasury Secretary Janet Yellen under Biden is Doctor Wonderful. NOT!!

I don’t know what Biden thinks is so funny. Maybe it is because House “Majority” Leader Mike Johnson (RINO-LA) gave Biden and Schumer everything they wanted (Ukraine, Israel funding but nada for security our borders). Life is good when you are stupid and mean-spiritied like Joe Biden!

Biden is so vain: capped teeth, hair plugs, constant tan, face lifts, etc.

Out Of Control! US Public Debt UP 25% Under “Robo Joe” Biden While Interest On US Debt Is UP Over 105% (Unfunded Entitlements Reach $215 TRILLION)

The US debt and Federal spending is out of control. As is entitlement spending.

In 2007, the U.S. national debt was below $10 trillion, and the budget deficit was about $160 billion. Federal spending was about $3 trillion, and interest payments were approximately $400 billion.

Then the numbers spiraled out of control. Yet Biden/Congress keep shoveling money to Ukraine and leave our borders unsecured.

Washington’s fiscal situation has drastically changed since then; total debt has surpassed $34 trillion, the annual budget shortfall exceeds $1 trillion, and interest costs have topped $1 trillion.

David Walker, the former comptroller general of the United States and a Main Street Economics advisory board member, is unsurprised.

Seventeen years ago, Mr. Walker rang fiscal alarm bells. Like Ross Perot before him, he took his case to the American people and delivered the cold, hard truth: The government’s books are unsustainable, and interest charges on the mounting debt will swallow a significant portion of federal revenues.

During this time, the former head of the Government Accountability Office (GAO) appeared on a widely viewed episode of “60 Minutes,” toured the country to spotlight worrisome trends in the U.S. government’s budget (he did this again in 2012), and attempted to convince lawmakers of the unsustainable fiscal path.

He also penned a 2009 book titled “Comeback America: Turning the Country Around and Restoring Fiscal Responsibility.”

Given the treasure trove of budgetary numbers coming out of the nation’s capital almost daily, such as nearly half of income tax revenues being dedicated to interest payments, Mr. Walker’s warnings have not been heeded nearly two decades later.

According to the Congressional Budget Office’s long-term outlooks, the national debt will eye $50 trillion by 2034, fueled by around $17 trillion in cumulative deficits. As a percentage of GDP, debt held by the public and the deficit will reach 166 percent and 8.5 percent by 2054, respectively, the CBO forecasts.

“Washington has become addicted to spending, deficits, and debt, and they’re charging the credit card and planning to send the bill to younger and future generations of Americans,” Mr. Walker told The Epoch Times.

“That’s irresponsible. It’s unethical, and it’s immoral, and it needs to stop.”

Is the United States past the point of no return?

“Only God knows when the tipping point is going to occur, and God’s not telling us,” he said.

He combs through various metrics to gauge the situation.

One of these is the debt-to-GDP ratio, which is presently at about 122 percent. Outside of the coronavirus pandemic, this is a record high.

Mandatory spending as a percentage of the federal budget is another metric. It currently stands at around 73 percent.

Another one is interest as a percentage of the budget, which is close to 15 percent.

For Mr. Walker, it is not only raw numbers but what the trends are displaying, which requires a deep dive into demographics.

“We have an aging society with longer lifespans, relatively fewer workers, supporting more retirees, and a skills gap,” he noted.

Last year, two notable developments happened: a majority of Baby Boomers were at least 65, and the birth rate tumbled to the lowest in a century.

This will metastasize into a costly burden for the federal government, particularly Social Security.

The Peter G. Peterson Foundation estimates that the current worker-to-beneficiary ratio is 2.8-to-1, down from 5.1-to-1 in 1960. By 2035, the Social Security Administration projects the ratio will further slide to 2.3-to-1.

Republicans and Democrats

President Joe Biden has claimed that he has acted fiscally responsibly, telling a crowd at a North America’s Building Trades Unions event on April 24 that he cut the national debt. (Insert a TV laugh track here). President Biden has repeatedly touted this claim over the last 18 months, although he has added close to $7 trillion to the national debt since taking office in 2021.

While Republicans have griped over the current administration’s spending endeavors, experts assert that the GOP has also contributed trillions of dollars to the debt pile. One of the GOP-led expansionist initiatives was Medicare Part D under former President George W. Bush.

This program, which was designed to utilize private health care plans to offer drug coverage to Medicare beneficiaries, added $8 trillion in new unfunded obligations. Mr. Walker accepted that “the politicians were totally out of touch with fiscal reality,” considering that Medicare was already underfunded by $19 trillion.

Put simply, both parties have been fiscally irresponsible, and now the bills are coming due.

Mr. Walker purported that politicians suffer from myopia as they are too focused on the next election and, as a result, fearful of making tough decisions. They also experience tunnel vision, he says, meaning they only concentrate on one issue at a time “without understanding the interdependency” and “the collateral effect.”

Self-interest is another malady infecting both sides of the aisle as they aim to keep their jobs and ensure their party stays in power.

“We’ve lost our sense of stewardship,” he said.

“Stewardship is not just generating results today, not just leaving things better off when you leave them when you came, but better positioned for the future,” Mr. Walker explained. “We’ve lost that sense. We need to regain it if we want our future to be better than our past.”

He identified Rep. Jody Arrington (R-Texas), who chairs the House Budget Committee, as one of the few lawmakers to realize the fiscal issues by committing to the Fiscal Commission Act and supporting a constitutional amendment that would limit government growth and stabilize the debt-to-GDP ratio.

“There are others, but there’s not enough,” Mr. Walker said.

Earlier this year, the House Budget Committee advanced the Fiscal Commission Act of 2024 out of committee with bipartisan support.

The bill would establish a 16-member panel featuring six Republicans, six Democrats, and four outside experts without voting power. The group would explore strategies to balance the budget as soon as possible and assess mechanisms to enhance the long-term solvency of various entitlement programs, especially Social Security and Medicare.

Despite some consternation from several Democrats, the bipartisan push received applause, including from the Committee for a Responsible Federal Budget.

“The federal debt is on an unsustainable course, and lawmakers have been unable or unwilling to correct it,” the organization stated. “A fiscal commission would bring Members of both parties and chambers together to facilitate a conversation over how to solve these problems, without pre-prescribing any particular solution (or a solution at all).”

Hope and Change

Whether the United States can improve its fiscal trajectories remains to be seen.

Mr. Walker is hopeful about some of the legislative efforts coming out of the nation’s capital. The country is beginning to face the consequences of years of fiscal mismanagement, making it harder to sell its debt to the rest of the world.

In recent months, many Treasury auctions have led to lackluster demand among domestic and foreign investors. Market watchers have warned that global financial markets might share Fitch and Moody’s concerns about America’s fiscal deterioration.

But when discussing trillions of dollars, percentages, GDP, and servicing costs, how can the average person, worried about paying his mortgage or replacing a broken-down refrigerator, grasp or even be concerned with these trends?

According to Mr. Walker, you tap into their “head and heart.”

“You have to help them understand that we’re already seeing some of the implications of fiscal irresponsibility,” he said, adding that the causes of the Roman Empire’s demise are familiar to what is transpiring in the United States today: fiscal irresponsibility, a decline in moral values, an overextended military, and an inability to control its borders.

However, while it is vital to translate these gigantic numbers into terms the layman can understand, experts also need to “hit their heart.”

“Do they love their country? Do they love their kids, and do they love their grandkids?” he said. “We’re mortgaging their future at record rates.”

Ever worse, politicians have promised $215 TRILLION in unfunded entitlements to the bottom 99%. When this all explodes, who will be left standing to make good on these promises??

Bidenomics Warning! Fed’s Favorite Inflation Indicator Prints Hotter-Than-Expected As Savings Rate Plunges (Govt Wages Rose To 8.5% YoY, Private Sector Wages Up 5.5% YoY)

Today’s economic news highlights “Government Power.” Unproductive government jobs saw wages rise 8.5% YoY while productive private sector jobs saw wages rise by only 5.5% YoY. This is Bidenomics!!!

With inflation data surprising to the upside recently…

Source: Bloomberg

…the doves’ last chance for sooner than later rate-cuts is today’s Core PCE Deflator – often described as The Fed’s favorite inflation signal. Last month saw an uptick in the headline deflator and following yesterday’s core PCE rise for Q1, all eyes are on the March data released this morning.

However, both the headline and core PCE Deflator data printed hotter than expected (+2.7% vs +2.6% exp vs +2.5% prior and +2.8% vs +2.7% exp vs +2.8% prior respectively)…

Source: Bloomberg

The silver lining is that this hot PCE print is ‘dovish’ relative to the GDP-based data we saw yesterday, with whisper numbers of +0.4 to +0.5% MoM (vs the +0.3% print).

But still – it’s not good for the doves.

As WSJ Fed Whisperer Nick Timiraos notes, the 3-Month annualized core PCE jumped to 4.4%…

The Service sector led the MoM and YoY acceleration in headline PCE…

Source: Bloomberg

And for Core PCE, it was Services prices too that drove the acceleration…

Source: Bloomberg

The so-called SuperCore – Services inflation ex-Shelter – rose once again, and was revised higher…

Source: Bloomberg

Stripping it back even further, Transportation Services and ‘Other Services’ were the biggest gainers in SuperCore…

Source: Bloomberg

Income and Spending both rose again on a MoM basis with spending outpacing income (again). The 0.8% MoM rise in spending was the highest since Jan 2023…

Source: Bloomberg

Spending is accelerating fast relative to incomes (on a YoY basis) – and remember this is all nominal

Source: Bloomberg

On the income side, government and private wage growth accelerated:

  • Govt wages rose to 8.5% YoY, from 8.3%, the highest Dec 22
  • Private wages rose to 5.5% YoY, from 5.4%, highest since Dec 22 as well

Source: Bloomberg

Which meant the personal savings rate plunged to 3.2% from 3.6% – its lowest since Nov 2022…

And the soaring credit card balance explains how people are getting by…

Source: Bloomberg

And all this amid the fourth straight month of government handouts…

Source: Bloomberg

Finally, while the markets are exuberant at the survey-based disinflation, we do note that it’s not all sunshine and unicorns. The vast majority of the reduction in inflation has been ‘cyclical’

Source: Bloomberg

Acyclical Core PCE inflation remains extremely high, although it has fallen from its highs.

Is The (apolitical) Fed going to be able to cut at all this year like Joe Biden said they would?