US New Home Sales Rose 5.8% MoM In November, But DOWN -15.3% YoY For The Ninth Straight Month (M2 Money Is Vanishing)

A classic good news, bad news story. The good news? US new home sales rose 5.8% in November, better that the expected -5.1%, The bad news? On a year-over-year basis, US new home sales FELL

Sales of new US homes unexpectedly rose in November, suggesting some stabilization in demand as mortgage rates eased late in the month from their highs.

Purchases of new single-family homes increased 5.8% to an annualized 640,000 pace last month after rising in October, government data showed Friday.

A mid-month retreat in 30-year mortgage rates back below 7% along with an increase in builder incentives may have helped support demand. Still, the sales data are volatile from month to month. With home prices remaining elevated and the Federal Reserve poised to raise interest rates further, headwinds for the housing market will persist into 2023.

The increase in sales last month was concentrated in the West and Midwest.

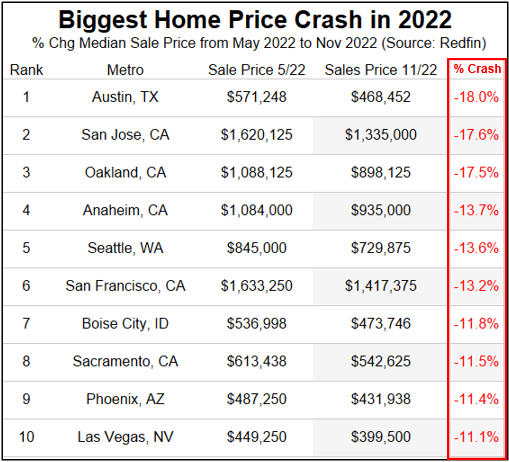
The report, produced by the Census Bureau and the Department of Housing and Urban Development, showed the median sales price of a new home was up 9.5% from a year earlier to $471,200.

There were 461,000 new homes for sale as of the end of last month, though the grand majority remain under construction or not yet started. The number of homes sold in November and awaiting the start of construction — a measure of backlogs — rose to the highest since the beginning of the year.

But for all the cheerleading, new home sales were DOWN -15.3% on a year-over-year basis. The ninth straight month of negative new home sales growth.

At least the median price of new home sales was down -2.79% from October to November.

Inflation Bomb? US Core PCE Deflator Calms Down To 4.7% YoY, Still Over 2x Fed Inflation Target (Taylor Rule At 10.10%, Still Unachievable)

There’s inflation in the air. The US Core PCE deflator slowed to 4.7% YoY in November. But it is still over 2x The Fed’s inflation target.

The lower core PCE growth of 4.7% YoY results in a Taylor Rule estimate for The Fed Funds Target rate of 10.10%. Which The Fed will never reach, particularly since the House Of Overlords (the US Senate) just passed a grossly irresponisble omnibus bill of $1.7 trillion laden with insidious pork barrel spending and, on a depressing note, billions for border security in Egypt, Oman and other countries, just not our wide-open border with Mexico.

Here are the Lords of Darkness (Schumer and Pelosi) who concocted this witch’s brew of crony payoffs that will be ulitmately signed by El Stupido (Biden).

US Leading Economic Indicator Falls To -1% QoQ In November, -4.5% YoY As Fed Sugar Dissolves (Do I Detect A Trend?)

Do I detect a trend in the US Leading Economic Indicator data?

The Conference Board’s US Leading Economic Indicator was released this morning and it wasn’t pleasant. The US Leading Index was down -1% MoM in November.

On a year-over-year basis, it is down -4.5% YoY as The Fed withdraws its massive monetary stimulus.

The good news … for military contractors … is that Biden and Congress have given Ukraine’s Zelenskyy ANOTHER $47 BILLION.

Misery! US Real GDP Remains Below 2% YoY As Core PCE (Inflation) Rises And Remains Near 5% YoY (Misery Index Remains Elevated At 12%)

Its another slow growth economic report for the Biden Administration. So much stimulus, so little to show for it other than painful inflation.

On a year-over-year (YoY) basis, US real GDP rose to a measly 1.9%. US core PCE YoY fell slightly to 4.93%. M2 Money growth is at 2.6% YoY.

The Misery Index (U-3 inflation rate + inflation) remains elevated and above 10% (it currently clocks-in at 12%), far above the pre-Covid reading of around 5%.

Here is the rest of the story. On a quarter-over-quarter basis, real GDP rose to 3.2% QoQ. Personal consumption rose 2.3% QoQ. Core PCE (Personal Consumption Expenditures) rose to 4.7% QoQ. If we use core PCE as a measure of inflation, inflation is rising.

Here is a video of Fed Chair Jerome Powell (doubling as President Joe Biden) saying creating inflation and then raising interest rates to fight it “It’s for the best.”

My Kuroda! BOJ’s Kuroda Shocks Markets By Loosening Rate Band (Final End To Uber-loose Japanese Monetary Policy)

My Kuroda!

(Bloomberg) — Bank of Japan Governor Haruhiko Kuroda just gave investors a glimpse of what to expect when the world’s boldest experiment with ultra-loose monetary policy comes to an end.

In the face of sustained market pressure, Kuroda shocked markets Tuesday by saying he’ll now allow Japan’s 10-year bond yields to rise to around 0.5%, double the previous upper limit of 0.25%.

Whether this is a strategic tweak to buy time for his yield-curve control settings until his decade-long term ends in Aprilor the start of the end for his unprecedented monetary easing remains to be seen. 

Here are the BOJ’s rate. bands being widened.

The yen?

And with the ECB, Fed and now Bank of Japan all tightening, we are seeing sovereign yields rising across the board.

The Japanese sovereign yield curve is upward sloping unlike the humped US Treasury yield curve.

Will the US Treasury Secretary Janet “Statist” Yellen comment?

Lightning Strikes? US Recession May Strike In September 2023 As Fed Continues To Fight Bidenflation (10Y-2Y Yield Curve Inverted For 112 Straight Days)

Lightning strikes!

The 12-month-ahead probability of recession spiked in November across all of yield curve models. The deterioration in the outlook was most significant in the one that relies on the 3-month/18-month forward spread — Fed Chair Jerome Powell’s favored model — which now sees a 59% chance of recession next year, compared with almost 0% six months ago. Yield curve models see the strongest signal for recession starting around September 2023.

We assess the probability of recession in the months ahead by looking at a suite of models: three yield curve models — which take as their sole input the spreads between 2-year/10-year, 3-month/10-year, and 3-month/18-month forward US Treasury yields, respectively — as well as a model that takes 13 financial and macroeconomic indicators as inputs.

All three yield curves inverted further in November, indicating higher probability of a downturn next year. Notably, the 3-month/18-month forward curve inverted for the first time this year, and the model based on that indicator suggests a 59% chance of recession in 12 months (vs. 32% for the same reference period in the prior update) — that would be in November 2023.

My favorite yield curve is the 10-year – 2-year curve which has been inverted for 112 straight days.

Winter is coming ,,, in September.

Stimulypto! US REAL 10Y Yield, REAL Fed Funds Target Rate And REAL Wage Growth Have Been Negative Under “Inflation Joe” Biden And An Overly Generous Fed

Like the Mel Gibson movie “Apocalypto!”, we are seeing the US middle class and low-wage workers being economically sacrificed by The Federal Reserve, the Biden Administration and Congress.

Despite the rhetoric that Fed stimulus (aka “Stimulypto!”) is being removed, the US remains plagued by NEGATIVE real 10-year Treasury yields, NEGATIVE real Fed Funds Target rate and NEGATIVE real average hourly earnings growth under Inflation Joe.

This chart demonstrates the Stimulytpo problem. Prior to Covid, US wage growth was consistently higher than headline inflation. But starting in March 2021, three months after Biden became President, headline inflation became higher than wage growth.

Even with all these negative REAL rates, the US economy is forecast to have almost no growth in 2023.

To quote Peggy Lee, Is That All There Is? Trillions in Federal spending and Fed monetary stimulus and all we get it 0.50% Real GDP??

Eyes Wide Shut? Sam Bankman-Fried And The Absence Of Risk Management (The Collapse Of Cryptos As The Fed Tightens Fighting Bidenflation)

One of the great ironies of the Sam Bankman-Fried debacle is that while SBF was a generous donor to Democrats (and a few RINOs) and President Biden, it was Biden’s green energy policies that were part of the nail in SBF’s crypto empire. As inflation exploded upon Biden taking office (and massive overspending by Congress), The Federal Reserve jumped in to cool inflation leading to the downfall of cryptos in terms of price.

M2 Money YoY (green line) shows the massive growth money with the Covid economic shutdowns in 2020. Cryptos skyrocketed after that much money was printed by The Fed. Cryptos fell shortly after peaking in April/May 2021, then peaked again in a horrific display of asset volatility in October/November 2021.

What happened in late 2021 to crush cryptos? Ah, expectations of Fed rate increases (red line) started to soar meaning the punchbowl for cryptos was being taken away. The Fed giveth and The Fed taketh away.

The risk management question is … how did SBF and Alameda Research’s Caroline Ellison didn’t notice the relationshop between crypto prices and changing Federal Reserve monetary policy? Even worse, why didn’t investors ask questions??

Take a gander at Bitcoin relative to US diesel fuel prices (orange line) and The Fed’s inflation counterattack (red line). Sam and Sweet Caroline (who was seen walking free in NYC) must not have been monitoring how rapidly rising diesel prices would permeate the entire economy in terms of price increases. M2 Money YoY (green line) has been declining as the expectations of Fed rate tightening (red line) has increased.

SBF donated a huge amount to the midterm elections, the party that went along with Biden’s war on fossil fuels. Then inflation ensued as energy and food prices skyrocketed, leading The Federal Reserve to fight inflation by removing the monetary punchbowl. So, in a sense, SBF donations led to his own collapse.

Apparently, SBF, Caroline Ellison and the other FTXers were engaged in orgies and not paying attention to the impact of inflation and Fed policies on cryptos.

Lastly, how did Gary Genslar and the SEC not see any of this? In the same way that Fed Chair Ben Bernanke didn’t see the financial crisis as it was rapidly unfolding: eyes wide shut.

I read that Nicole Kidman underwent psychiatric treatment after filming “Eyes Wide Shut.” I saw it and was bored out of my mind.

The Amazing, Disappearing Jumbo/Conforming Mortgage Spread Since Covid And Fed Intervention (Jumbo Spread At 1.67 Basis Points After Covid Fed Reaction)

Years ago, Brent Ambrose, Michael Lacour-Little and I wrote a paper on the US 30-year jumbo mortgage spread over conforming 30-year mortgage rates entitled “The effect of conforming loan status on mortgage yield spreads: a loan level analysis.” But that paper was written before Covid and the dramatic distortion caused in mortgage markets by The Federal Reserve’s massive increase in money.

Here is the spread between Bankrate’s 30-year mortgage rate and their 30-year JUMBO mortgage. Notice that between 2007 and early 2020, the median “jumbo spread” was 49 basis points. But after Covid and The Fed’s counterattack (by printing M2 Money), the median Jumbo spread from 4/1/2020 to today is only 1 basis point.

In the following chart, you can see the jumbo mortgage rate (yellow) against the conforming mortgage rate (white) and there is almost always a spread between the two UNTIL 2020 where we saw M2 Money growth (green line) spike and The Fed increased their purchases of Agency MBS (purple line). Since Covid and The Fed’s massive reaction, the jumbo rate and conforming rate are virtually the same. In fact, the latest jumbo spread is 1 basis point over the conforming rate.

Why is this happening? One explanation is that demand from the investors who ultimately buy jumbo mortgages. The strong demand by investors appears to have driven down the yields on jumbos relative to conventional loans, especially as the use and accessibility to jumbos has grown.

A second explanation is that Loan Level Price Adjustments that were added to conforming loans post-financial crisis never went away (until just recently on selected loans). This makes jumbos and conforming loans very close in yield.

So, when will the mortgage market return to normal and jumbo mortgages go back to the normal 50 basis point spread? We may see normalization if The Fed speeds up its withdrawal from markets. Also, getting rid of Loan Level Price Adjustments would help normalized the mortgage market.

But things are getting stressed in jumboland (California) where home prices are crashing in 5 of the top 8 metro areas.

Harry Houdini couldn’t have created a more tantalizing mystery … and one I wish would go away.

California Screamin’! 2022 Home Prices Crashed Mostly In California As Fed Withdraws Monetary Stimulus (Austin TX And Seattle WA Also Crashed Hard)

California Screamin’!

6 of the top 8 metro areas with the largest home price crash in 2022 were in California, according to Redfin.

Sadly, I lived in three of these metro areas (Austin TX, San Jose CA and Phoenix AZ), although I wouldn’t confuse correlation with causation.

The trend for home price growth (blue line) is definitely on the downturn as The Fed removes its ample stimulus (green line).

Here is California governor Gavin (Nancy Pelosi’s nephew) Newsome screaming about crashing California home prices.