Bidenomics is forcing Americans to live hand to mouth. Or as Lou Chrisite sang, “Lightning Strikes …. Americans” leaving them worse off under Bidenomics.
The cost of living has been soaring, and our standard of living has been steadily going down.
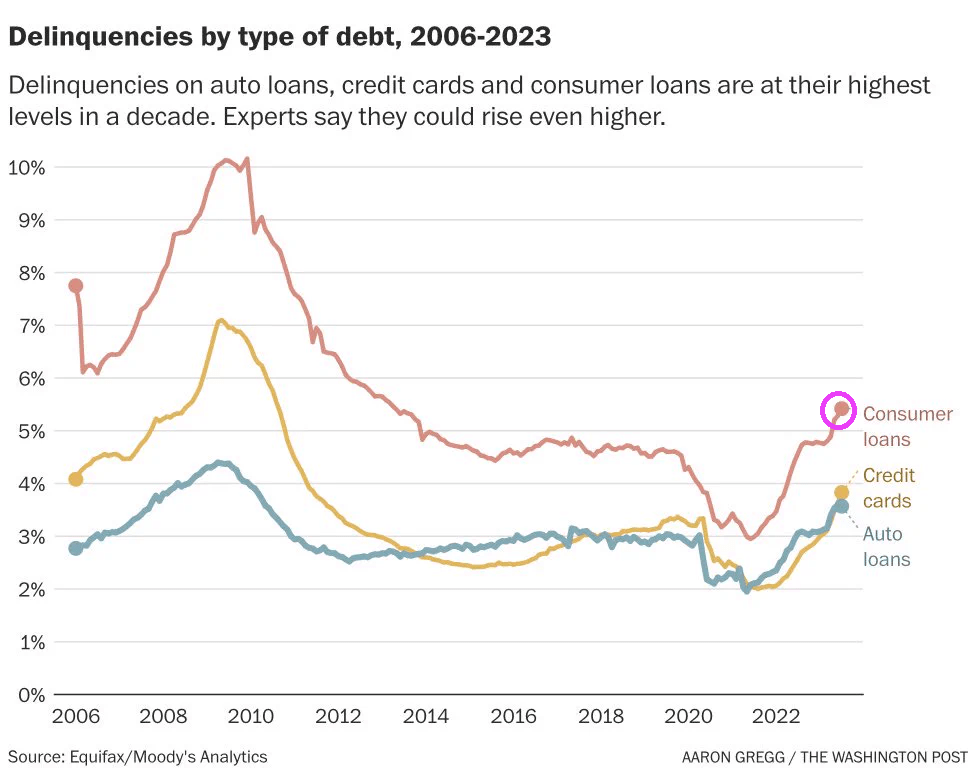
Coping with inflation is tough for American households where consumer debt is up 19.$ under Biden while the free-spending Federal government’s public debt is up only 16.5%.

As a result, over 60 percent of Americans are living paycheck to paycheck at this point, and debt levels are rising to unprecedented levels.
“In July 2023, 61% of U.S. consumers live paycheck to paycheck, unchanged from June 2023, but 2 percentage points higher than July 2022. Generally, more consumers of all income brackets reported living paycheck to paycheck in July 2023 than last year,” Alia Dudum, a money expert at LendingClub told FOX Business.
Now, 78% of consumers earning less than $50,000 a year and 65% of those earning between $50,000 and $100,000 were living paycheck to paycheck in July, both up from a year ago, LendingClub found. Of those earning $100,000 or more, only 44% reported living paycheck to paycheck.
Because consumers have so little disposable income these days, retailers all over the nation are experiencing difficulty.
In fact, UBS is projecting that 50,000 stores could close in the United States by the end of 2027…
Analysts at investment bank UBS are forecasting that some 50,000 U.S. stores are likely to close by the end of 2027, because of expected cutbacks in consumer spending, tighter credit and the continued shift to ecommerce.
Store closings could accelerate to 70,000 to 90,000 if retail sales turn out to be weaker than expected, according to UBS.
Actually, I think that losing 50,000 stores is a wildly optimistic scenario.
Hopefully I am wrong about that.
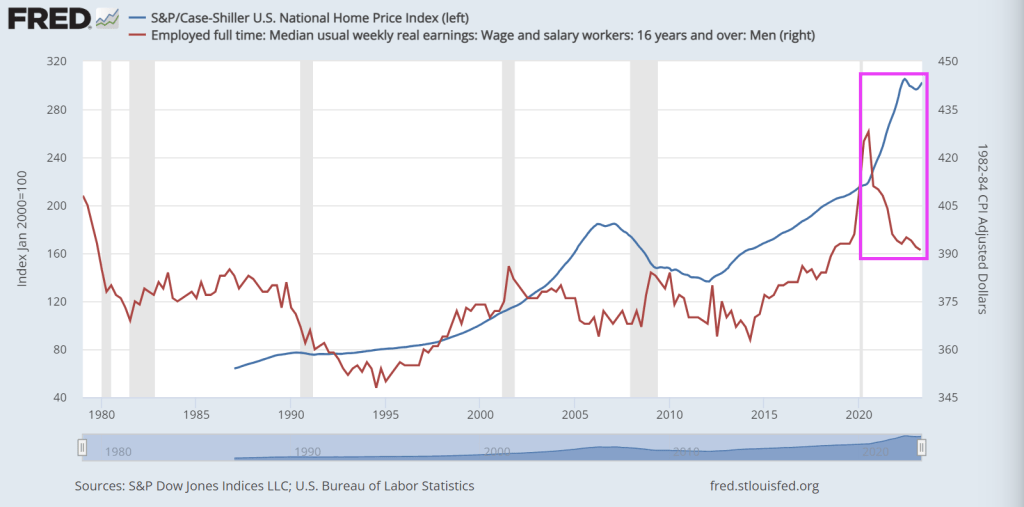
The housing market has also been going haywire.
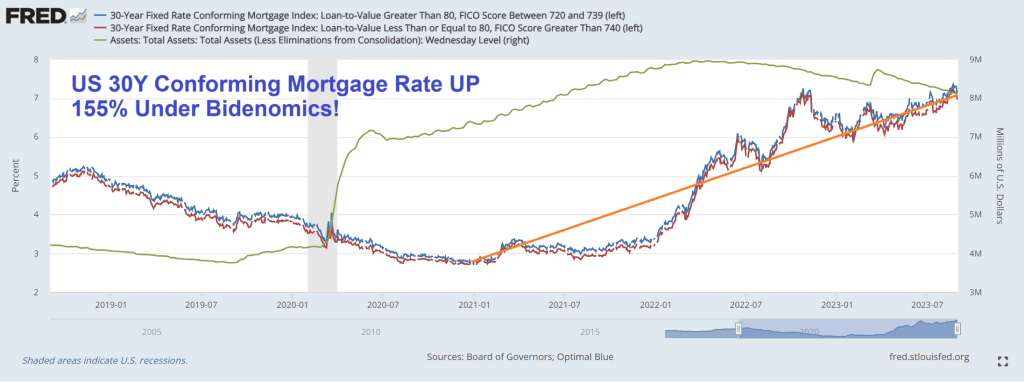
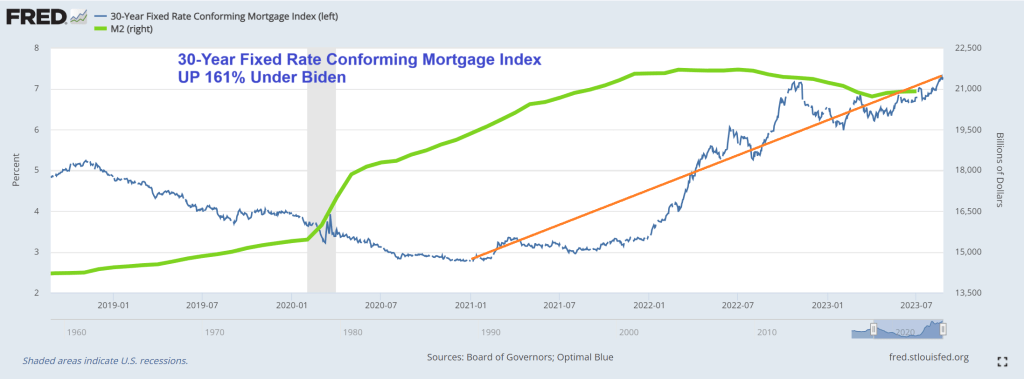
According to Fortune, the month of August “will become the worst month for housing affordability this century”…
On Monday, the average 30-year fixed mortgage rate reached 7.48%, marking the highest level since the year 2000. Even prior to this recent surge in mortgage rates, housing affordability, as monitored by the Atlanta Fed, had already deteriorated beyond the levels seen at the housing bubble’s peak in 2006. Once this latest mortgage rate surge is factored in, August 2023 will become the worst month for housing affordability this century.
Wow.
Thanks Delaware Joe Biden (as opposed to Country Joe Stalin).
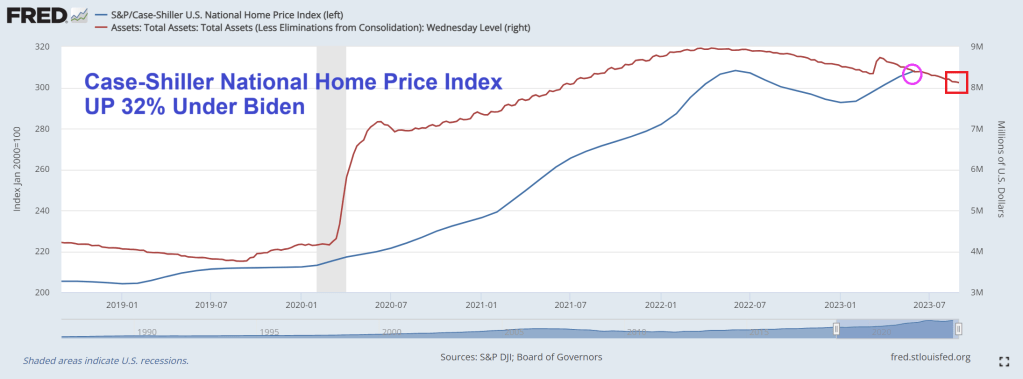
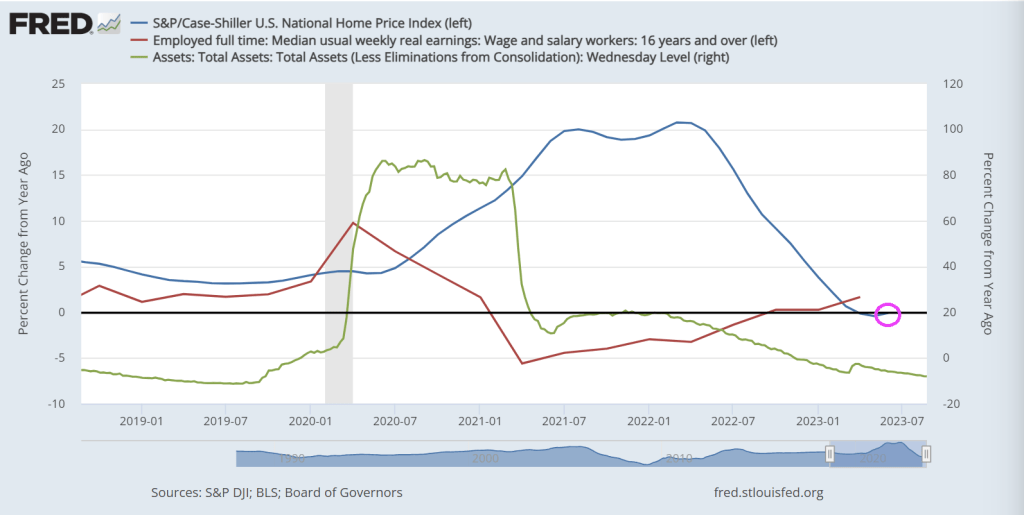
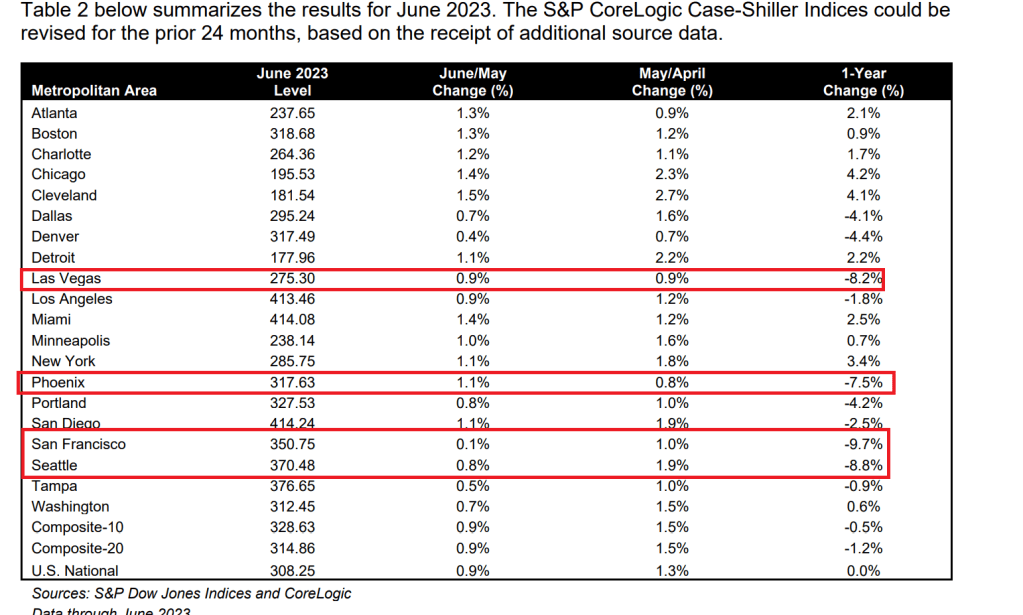
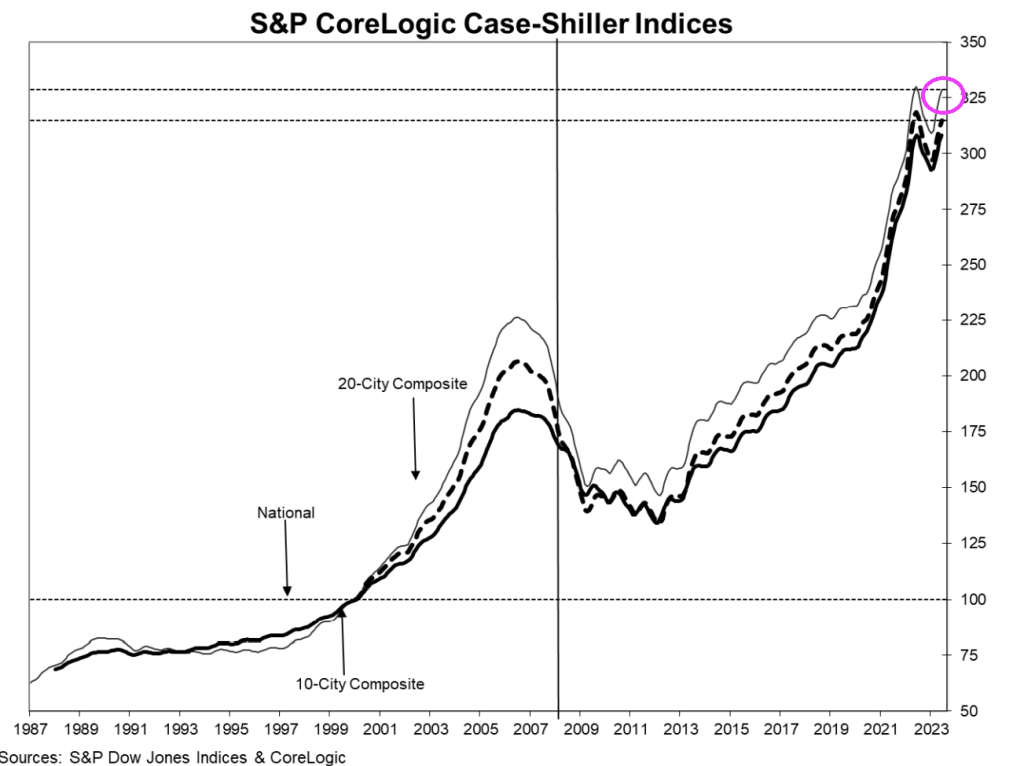
Home prices are going to have to come down, and in some areas they have already fallen quite a bit…
Homeowners are sitting on a negative equity timebomb after losing $108.4 billion on their property values this year, experts say.
The average borrower saw their home equity plummet by $5,400 in the first quarter of 2023 compared to last year – with households in Washington, California and Utah worst affected.
Do you remember the housing crash of 2008 and 2009?
Well, now the next housing crash is here, and it isn’t going to be fun.
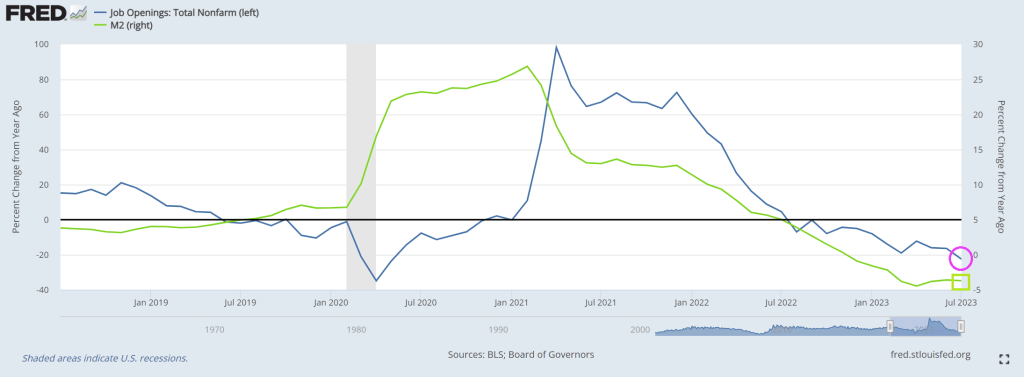
For a while there, Joe Biden and his minions could at least boast about the employment market.
But now large companies all over America are laying off workers, and it is being reported that a staggering 1.223 million native-born Americans lost their jobs during the months of July and August…
Staggering figures have revealed that over 1.2 million US-born workers lost their jobs last month while the foreign-born workforce increased by nearly 700,000 – as migrants continue to flood across the border under the Biden administration.
Data from US Bureau of Labor Statistics show that between July and August, there was a staggering decrease of 1.223 million native-born people in the workforce – which is a low not beaten since the jobs crash when Covid hit in April 2020.
The numbers that I have shared with you are nothing to brag about.
But Joe Biden is going to keep trying to pull the wool over the eyes of the American people anyway.
Unfortunately for Biden, it has become quite clear that most Americans have lost faith in him. According to the same Wall Street Journal poll that I mentioned above, 73 percent of U.S. voters now believe that Biden “is too old to run for president”…
For Biden, one of his biggest challenges is age. The Wall Street Journal poll found that about 73% of voters think Biden is too old to run for president while only 47% think Trump is too old. Thirty-six percent of voters think that Biden is mentally up for the job while 46% of voters think Trump is mentally capable of being president.
We have never seen numbers like this for any other president.
It is obvious that Biden is in a very advanced state of decline, and this is happening during one of the most critical periods in our history.
Sadly, Biden fully intends to run again. (Especially since half-wit Jill Biden is allegedly running The White House).
And the Democrats will get behind him, because at this point no other candidate is posing a serious threat to Biden. Wait, not Gavin Newsom who almost single handedly destroyed California or Michelle Obama who has absolutely no qualifiications?? Other than being Barry Soetoro’s wife?
Nobody likes a clown like Biden.


You must be logged in to post a comment.