US Real GDP Annualized QoQ printed at -1.5%. And GDP prices QoQ printed at 8.1%, also higher than expected.
At least Personal Consumption printed higher than expected at 3.1%.
Import prices (goods) led the way at 20.9%. Part of Biden’s brilliant strategy of reducing domestic oil production and import expensive energy from overseas?
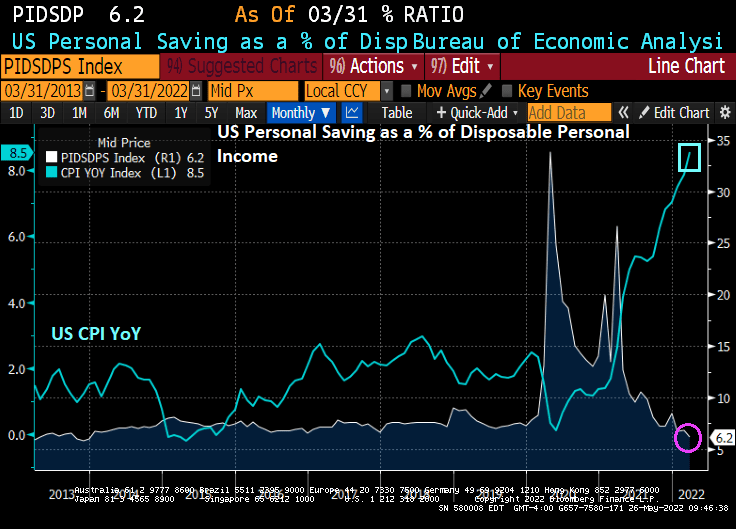
Consumers are spending more, but the personal savings rate is down to the lowest level since 2013 at 6.2% as consumers try to cope with inflation.
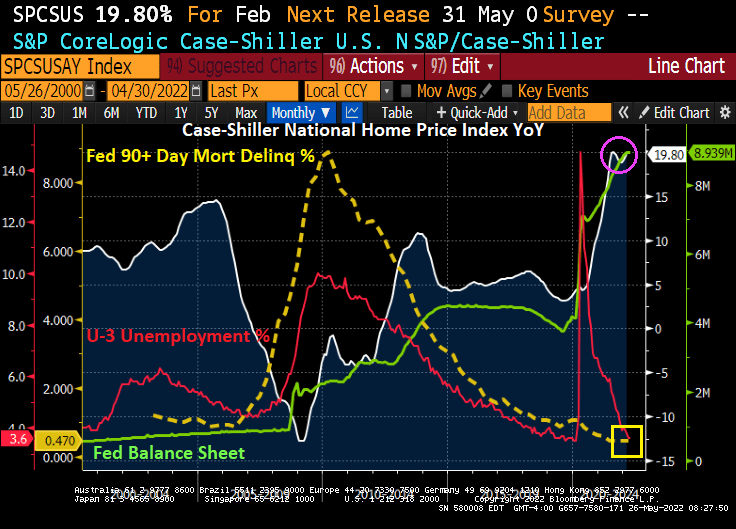
If we look at 90+ days late for mortgages (yellow line), we see that the surge in unemployment with the Covid outbreak and subsequent government shutdowns (red line) did not lead to a surge in mortgage foreclosures.
This situation is quite unlike 2008 when collapsing home prices and the subsequent surge in the unemployment rate led to a 90+ days late surge on mortgages (yellow line).
Difference between today and 2008? The Federal Reserve’s asset purchase (green line) surge happened twice AFTER the 2008 housing crash. Once in late 2008 through 2014, then a second, bigger surge in March 2020 after the Covid outbreak. One big difference is the surge in home prices, home price growth was 3.69% YoY in December 2019 and skyrocketed to 19.80% as of February 2022. This translates to a massive increase in homeowner equity, leading to a lower probability of default.
So, there you go. Powell and The Federal Reserve made housing unaffordable for millions of Americans, but The Fed did help thwart another mortgage default crisis. BUT we will see what happens with future rate hikes from The Fed.
Here is Attom’s US Foreclosure Starts chart. Yes, that is hardly a surge, although foreclosure starts did rise in Q1 2022.
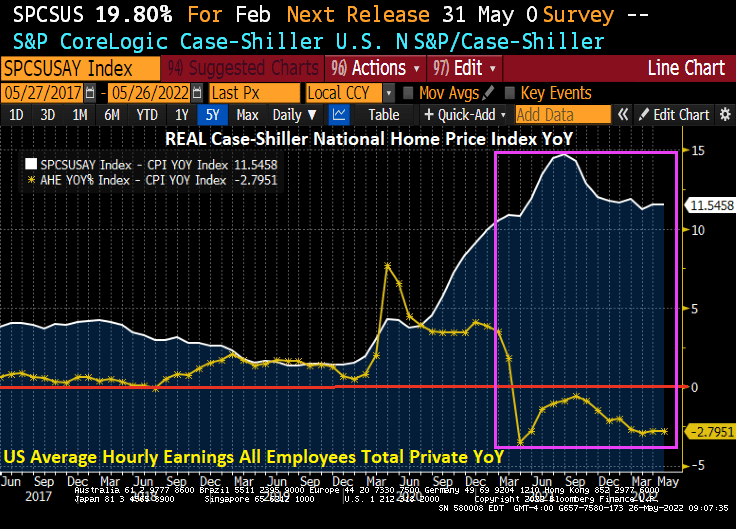
So, The Fed has helped make housing simply unaffordable. Look at the growth of REAL home prices relative to REAL average hourly earnings.
The US Q1 GDP report is due out tomorrow morning. The forecast is for -1.3% decline in GDP.
The Atlanta Fed GDPNow real-time GDP tracker is for 1.806% for Q2. If this holds, then recession fears will diminish.
Even though the US may avoid consecutive negative GDP quarters, M2 Money Velocity (GDP/M2 Money) got crushed by The Fed’s reaction to Covid back in 2020.
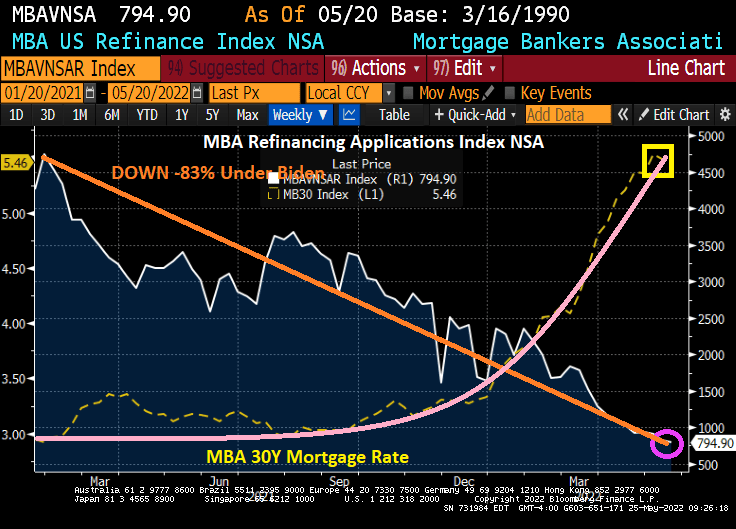
Mortgage applications decreased 1.2 percent from one week earlier, according to data from the Mortgage Bankers Association’s (MBA) Weekly Mortgage Applications Survey for the week ending May 20, 2022.
The Refinance Index decreased 4 percent from the previous week and was 75 percent lower than the same week one year ago. And under Biden, the refinance index is down -83.2%.
The good news? The seasonally adjusted Purchase Index increased 0.2 percent from one week earlier. The unadjusted Purchase Index decreased 1 percent compared with the previous week and was 16 percent lower than the same week one year ago. And the mortgage purchase applications index is down -12% under Biden.
While mortgage interest rates are up 71.7% than one year ago and mortgage rates are up 87% under Biden. As The Federal Reserve signals (but not yet accomplished) monetary tightening.
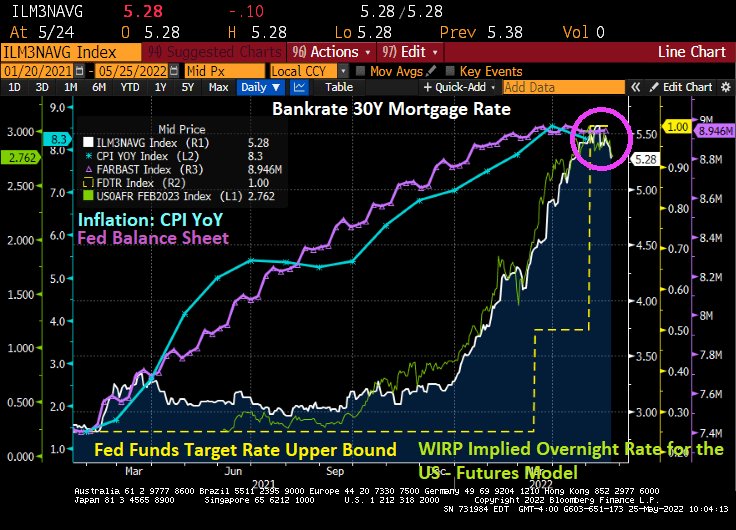
Once again, The Fed is dead set on cooling inflation caused by 1) Biden’s anti-drilling policies and 2) the remnants of the Federal government spending splurge to combat Covid. The Fed has been increasing their asset purchases (purple line) as inflation increase (blue line). Now they are signaling a decline in the balance sheet (green line) in the hope that it will cool inflation. Fat chance.
Let’s see how DEAD SET The Fed is about tightening monetary policy in the face of rising energy and food prices while a war rages in Ukraine and China in a Covid lockdown.
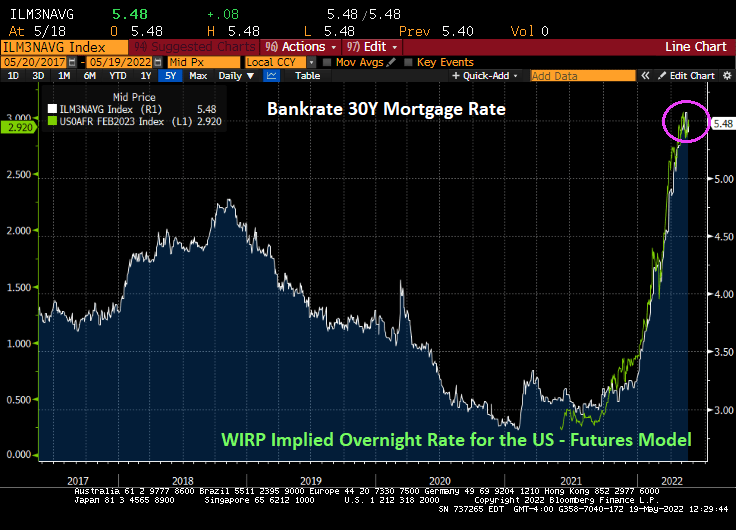
US home prices were growing at a near 20% YoY rate for the latest Case-Shiller National home price index report. But mortgage rates have soaring like a SpaceX missile shot.
Of course, I am moving to one of the metro areas in the USA where closed sales fell only -1.10% YoY in April: Columbus Ohio. I should move to San Diego CA where closed sales fell -21.4% YoY.
Of course, the US still suffers from lack of available inventory for sale.
April new listings are down -5.7% YoY. Columbus Ohio didn’t change from April ’21. San Diego is down -18.4% YoY for new listings.
Rising mortgage rates? Inflation? What a total fiasco.
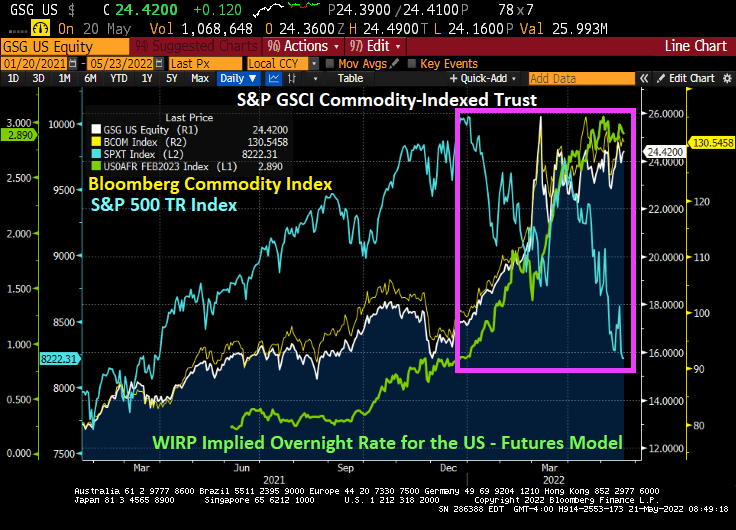
We have a double whammy facing investors, The Federal Reserve wanting to take away the monetary punch bowl and Federal energy policies that are crushing middle-class households and lower-wages workers.
But how do you hedge against The Federal Reserve tightening and Biden’s reckless energy policies?
Take a look at investing in commodities (S&P GSCI Commodity-Indexed Trust and the Bloomberg Commodity Index) versus the S&P 500 Total Return index since The Fed began signaling that they would take away the monetary punch bowl.
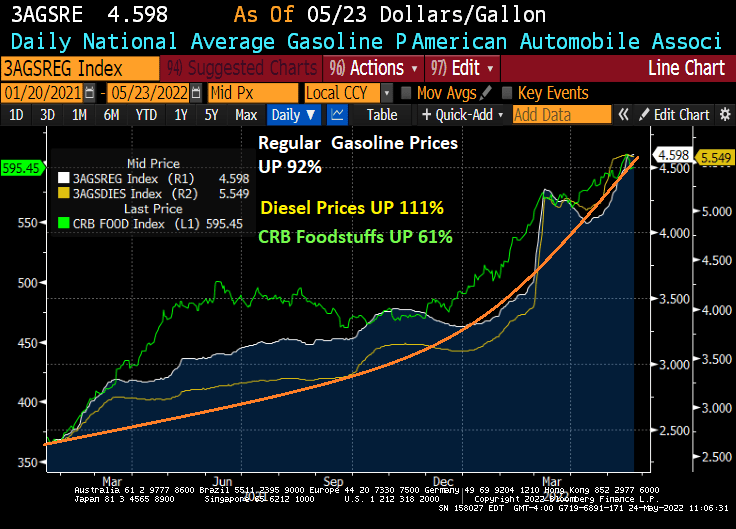
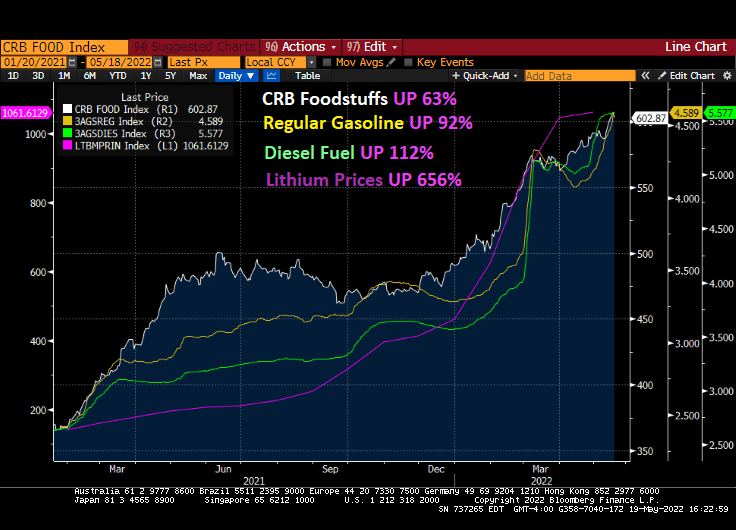
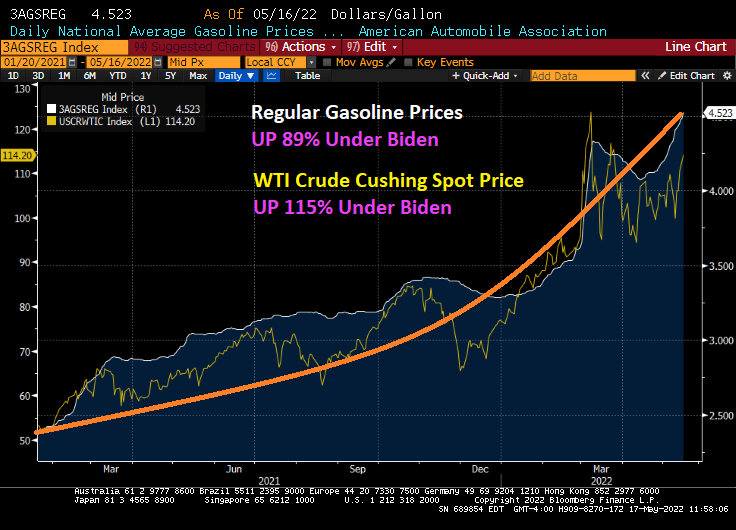
Yes, commodities like food and gasoline/diesel prices are up dramatically under Biden’s energy policies (not to mention the USA’s proxy war with Russia).
The Fed seems determined to remove the Fed “Snake juice” from the economy.
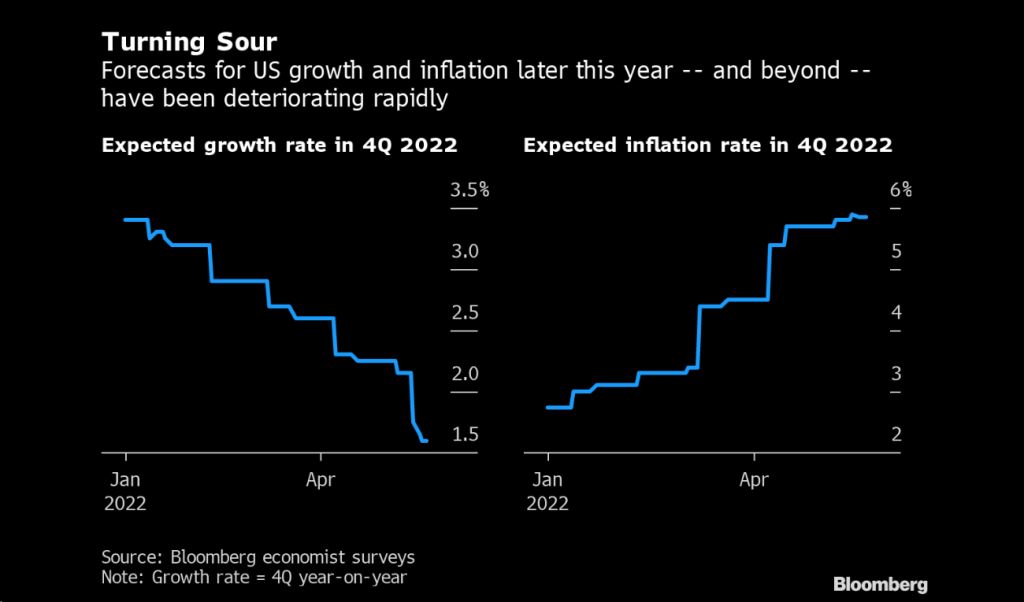
The US economy us approaching recession as inflation soars and expected growth declines.
Food and energy prices are soaring, hitting middle class and low-wage households like a hammer. While the headline inflation rate is 8.3% YoY, food is up 63% under Biden and gasoline is up 92%.
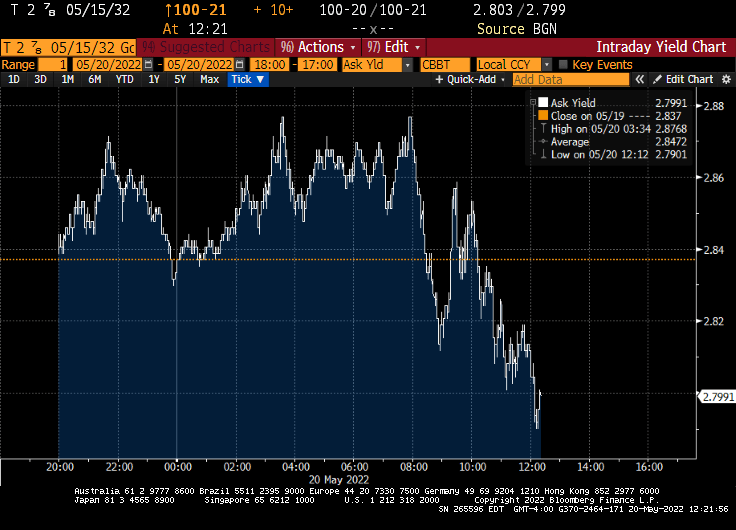
The 10-year Treasury note yield is down today, which bodes well for 30-year mortgage rates.
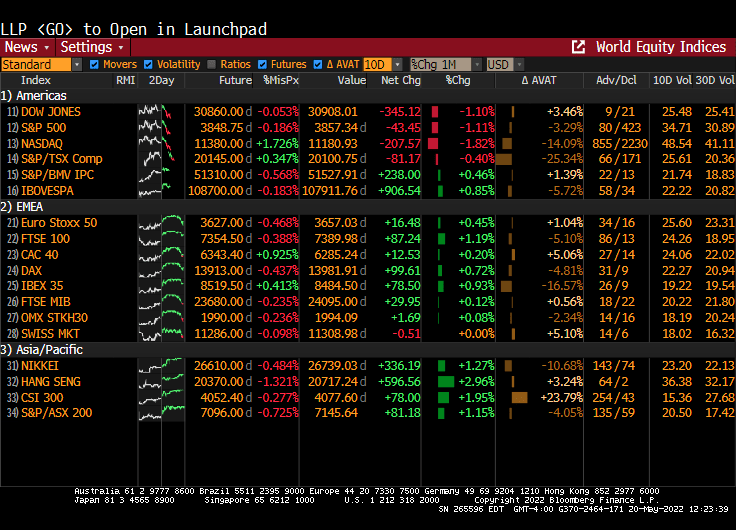
The Dow, S&P 500 and NASDAQ are all down over -1% today.
The inflation that is crushing Americans is due to energy and food price increases. That is, the non-core inflation. Under Biden, food is up 63%, gasoline is up 92% and diesel prices are up 112%. But The Fed doesn’t consider food and energy prices, per se.
If we look at the Taylor Rule considering fighting inflation including food and energy, The Fed would have to raise their target rate to … 21.38%.
Now, The Fed can clearly cool-off the housing market by raising rates. In fact, my fear is that they go too far and crash the housing market. The Fed will NEVER get to 20% again like we last saw under Volcker in 1981. 20% rates certainly cooled home prices back then and Fed rate hikes helped crash the housing market in 2008.
So, when The Fed says they want to be the inflation-fightin’ Fed, we must be aware what The Fed can and cannot do. They can’t tame the inflation beast in the form of food and energy prices (unless they crash the economy), but they can crush home prices.
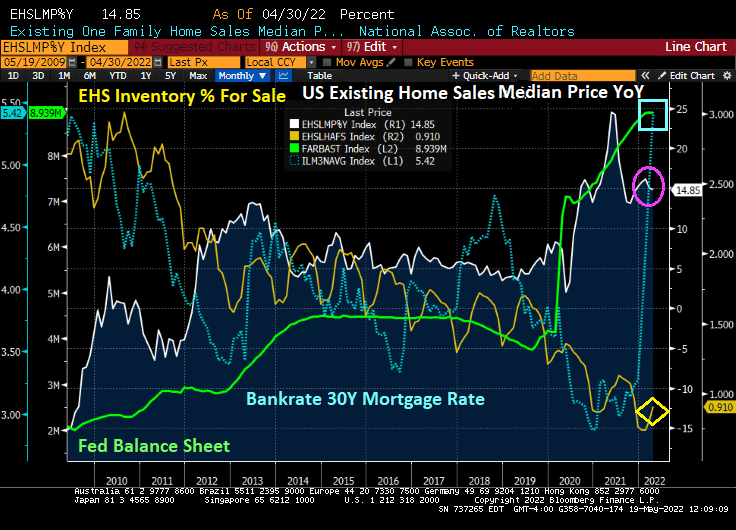
US Existing Home Sales were 5.61M SAAR in April, down -2.4% from March’s -3.0% MoM reading. But median prices YoY for existing home sales printed at 14.85%, still hot, hot, hot.
With 3 consecutive declines in MoM existing home sales, how can prices still be raging at 14.85%? First, inventory for sale in April remains low compared to 2010 (yellow line). Second, The Federal Reserve’s Stimulypto (excessive monetary easing) is still out there in force despite Jerome “Slowhand” Powell signaling rate increases (green line). 30Y mortgage rates are still rising.
Where do we go from here? 30 year mortgage rates have been climbing as The Fed signals its intents to tighten monetary policy. But with global economic slowing, Treasury yields have been coming down (like today’s -5.2 BPS drop (Germany’s 10Y Bund Yield dropped -8 BPS on slowing global economic growth).
But remember, the Existing Home Sales numbers are for April.
Seriously, with soaring energy prices and soaring EVERYTHING prices (except for real wage growth), it is difficult to see how the US will avoid a recession.
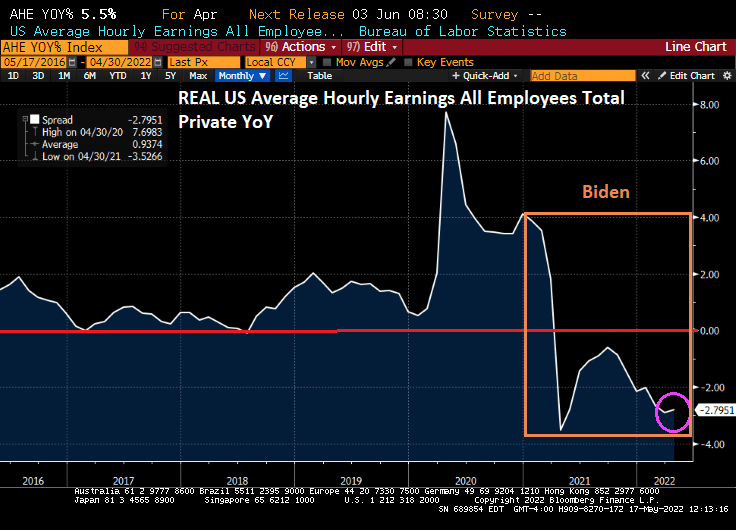
Yes, everything is seemingly rising in price, yet REAL average hourly earnings growth keeps falling. Rising price + declining real earnings growth = eventual recession.


You must be logged in to post a comment.