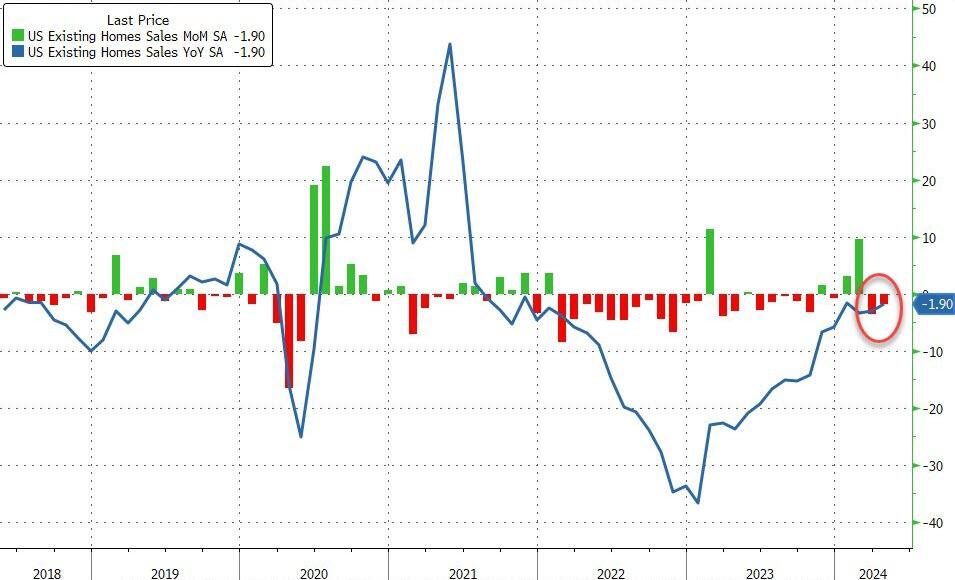
After (unexpectedly) tumbling in March, existing home sales were expected to rise modestly (+0.8% MoM) in April. Analysts were wrong as March’s data was revised marginally up from -4.3% MoM to -3.7% MoM and April printed -1.9% MoM (a big miss). That left existing home sales down 1.9% YoY…
Source: Bloomberg
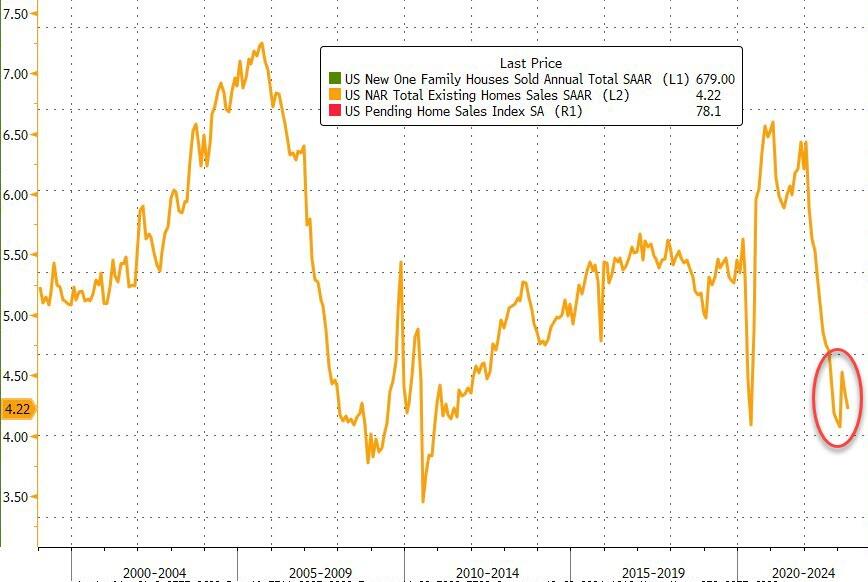
That pushed the existing home sales SAAR back near COVID lockdown lows…
Source: Bloomberg
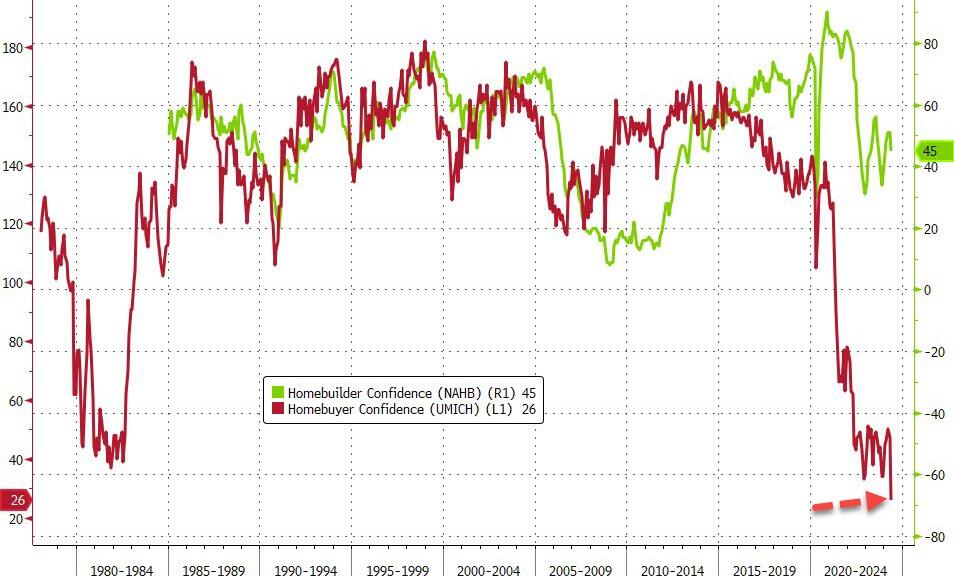
This really should not come as a surprise because, while homeBUILDERS remain optimistic that things will pick up, homeBUYERS are the least enthusiastic they have ever been about buying a home… going back almost 50 years…
Source: Bloomberg
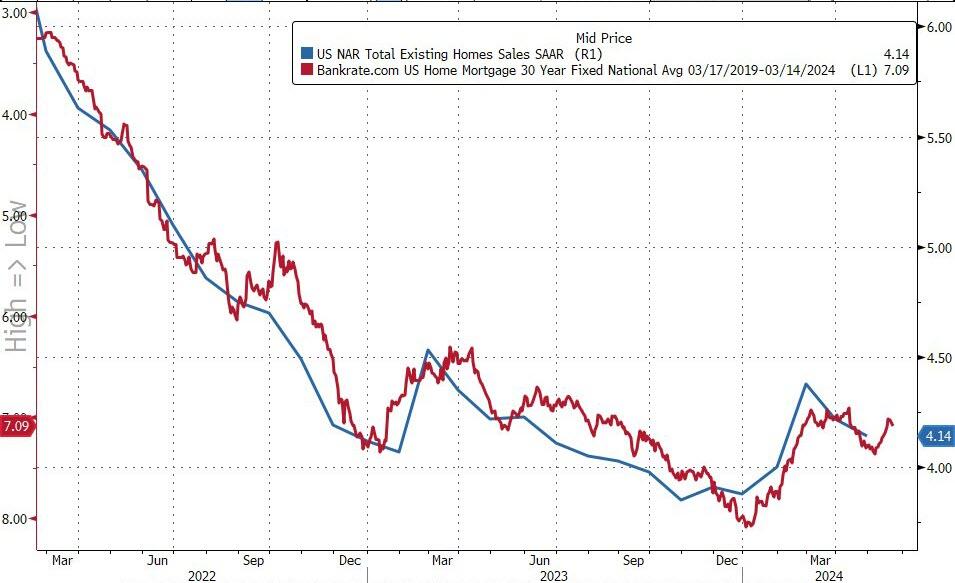
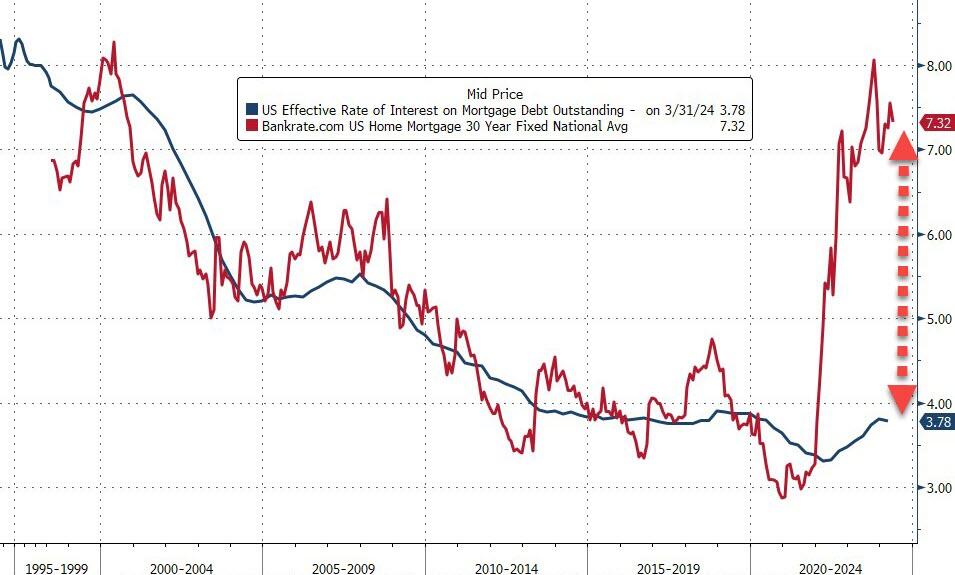
And with mortgage rates still above 7%, we don’t see things picking up meaningfully anytime soon…
Source: Bloomberg
…and then there’s this…
Source: Bloomberg
Sales declined in all four regions, including a 2.6% decrease in the West and a 1.6% drop in the South
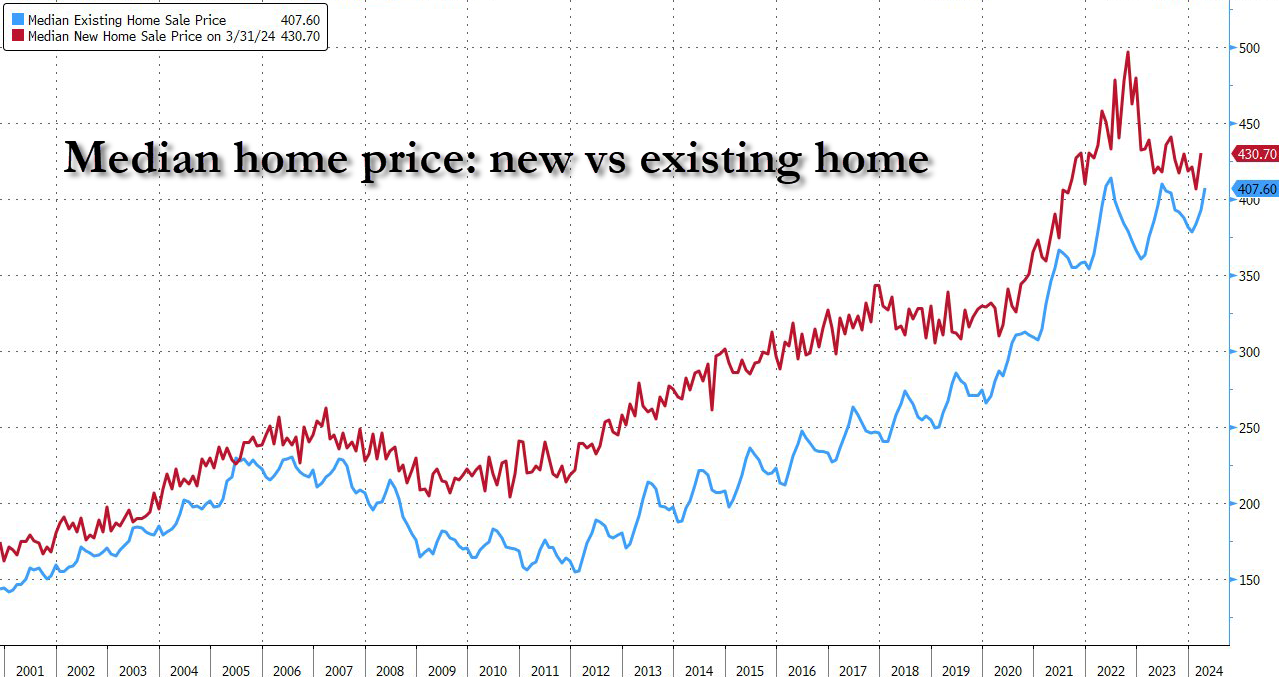
The median selling price increased 5.7% from a year ago to $407,600 – the highest for any April in data back to 1999.
Unlike in the new-home market, where rising inventories and the prevalence of incentives by builders have pushed prices down on an annual basis, the home-resale market is experiencing rising year-over-year price growth.
“Home prices reaching a record high for the month of April is very good news for homeowners,” NAR Chief Economist Lawrence Yun said in a statement.
“However, the pace of price increases should taper off since more housing inventory is becoming available.”
About 68% of the homes sold were on the market for less than a month, up from 60% in March, while more than a quarter sold above the list price.
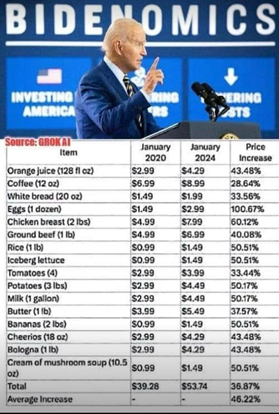
I learn something new everyday. Like Biden yesterday claimed has was VP during Covid (uhm, Covid was in 2020 and Biden left the office of VP in 2017). But nothing gets in the way of Biden and a good story! Like his whopper that he inherited 9% inflation from Trump (even CNN fact-checked this whopper and found it was false. It was only 1.4%!)
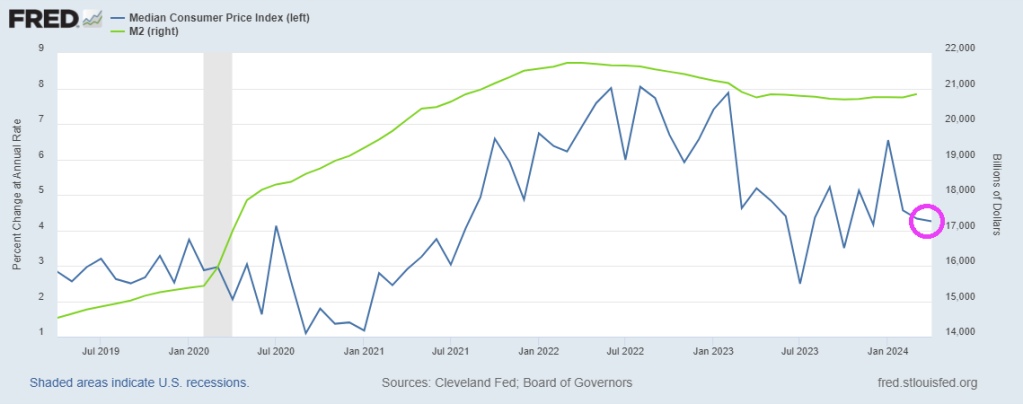
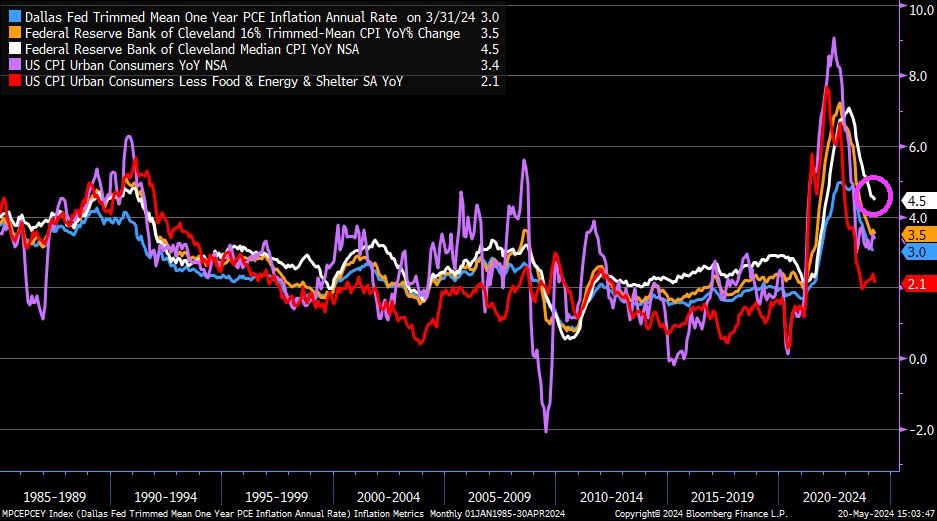
But inflation is still at 4.5%, according to the Cleveland Federal Reserve.
Now, there are many measures of inflation to choose from, from Core CPI of 2.1% YoY to Cleveland Fed’s Median CPI of 4.5%.
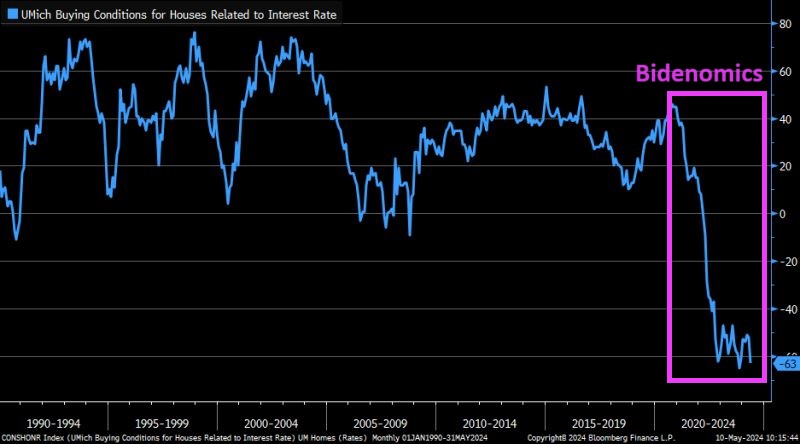
The US is on a “Highway to Hell!” thanks to flawed economic policies under Biden.
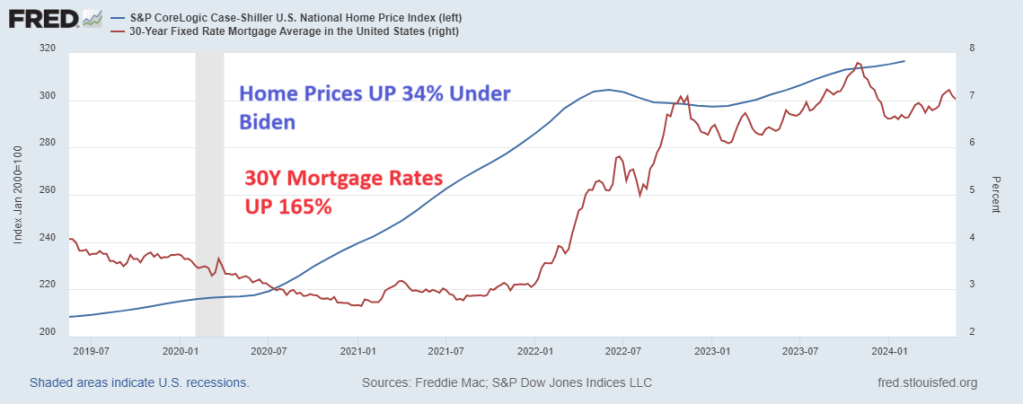
First, interest and mortgage rates under Biden have soared driving buying conditions for housing to all-time lows. Combine sky-high home prices with high mortgage rates and we have as serious affordability crisis.
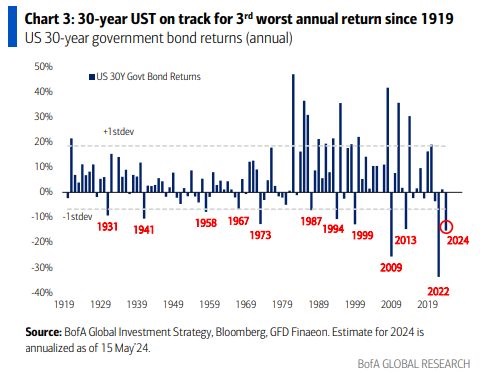
Second, on the interest rate front, the 30-year Treasury bond is on track for the 3rd worst annual return since 1919 and Russia’s invasion of Ukraine. Not not the current invasion, but the 1919 invasion.
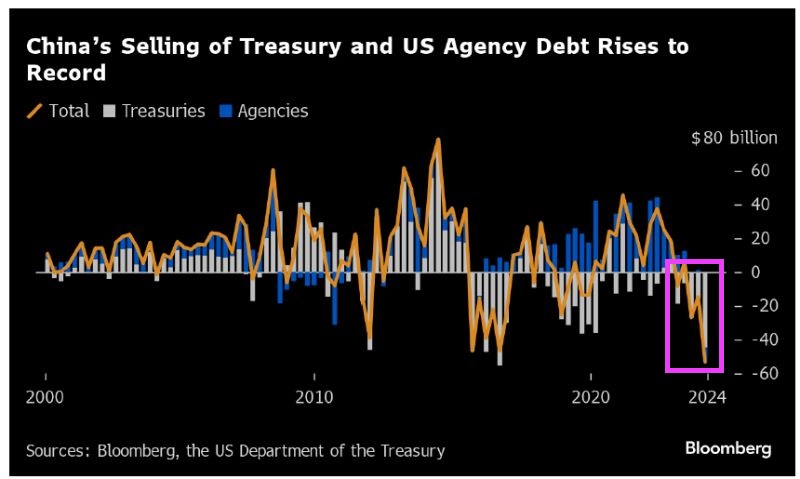
Third, China is dumping their holdings of US Treasuries and Agency Debt at record rates.
Of course, mortgage rates hit 18% in 1981. So, the term high mortgage rates is relative. The US had low rates for too long (Bernanke/Yellen) and mortgage rates are now in the 7% range, up 165% under Biden. And home prices are up 34% since Biden was sworn-in as President. Wow! Mortgage rates up 165% and home prices up 34% under Biden’s Reign of Error.
It turns out unionized employees extorting you on labor costs while the government mandates you produce a money-losing product isn’t a combination that leads to prosperity and profit. Go figure.
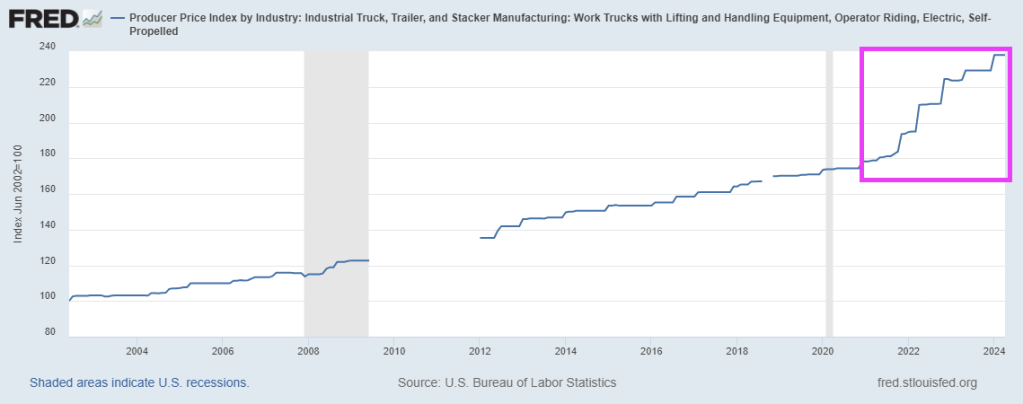
Now, it isn’t just car manufacturers that are balking from the idea of all electric vehicles: the trucking industry, once expected to eventually make the shift to all electric as well, is seeing tepid demand for new rigs, according to a new Wall Street Journal article.
Of course, the producer price index for electric trucks and equipment has soared under Biden (like everything else). PPI for electric trucks and equipment are up 33.6% under Biden and his disastrous green energy fiasco.
“The economics just don’t work for most companies,” Robert Sanchez, the chief executive of Ryder, said earlier this month.
Ryder’s experience highlights the difficulties state and federal governments encounter in encouraging truckers to transition from polluting diesel rigs to zero-emissions vehicles, the report says.
It also indicates that significant improvements in battery weight, range, and charging times are necessary for battery-electric trucks to effectively compete with diesel rigs in the cost-sensitive freight industry.
Rakesh Aneja, head of eMobility at Daimler Truck North America, told Wall Street Journal: “Quite frankly, demand has not been as strong as what we would like.”
Aneja said orders for its Freightliner eCascadia battery-electric semi truck are about the same this year as they were in 2023.
Battery-electric trucks are about three times more expensive than diesel rigs, the Journal notes. And while federal and state programs help offset purchase costs, significant hurdles remain due to high operating costs and setup challenges.
Truckers find these electric trucks difficult and costly to run, with installation of on-site charging facilities taking years. These trucks travel less than half the distance of diesel rigs per charge and require several hours to recharge.
Ryder launched a service a year ago to assist companies in setting up and maintaining battery-powered fleets. So far, it has sold only 60 vehicles, mostly light-duty trucks. Three companies use five battery-electric heavy-duty trucks, but only within yards for shuttling trailers.
Sanchez noted that unlike individual electric car buyers, companies will only switch to battery-electric trucks when they can compete with diesel on operational costs.
The cost of changing a fleet over is also expensive. Using data from 13,000 vehicles, Ryder analyzed the annual operating expenses of battery-electric commercial trucks and found they are significantly higher than those of diesel rigs. The analysis, assuming existing fast-charging infrastructure, considered costs like vehicle purchase, maintenance, labor, and fuel.
Ryder found that light-duty battery-electric vans increase annual operating costs by several percentage points, with the gap widening for heavier trucks. Operating battery-electric big rigs costs about twice as much annually as diesel trucks.
In California, converting a fleet of 25 commercial vehicles, including 10 heavy-duty trucks, from diesel to battery power would raise annual operating costs by 56%, or $3.4 million. In Georgia, the increase would be 67%, or $3.7 million. Ryder stated that these higher costs would add 0.5% to 1% to inflation.
The American Trucking Associations said of the U.S. EPA’s new rules mandating more BEV semi truck sales by the end of the decade: “Considering that 96% of U.S. trucking companies operate 10 or fewer trucks, these mandates are simply cost-prohibitive for most truckers.”
The US middle class and low-wage workers are back on the chain gang while the top 1% party hearty.
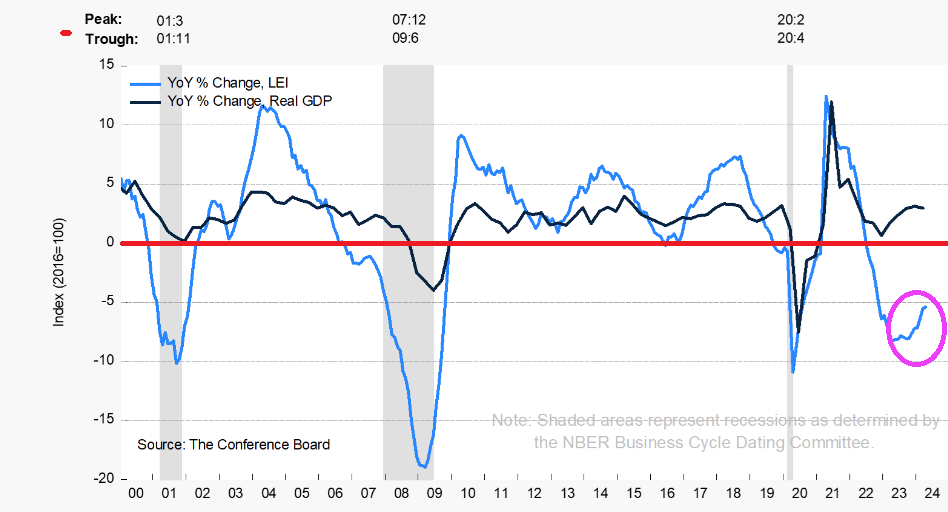
The Conference Board Leading Economic Index® (LEI) for the U.S. decreased by 0.6 percent in April 2024 to 101.8 (2016=100), after decreasing by 0.3 percent in March. Over the six-month period between October 2023 and April 2024, the LEI contracted by 1.9 percent—a smaller decrease than its 3.5 percent decline over the previous six months.
It is surprising that Americans trusts the millionaires in the Administration (like Biden) or Congress (like Schumer, McConnell, etc) to have our backs on the roaring inflation rate. At least Speaker Mike Johnson isn’t a millionaire … yet. But that might explain his selling out conservatives.
Bloomberg reports that PBoC Deputy Governor Tao Ling announced the new 300 billion yuan ($41.5 billion) nationwide program of cheap funding to allow state-owned companies to purchase unsold homes.
Ling said the funding will be directed at 21 providers, including policy banks, state-owned commercial lenders, and joint-stock banks. A rate of 1.75% will be offered. The low-cost loans have a one-year term and can be rolled over four times.
The new program powerfully signals that policymakers are pushing for property policy easing and measures to balance the supply-heavy housing market, which casts a dark cloud over the world’s second-largest economy. This announcement appears to be a step in the right direction in a national-level policy.
Also, on Friday, policymakers eased mortgage rules and removed the mortgage rate floors for first and second homes. PBoC also lowered the minimum downpayment ratio for first-time homebuyers to 15%. The downpayment ratio for second-home purchases was lowered to 25%.
Chinese Vice Premier He Lifeng said that authorities in cities with excess home inventories should purchase unsold properties and convert them into affordable housing. He also urged local governments to repurpose inactive land parcels held by property developers to alleviate their financial troubles.
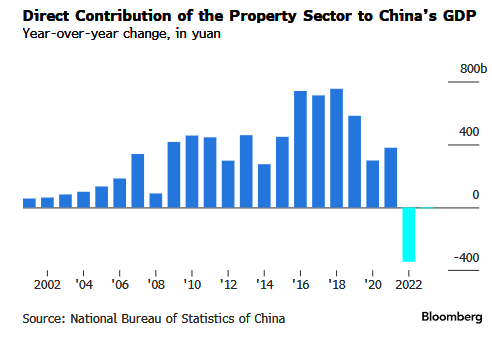
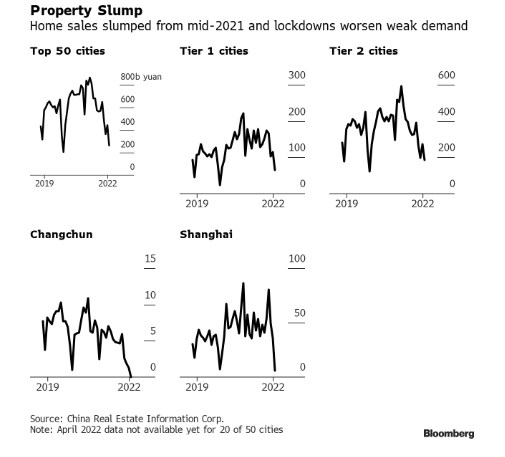
This was a very policy-heavy week to save the debt-stricken real estate market. Data showed that property investment and new home sales in April experienced larger contractions, while housing prices slid even further.
China’s ailing property sector is a drag on GDP.
Housing sales are tumbling.
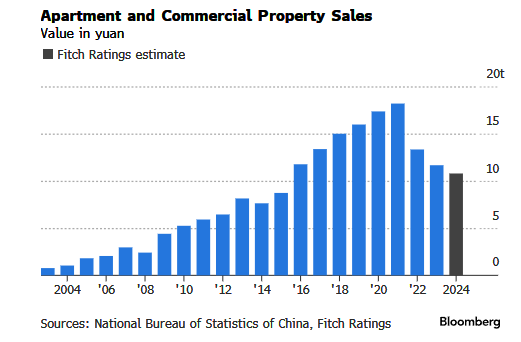
And apartment and commercial property sales are sliding.
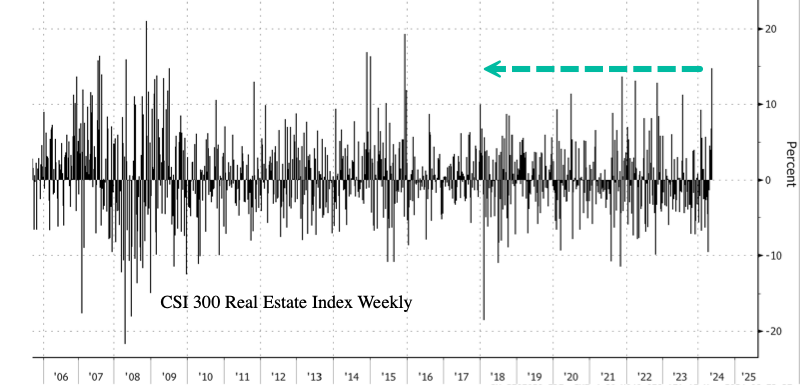
In markets, the CSI 300 Real Estate Index closed up 9%, with gains from April 24 totaling about 36%. Yet the latest gains in the property index are still 68% below the early 2018 peak.
The index’s weekly gain was the most since early December 2015.
It isn’t in a Communist countries’ DNA to let markets solve the problem … like letting prices correct no matter how painful that adjustment is. Biden and his “economic” advisor Jared Bernstein (not an economist but a public policy hack) would likely follow China’s idiotic solutions to the problem.
I debated Bernstein once at a Washington DC conference. He was arrogant but eventually confessed that he didn’t know anything about housing or mortgages. Nice economic advisor, Joe!
Middle of the road? Not for multifamily housing with starts down -33% year-over-year (YoY) in April!
Housing starts increased 5.7% in April to an annual rate of 1.36 million, down 0.6% from April 2023.
Single-family home starts fell 0.4% from March to an annual rate of 1.03 million, but were up 17.7 % compared to April 2023.
Housing permits dipped 3%.
But the bigger picture is … 5+ unit (multifamily) starts are down -33% in April. And while 1-unit (single-family detached) starts were up 17.7% YoY in April DOWN from 26% YoY in March.
Mortgage applications increased 0.5 percent from one week earlier, according to data from the Mortgage Bankers Association’s (MBA) Weekly Mortgage Applications Survey for the week ending May 10, 2024.
The Market Composite Index, a measure of mortgage loan application volume, increased 0.5 percent on a seasonally adjusted basis from one week earlier. On an unadjusted basis, the Index increased 0.3 percent compared with the previous week. The seasonally adjusted Purchase Index decreased 2 percent from one week earlier. The unadjusted Purchase Index decreased 2 percent compared with the previous week and was 14 percent lower than the same week one year ago.
The Refinance Index increased 5 percent from the previous week and was 7 percent higher than the same week one year ago.
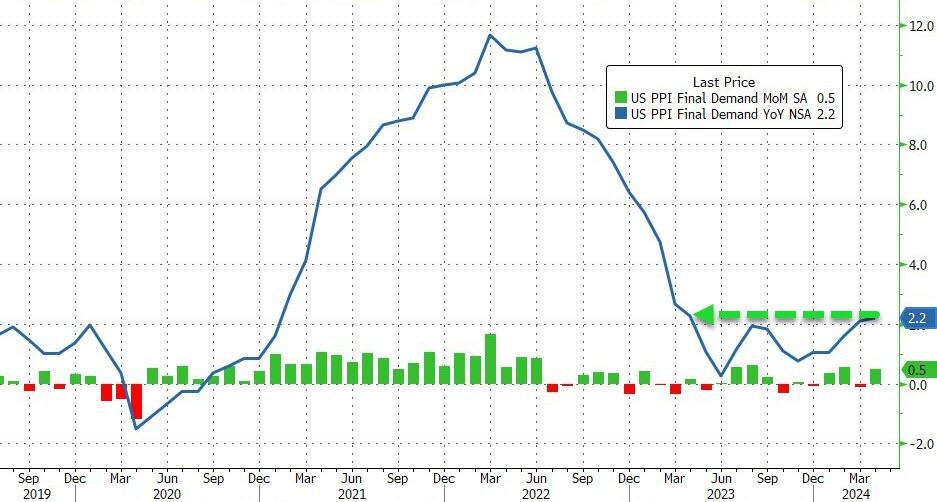
April Producer Prices rose 0.5% MoM (vs +0.3% exp), with March’s +0.2% MoM revised down to -0.1% MoM. The downward revision did not stop the YoY read rising to 2.2% (from +2.1% in March)…
Source: Bloomberg
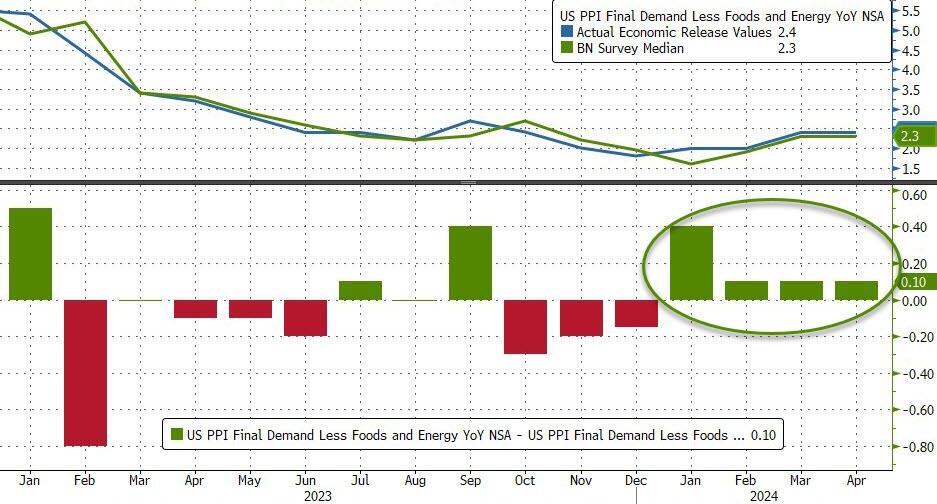
This is the highest YoY read since April 2023 and is the fourth hotter than expected headline PPI print…
Source: Bloomberg
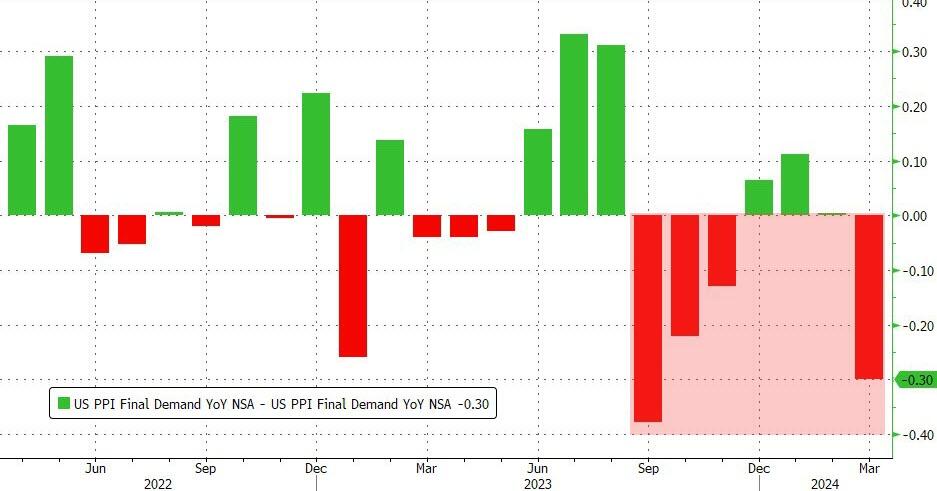
Producer Prices have been aggressively downwardly revised for 4 of the last 7 months…
Source: Bloomberg
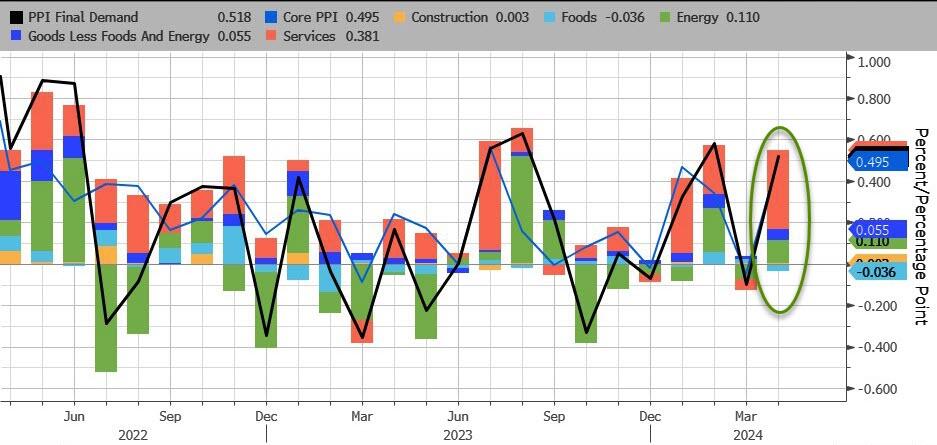
Services costs soared, dominating April’s PPI gains with Energy the second most important factor. Food prices actually declined on a MoM basis.
Source: Bloomberg
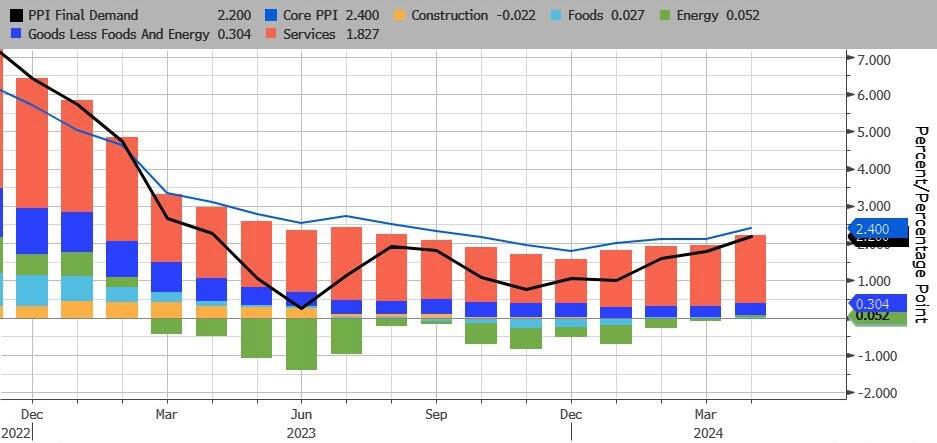
On a YoY basis, headline PPI’s rise was dominated by Services (rising at their hottest since July 2023). For the first time since Feb 2023, none of the underlying factors were negative on a YoY basis…
Source: Bloomberg
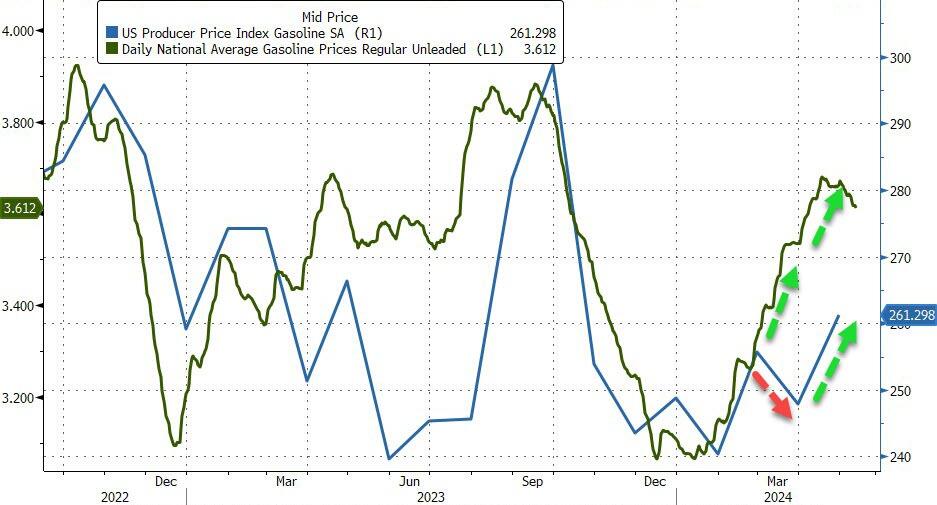
After last month’s farcical ‘seasonally adjusted’ gasoline price, April saw the PPI Gasoline index rise (with actual prices at the pump) but still has a long way to go…
Source: Bloomberg
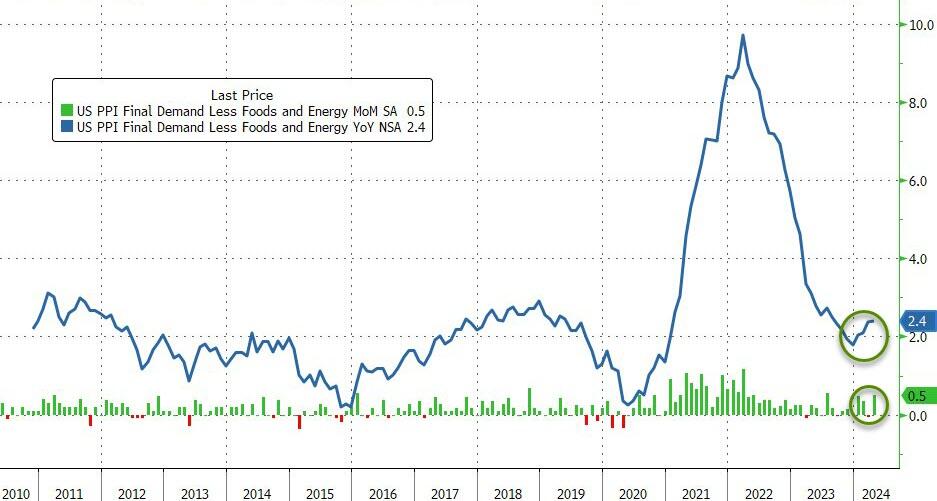
Core PPI was worse – rising 0.5% MoM (more than double the +0.2% MoM expected) – which pushed the Core PPI YoY up to +2.4%…
Source: Bloomberg
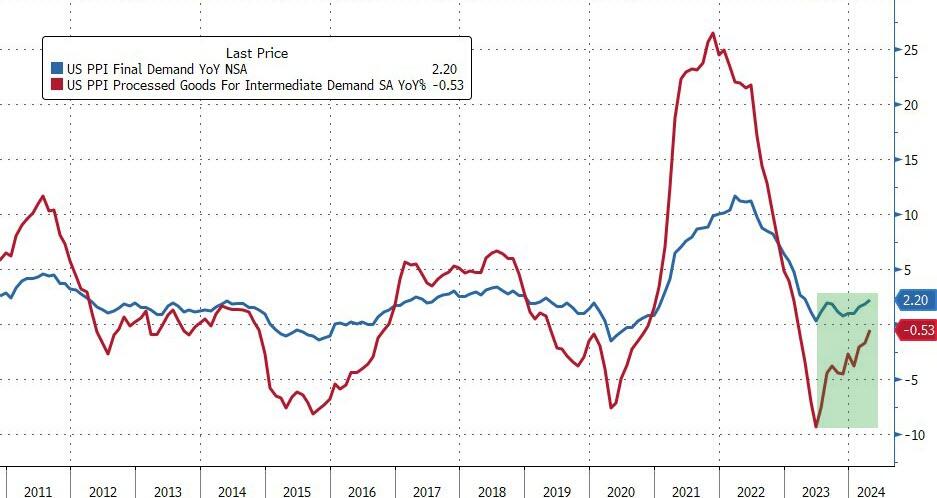
And finally US PPI Final Demand Less Foods Energy and Trade Services rose by 0.4% MoM and 3.1% YoY (the highest in 12 months).
Worse still the pipeline for primary PPI is not good as intermediate demand is starting to accelerate…
Source: Bloomberg
Over the past month, ‘higher prices’ have dominated ‘lower prices’ in recent survey data…
Higher producer prices:
New York Empire manufacturing price paid advanced to 33.7 from 28.7.
Philadelphia Fed manufacturing reported prices paid gained to 23.0 from 3.7 in March.
Philadelphia Fed non-manufacturing prices paid rose to 31.0 from 26.6 in the prior month.
Richmond Fed services prices paid rose to 6.11 from 5.43 in March.
Kansas City Fed manufacturing prices paid advanced to 18 from 17.
Kansas City Fed services input price growth continued to outpace selling prices.
S&P Global manufacturing input cost inflation quickened to hint at sustained near-term upward pressure on selling prices.
ISM Manufacturing prices paid gained to 60.9, the highest since June 2022, from 55.8 in March.
ISM Services prices paid notched up to 59.2, the highest since January, from 53.4 in March.
Lower producer prices:
New York Fed Services prices paid fell to 53.4 from 55.1 in March.
Richmond Fed manufacturing growth rates of prices paid dipped to 2.79 from 3.22 in March
Dallas Fed Manufacturing outlook reported prices paid for raw materials dropped to 11.2 from 21.1 in the prior month.
Dallas service sector input prices index nudged down to 28.8 from 30.4 in the prior month.
S&P Global Service saw input costs slowed from six-month highs in March.
Do you see the ‘flation’ now, Jay?
So, no, The Fed does not have inflation under control.


You must be logged in to post a comment.