What a mess Biden and his Progressive backers have made. And we are forced to suffer the consequeinces of his policies. Or follies!
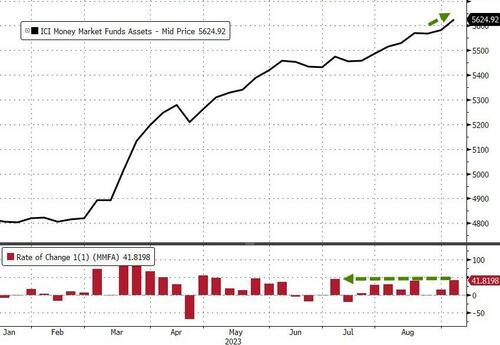
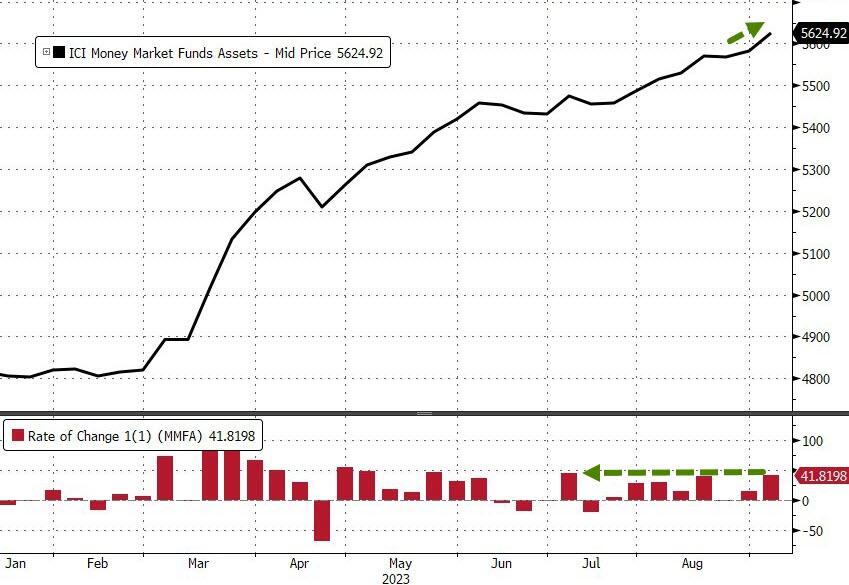
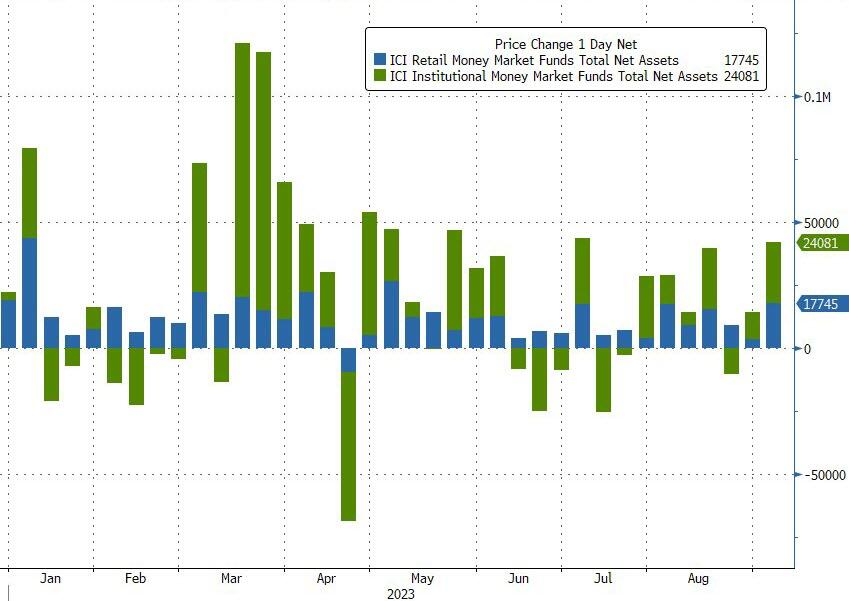
Money-market funds saw inflows for the 7th week of the last 8 with a $42BN jump (the most in 2 months) to a new record high of $5.625TN…
Source: Bloomberg
The inflow was dominated by a $24BN increase in Institutional fund assets while Retail also saw a sizable $17.7BN increase…
Source: Bloomberg
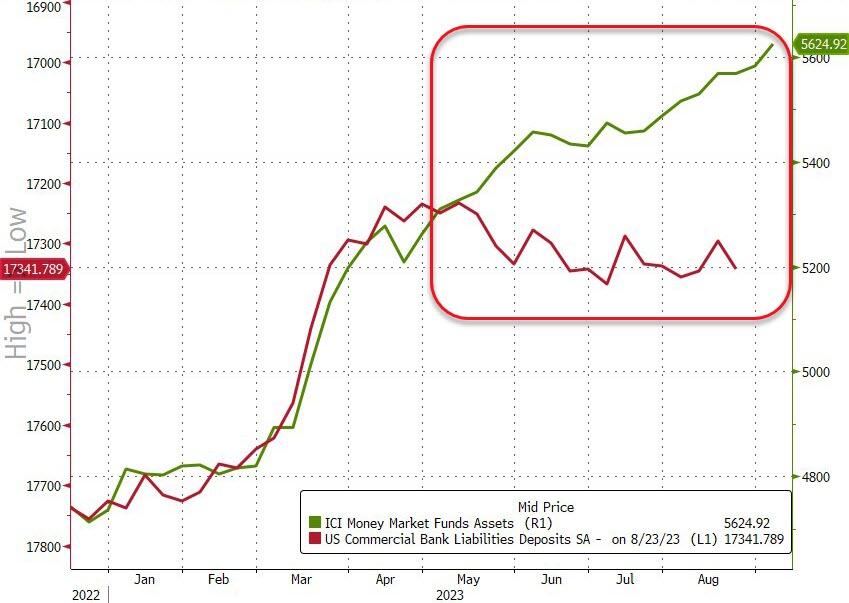
And the divergence between money-market fund assets and bank deposits continues to grow…
Source: Bloomberg
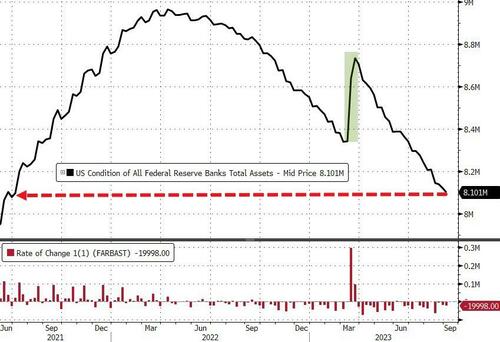
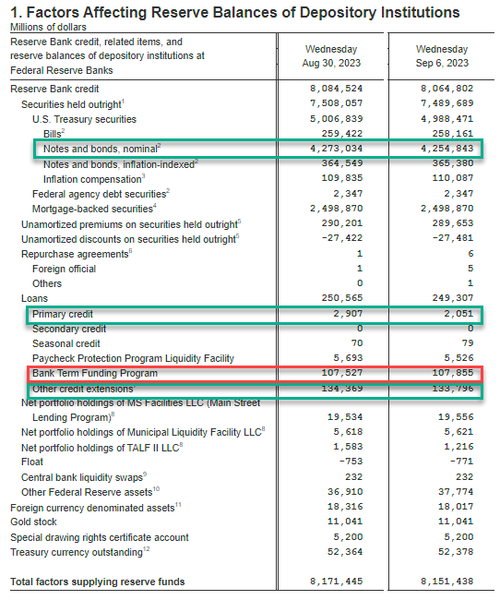
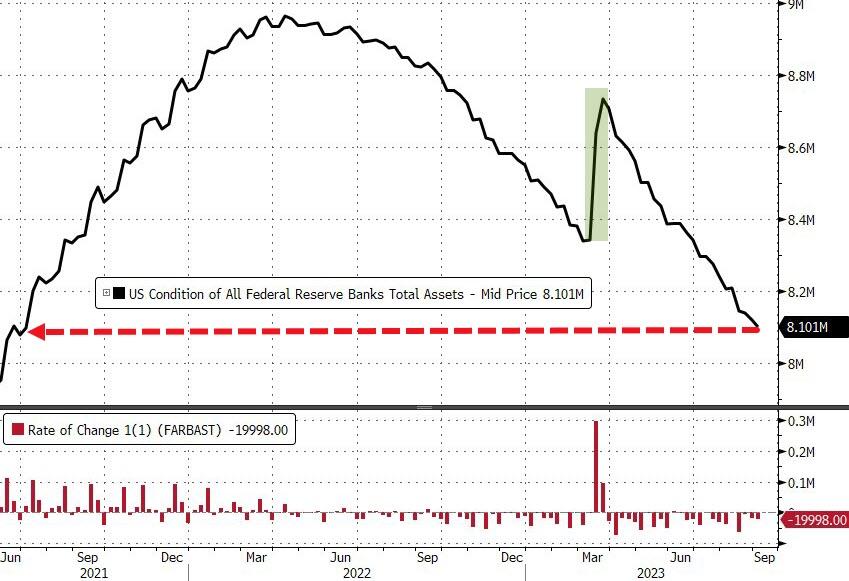
And while we actually saw huge deposit outflows (on a non-seasonally-adjusted basis) – despite The Fed’s seasonally-adjusted deposits increase – The Fed balance sheet shrank by another $20BN last week to its smallest since June 2021…
Source: Bloomberg
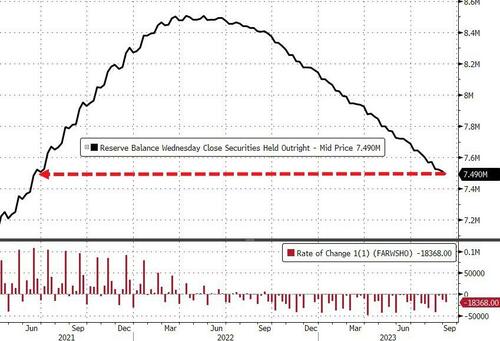
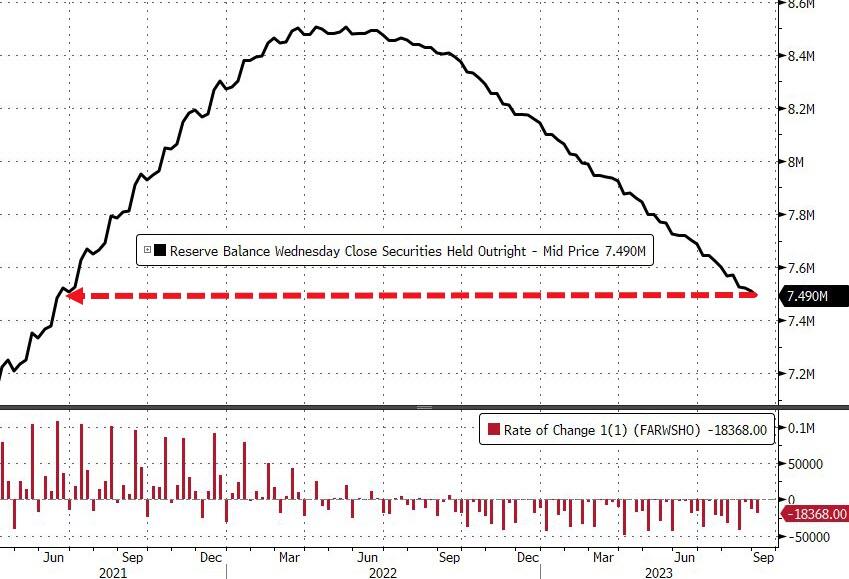
The Fed’s QT program continues apace with$18.4BN sold last week to its smallest since June 2021…
Source: Bloomberg
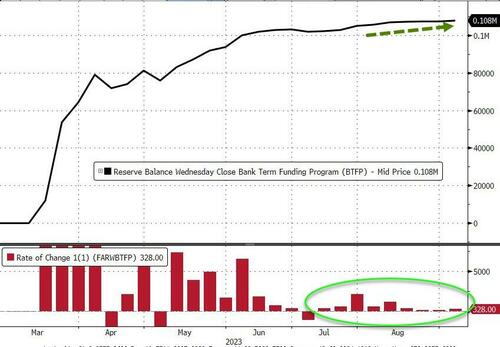
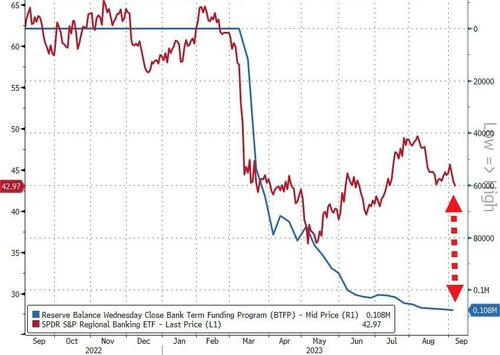
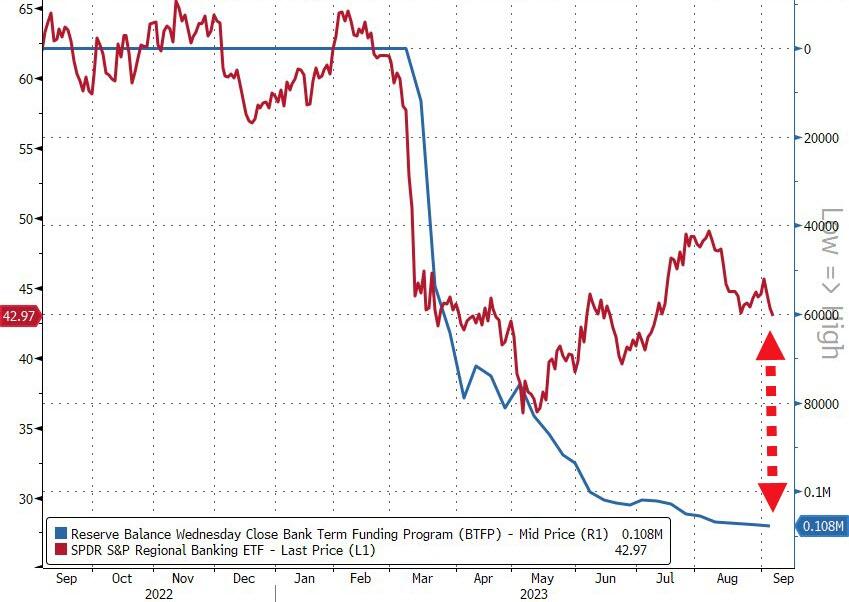
Usage of The Fed’s emergency bank funding facility jumped by $328 Million last week to a new high of $108BN…
Source: Bloomberg
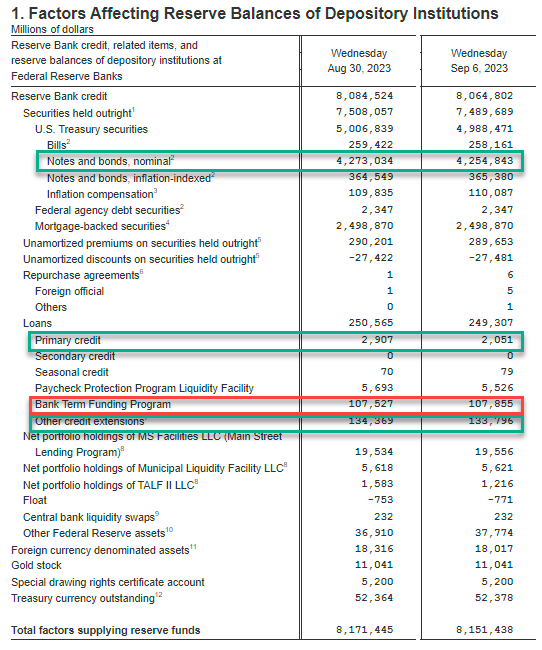
Fed BS weekly change:
Fed balance sheet QT (Notes and bonds decline): $4.255 trillion, down $18,2BN
Discount Window $2.1BN, down $800M from $.29BN
BTFP new record $107.9BN, up $400MM
Other Credit Extensions (FDIC Loans): $133.8BN, down $0.6BN from $134.4BN
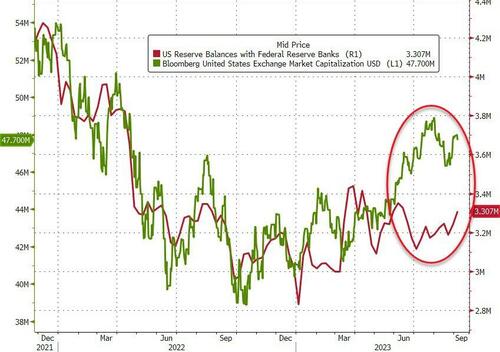
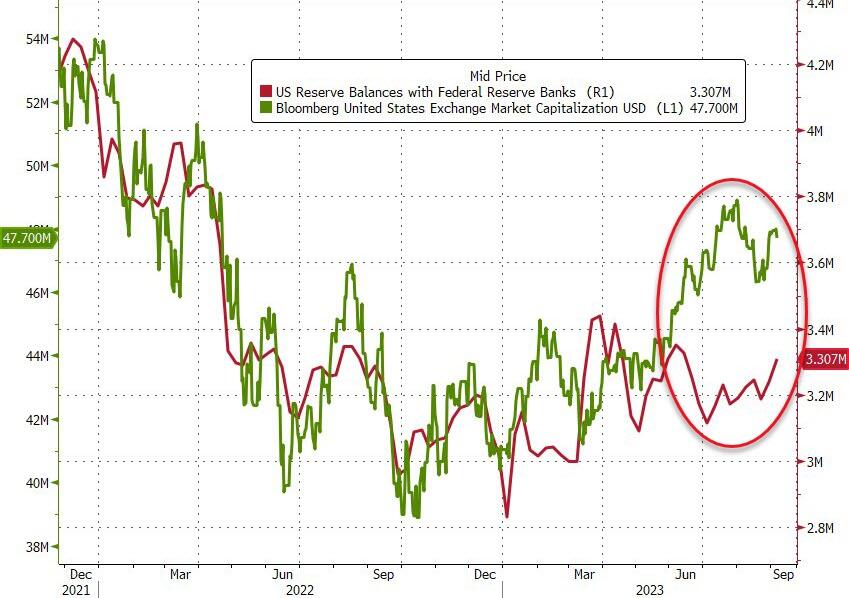
Finally, US equity markets and bank reserves at The Fed have converged a little recently, but the gap remains wide (thanks to the plunge in reverse repo balances)…
Source: Bloomberg
Tick, tock, banks!
Source: Bloomberg
You have six months to figure out how to clean up the $108 Billion hole in your balance sheet that you’re currently paying The Fed’s exorbitant rates to fill.
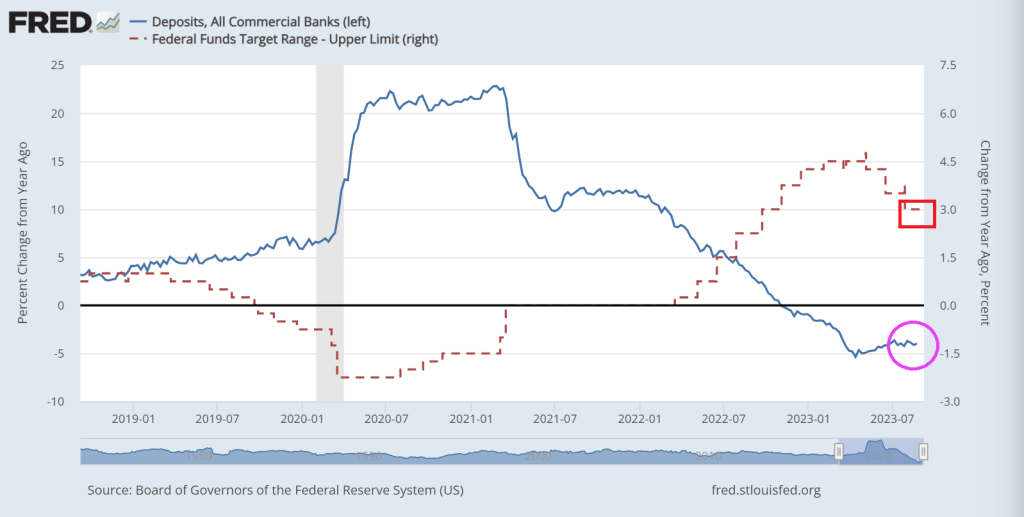
Bank deposit growth remains negative as The Fed tightens its overly accomodative monetary policy.
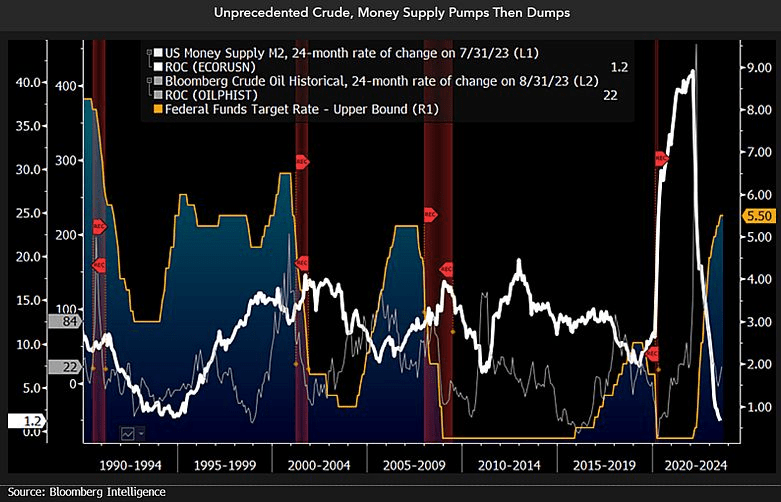
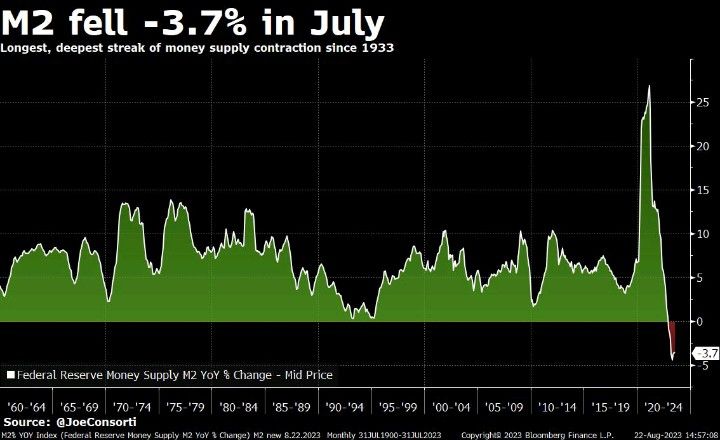
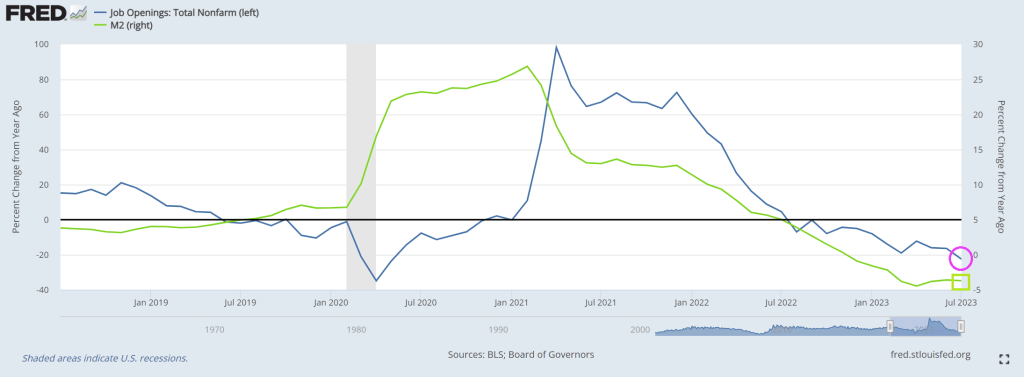
And then we have this chart showing plinging M2 Money (white line fever).
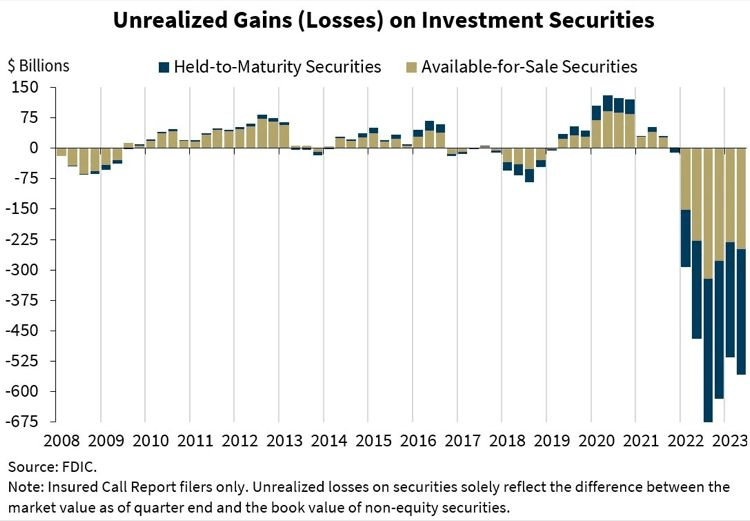
And the horrific unrealized losses on bank’s books.
Bidenomics is failing America. Primarily because Biden was one of the stupidest members of the US Senate. Not to mention nasty. Great President, America! /sarc
As Bidenomics fails to do anything other than make big donors wealthier (green energy companies, big tech and union bosses, etc), we are seeing the impacts of Fed monetary tightening to combat inflation caused by Biden/Pelosi/Schumer’s spending spree.
First, the 10-year REAL Treasury yield is close to breaching 2%.
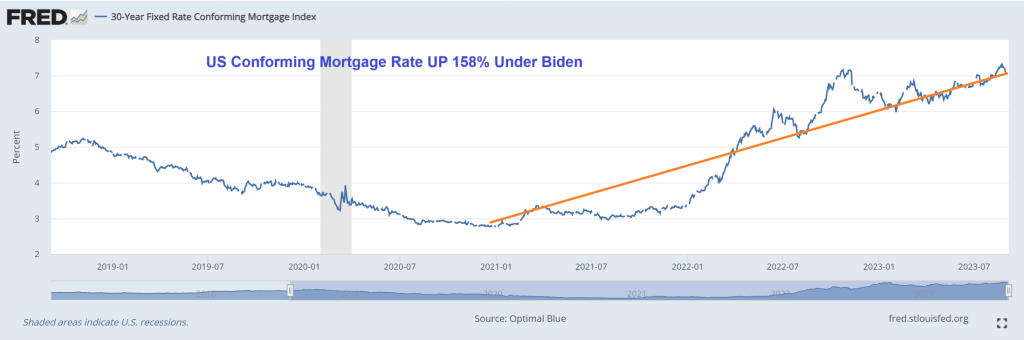
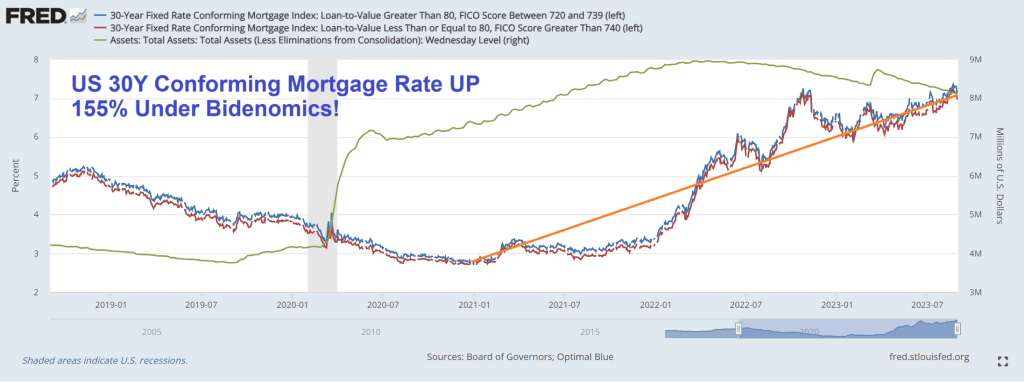
Second, 30-year mortgage rates are now 7.62%, up over 150% under Bidenomics.
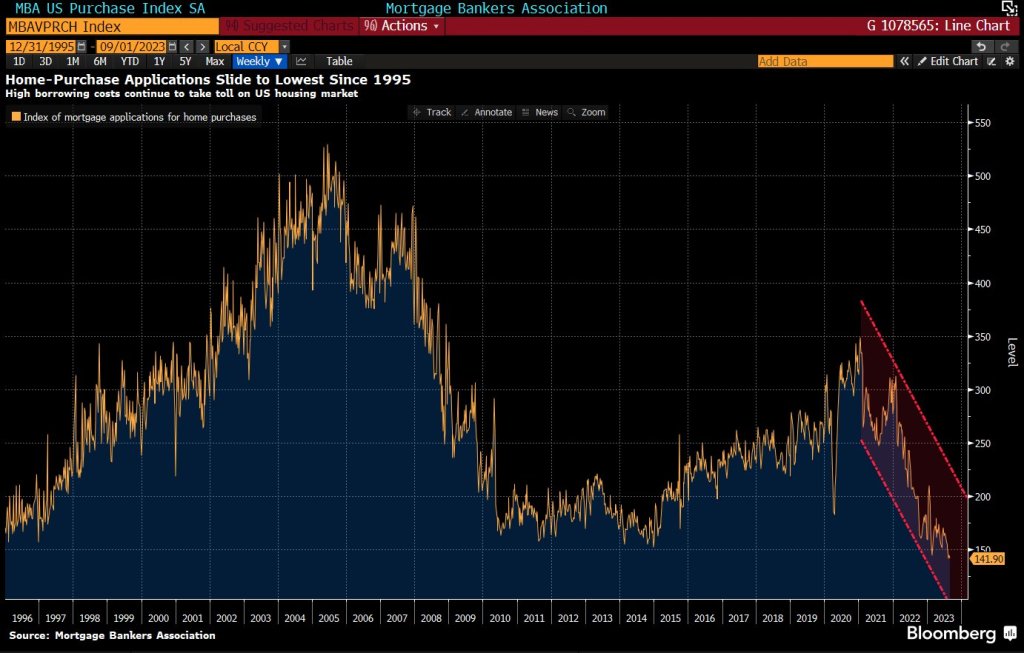
Third, mortgage purchase applications crashed to the lowest level since 1995.
Fourth, the 2-year Treasury yield just breached 5%.
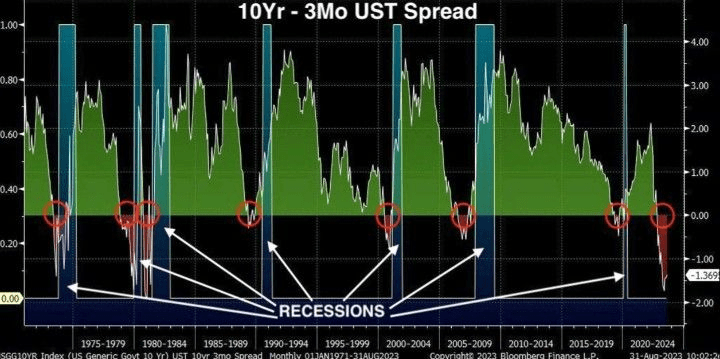
Fifth, the 10Y-2Y yield curve remains deeply inverted.
Speaking of Bidenomics, US mortgage purchase demand just declined to the lowest level in 28 years.
Mortgage applications decreased 2.9 percent from one week earlier, according to data from the Mortgage Bankers Association’s (MBA) Weekly Mortgage Applications Survey for the week ending September 1, 2023.
The Market Composite Index, a measure of mortgage loan application volume, decreased 2.9 percent on a seasonally adjusted basis from one week earlier. On an unadjusted basis, the Index decreased 5 percent compared with the previous week. The Refinance Index decreased 5 percent from the previous week and was 30 percent lower than the same week one year ago. The seasonally adjusted Purchase Index decreased 2 percent from one week earlier. The unadjusted Purchase Index decreased 5 percent compared with the previous week and was 28 percent lower than the same week one year ago.
This is not good.
Bank deposits, a source of bank lending, are down -4% YoY as The Fed tightens rates.
Here is Lefty Frizzell’s original version of the Bidenomic’s themesong “If you’ve got the money, honey,I’ve got the time.” Like big donors receiving green energy subsidies. But not middle class mortgage borrowers.
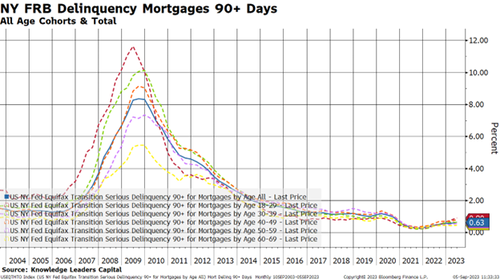
Thanks to Bidenomics, code for massive Federal spending on green energy initiatives and payoffs fo large donors, we have agonizing inflation and consumers are borrowing more and more to cope with inflation. And with the increased use of debt comes …. drumroll … delinquenices!
The US conforming mortgage rate is UP 158% under Bidenomics.
Let’s move on to some forms of consumer loans, where the story is a little more daunting.
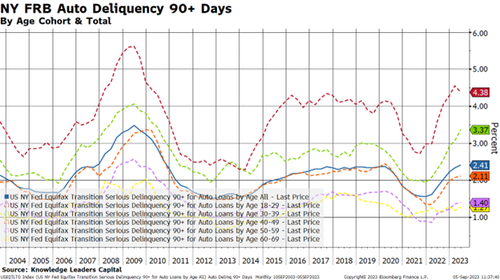
Auto loans are definitely the epicenter of the credit cycle. While the overall average is a still somewhat tame 2.41%, younger borrowers are not keeping up. Younger borrowers have delinquency rates that are 1-2% higher than the average while the inverse is true for older borrowers. Eighteen-to-thirty-nine year-old borrowers have the highest delinquency rate in 13 years.
Somehow, I sense that used car lots are going to start filling up again as these vehicles get repossessed. This should put downward pressure on used car prices, bringing that element of inflation down. This is one of the channels through which monetary policy works.
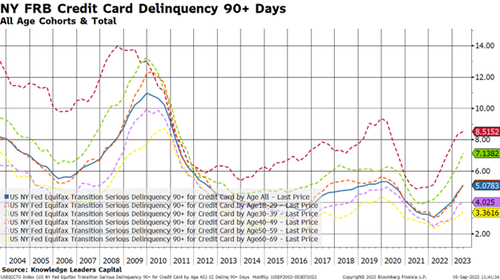
Lastly, I’ll take a look at credit card delinquencies.
Here is where we can really see the stresses building.
First, the overall delinquency rate has about doubled from 2.5% to 5% over the last couple years.
Second, older borrowers have seen a tick up in delinquency rates, a feature we don’t really see in other credit products.
Third, one in 12 younger 18-29 year-old borrowers are 90+ days late making their credit card payments.
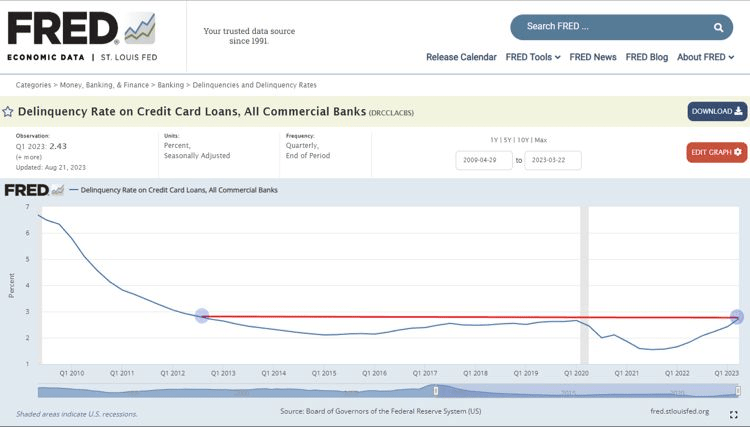
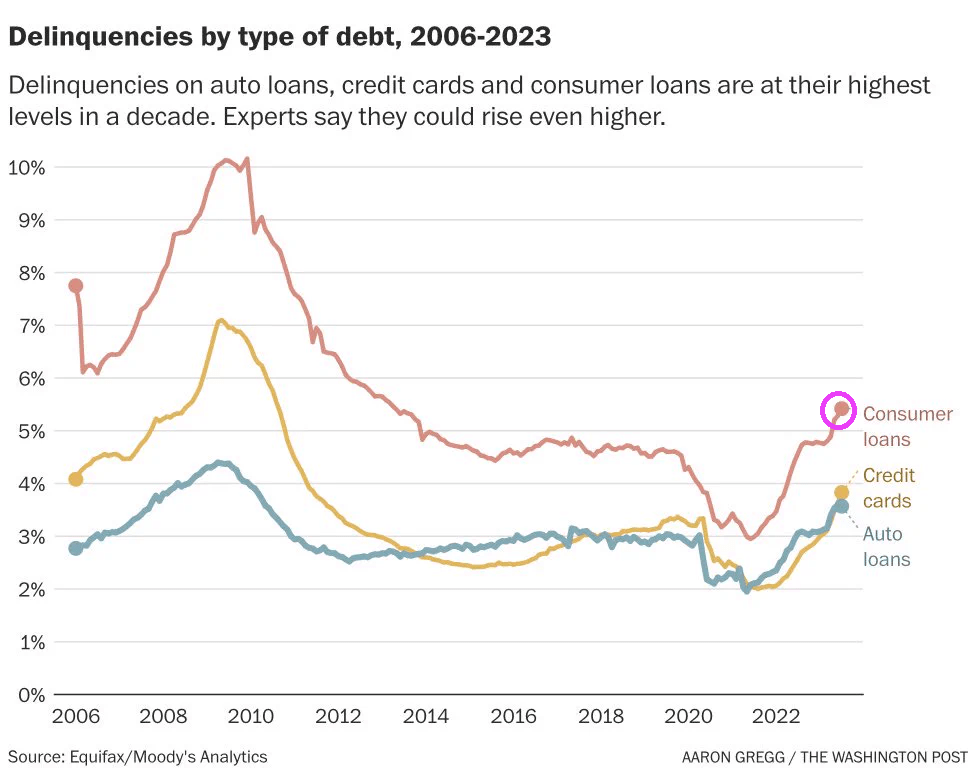
Credit Card Delinquency Rate across all commercial banks hit 2.77% in the 2nd quarter, the highest level in more than a decade.
In conclusion, we are in the early days of a consumer credit cycle. Younger borrowers are the weakest link in this analysis, and this makes me wonder where rates go when student debt payments turn back on at the end of the month.
The cost of living has been soaring, and our standard of living has been steadily going down.
Coping with inflation is tough for American households where consumer debt is up 19.$ under Biden while the free-spending Federal government’s public debt is up only 16.5%.
“In July 2023, 61% of U.S. consumers live paycheck to paycheck, unchanged from June 2023, but 2 percentage points higher than July 2022. Generally, more consumers of all income brackets reported living paycheck to paycheck in July 2023 than last year,” Alia Dudum, a money expert at LendingClub told FOX Business.
Now, 78% of consumers earning less than $50,000 a year and 65% of those earning between $50,000 and $100,000 were living paycheck to paycheck in July, both up from a year ago, LendingClub found. Of those earning $100,000 or more, only 44% reported living paycheck to paycheck.
Because consumers have so little disposable income these days, retailers all over the nation are experiencing difficulty.
In fact, UBS is projecting that 50,000 stores could close in the United States by the end of 2027…
Analysts at investment bank UBS are forecasting that some 50,000 U.S. stores are likely to close by the end of 2027, because of expected cutbacks in consumer spending, tighter credit and the continued shift to ecommerce.
Store closings could accelerate to 70,000 to 90,000 if retail sales turn out to be weaker than expected, according to UBS.
Actually, I think that losing 50,000 stores is a wildly optimistic scenario.
Hopefully I am wrong about that.
The housing market has also been going haywire.
According to Fortune, the month of August “will become the worst month for housing affordability this century”…
On Monday, the average 30-year fixed mortgage rate reached 7.48%, marking the highest level since the year 2000. Even prior to this recent surge in mortgage rates, housing affordability, as monitored by the Atlanta Fed, had already deteriorated beyond the levels seen at the housing bubble’s peak in 2006. Once this latest mortgage rate surge is factored in, August 2023 will become the worst month for housing affordability this century.
Wow.
Thanks Delaware Joe Biden (as opposed to Country Joe Stalin).
Home prices are going to have to come down, and in some areas they have already fallen quite a bit…
Homeowners are sitting on a negative equity timebomb after losing $108.4 billion on their property values this year, experts say.
The average borrower saw their home equity plummet by $5,400 in the first quarter of 2023 compared to last year – with households in Washington, California and Utah worst affected.
Do you remember the housing crash of 2008 and 2009?
Well, now the next housing crash is here, and it isn’t going to be fun.
For a while there, Joe Biden and his minions could at least boast about the employment market.
But now large companies all over America are laying off workers, and it is being reported that a staggering 1.223 million native-born Americans lost their jobs during the months of July and August…
Staggering figures have revealed that over 1.2 million US-born workers lost their jobs last month while the foreign-born workforce increased by nearly 700,000 – as migrants continue to flood across the border under the Biden administration.
Data from US Bureau of Labor Statistics show that between July and August, there was a staggering decrease of 1.223 million native-born people in the workforce – which is a low not beaten since the jobs crash when Covid hit in April 2020.
The numbers that I have shared with you are nothing to brag about.
But Joe Biden is going to keep trying to pull the wool over the eyes of the American people anyway.
Unfortunately for Biden, it has become quite clear that most Americans have lost faith in him. According to the same Wall Street Journal poll that I mentioned above, 73 percent of U.S. voters now believe that Biden “is too old to run for president”…
For Biden, one of his biggest challenges is age. The Wall Street Journal poll found that about 73% of voters think Biden is too old to run for president while only 47% think Trump is too old. Thirty-six percent of voters think that Biden is mentally up for the job while 46% of voters think Trump is mentally capable of being president.
We have never seen numbers like this for any other president.
Sadly, Biden fully intends to run again. (Especially since half-wit Jill Biden is allegedly running The White House).
And the Democrats will get behind him, because at this point no other candidate is posing a serious threat to Biden. Wait, not Gavin Newsom who almost single handedly destroyed California or Michelle Obama who has absolutely no qualifiications?? Other than being Barry Soetoro’s wife?
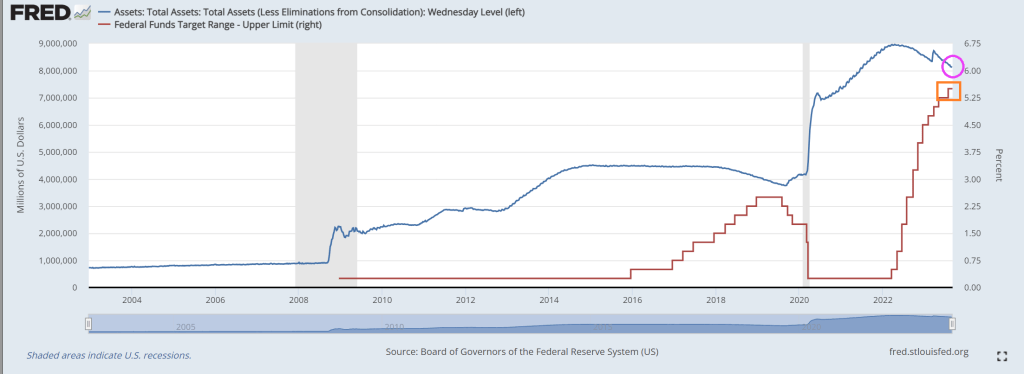
Under Bidenomics, there is still too much Fed monetary stimulus in the form of >$8 trillion on its balance sheet. While the biggest surge in Fed activity occurred with Covid, The Fed has added 10% to its balance sheet under Billions Biden.
Despite not backing off the assets purchases by The Fed, conforming 30Y mortgage rate is still up 155% under Bidenomics.
Yes, The Fed is raising its target rate to cool inflation, but doing little with its balance sheet.
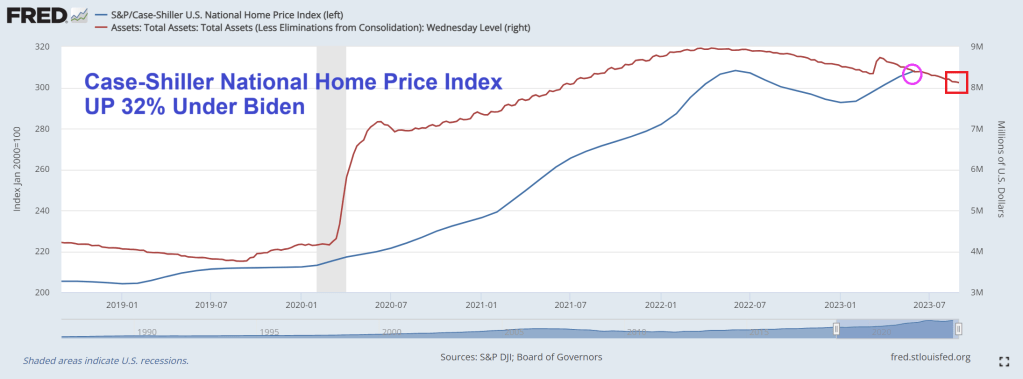
The Case-Shiller national home price index is up 32% under Vacation Joe!
It seems prices are out of control and The Fed refuses to trim its balance sheet. But don’t worry, Vacation Joe is probably on yet another vacation while Maui and Flordia suffer and The Ukraine war is seeing bodies pile up. Meanwhile, he still hasn’t visited East Palestine Ohio like promised.
The glories of Bidenomics is on fully display. Despite what Lyin’ Biden says, Bidenomics is only working for the elites (top 1%). How Soviet/CCP command economy of him!
Here is an ugly chart showing Bidenomics in action! We all know that Covid unleashed a torrent of Fed monetary stimulus AND Federal spending on Covid relief and green energy subsidies (most to large Democrats donors). BUT we now have experienced 3 consectutive quarters of negative gross domestic income (GDI) growth. And nominal GDI growth is falling with falling M2 Money growth.
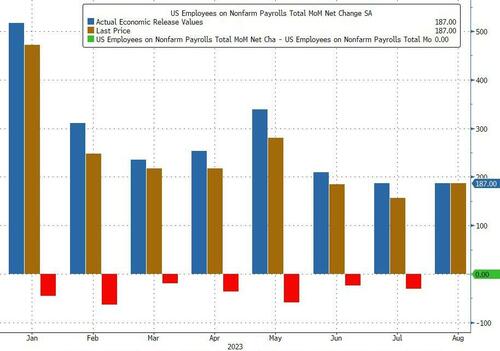
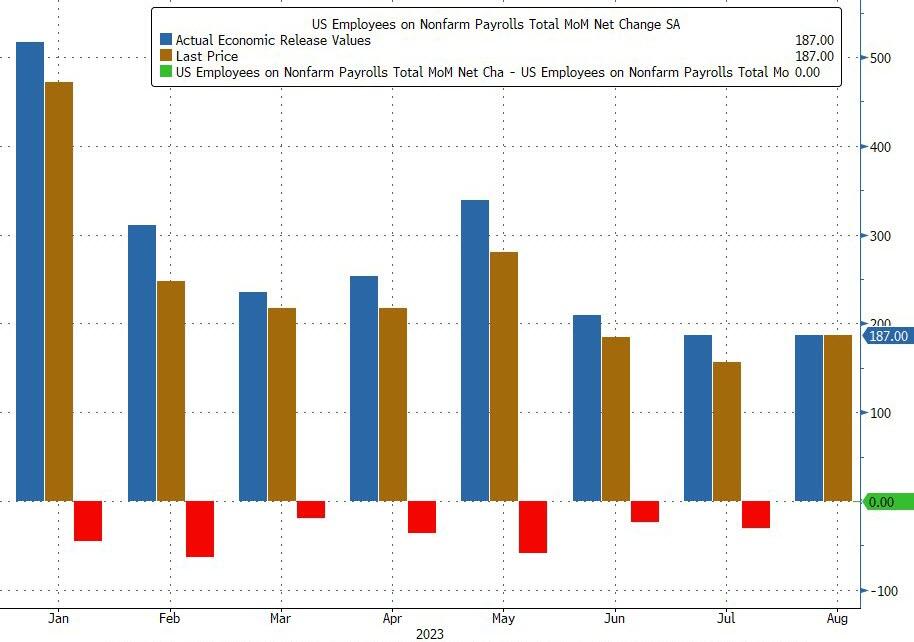
And today’s jobs report for August showed that only 187k jobs were added.
Superficially this would have meant an unchanged print from last month when the BLS also reported 187K jobs, however in keeping with recent trends that number was revised – drumroll – lower again, to 157K, meaning that every single monthly payrolls print in 20-23 has been revised lower (see chart below), a 12-sigma probability and virtually impossible unless there was political pressure to massage the data higher initially and then revise it lower when nobody is looking. (As if the mainstream media is at all honest!)
But wait there’s more: while July was revised down by 30K from +187,000 to +157,000, June was revised even more, by 80,000, from +185,000 to +105,000, which means that a number that was originally reported as 209K has been reivsed 50% lower, to 105K and a collapse vs original expectations of 230K. Here, the BLS was proud to report that “with these revisions, employment in June and July combined is 110,000 lower than previously reported.”
And we have The Conference Board’s confidence index at -65. Yikes!
Finally, we have the 10Y-3M UST spread SCREAMING recession!
So, the economy is slowing under Bidenomics and Cadavar Joe.
Will Cadavar Joe actually go out on the campaign trail and debate ANY Democrat or Republican?? Remember, this is the man with the nuclear launch codes.
Another economic report on Bidenomics. This one is for housing.
Realtors Pending Home Sales Index (PHSI)* – a forward-looking indicator of home sales based on contract signings – rose 0.9% to 77.6 in July. Year over year, pending transactions fell by 14.0%. An index of 100 is equal to the level of contract activity in 2001.
Combine that with crashing M2 Money growth (lowest since 1933 and The Great Depression (and The Dust Bowl). The difference is that the US had the soothing talks of Franklin Roosevelt “I can assure you that it is safer to keep your money in a reopened bank than under the mattress.” —President Franklin Roosevelt in his first Fireside Chat, March 12, 1933. Unfortunately, we have Joe Biden, the WORST public speaker in history and a completely unempathetic person.
Delinquencies on auto loans, credit cards and consumer loans are at their highest levels in a decade.
Instead of Sleepy Joe, Middle Class Joe, Corrupt Joe (sounds like Cuppa Joe), and any of the multitude of unflattering nicknames, we now have REVEREND JOE.
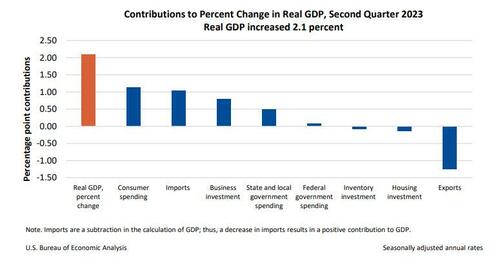
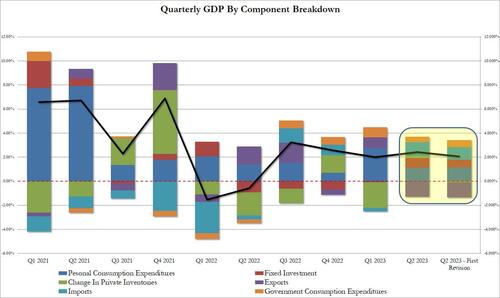
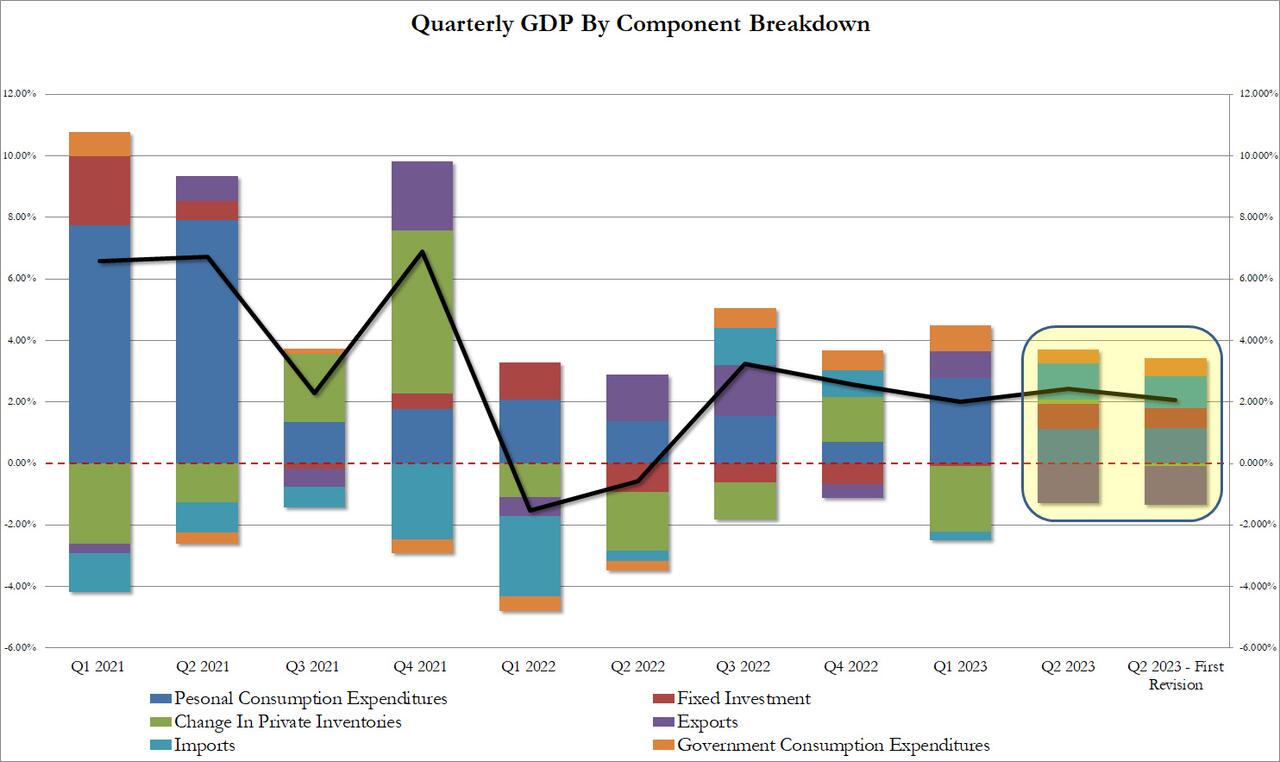
The GDP estimate released today is based on more complete source data than were available for the “advance” estimate issued last month. In the advance estimate, the increase in real GDP was 2.4 percent (refer to “Updates to GDP”). The updated estimates primarily reflecteddownward revisions to private inventory investment and nonresidential fixed investmentthat were partly offset by an upward revision to state and local government spending.
The increase in real GDP reflected increases in consumer spending, nonresidential fixed investment, state and local government spending, and federal government spending that were partly offset by decreases in exports, residential fixed investment, and private inventory investment. Imports, which are a subtraction in the calculation of GDP, decreased.
The revision according to the BEA, “reflected a smaller decrease in inventory investment and an acceleration in business investment. These movements were partly offset by a downturn in exports and decelerations in consumer spending and federal government spending. Imports turned down.” In short, everything was uglier,
Taking a closer look at the data, we find the following changes to the bottom line:
Personal consumption added 1.14% to the bottom line print or just over half, up from 1.12% in the original print; annualized this comes out to 1.7% which was below the 1.8% estimate.
Fixed investment contributed 0.66%, down from 0.83%
Change in private inventories now subtracting 0.09% from the bottom line number, a big swing from the positive 0.14% print in the original estimate. And it will be revised even lower next month as more of the “shrink” emerges.
Net exports were also revised lower, with gross exports trimmed from -1.28% to -1.26%, while imports were revised from 1.16% to 1.04%
Finally the ever handy plug that is government consumption (which is a garbage concept since the government does not actually create anything of economic value in the economy but merely allocated graft and embezzlement of public funding), actually rose from 0.45% to 0.58% (of bottom line GDP). Without this revision, Q2 GDP would have printed below 2.0%
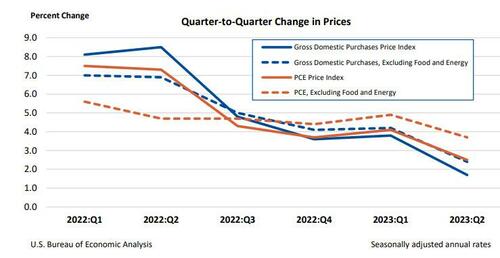
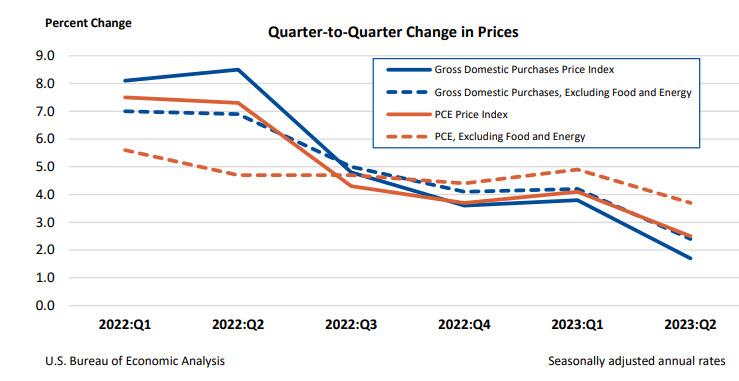
Separately, gross domestic purchases prices, the prices of goods and services purchased by U.S. residents, increased 1.7% in the second quarter after increasing 3.8 percent in the first quarter, above the 1.6% estimate last month but below the consensus 1.8%. Excluding food and energy, prices increased 2.4% after increasing 4.2%.
Personal consumption expenditure (PCE) prices increased 2.5% in the second quarter after increasing 4.1% in the first quarter. Excluding food and energy, the PCE “core” price index increased 3.7% after increasing 4.9%. This number was also revised lower from 3.8% and missed estimates of 3.8%.
Finally, the BEA reported corporate profits decreased 0.4% at a quarterly rate in the second quarter after decreasing 4.1% in the first quarter. Profits of domestic financial corporations decreased 12.1% after decreasing 2.3 percent. Profits of domestic nonfinancial corporations increased 0.9% after decreasing 5.0 percent. Profits from the rest of the world (net)increased 4.4 percent after decreasing 2.0 percent. Corporate profits decreased 6.5 percent in the second quarter from one year ago.
Needless to say, all this is a far cry from the rebound in corporate profits that companies themselves reported in their various GAAP and non-GAAP metrics, which is to be expected in a world where there is now an uncrossable chasm between economic data and its government fabrications.
Then we have M2 Money collapsing, down -3.7% in July. Longest, deepest contraction of money suppy since 1933.
Biden, making Zelenskyy rich again!! The US bought Zelenskyy a new villa! “The document indicates that the villa was purchased by Zelenskyy’s mother-in-law in May 2023. The price of the villa is 150,000,000 Egyptian pounds or approximately $4,850,000.” Thanks Biden!!! America last!


You must be logged in to post a comment.