“One of the most cowardly things ordinarily people do, Is to shut their eyes to facts.” – C.S. Lewis
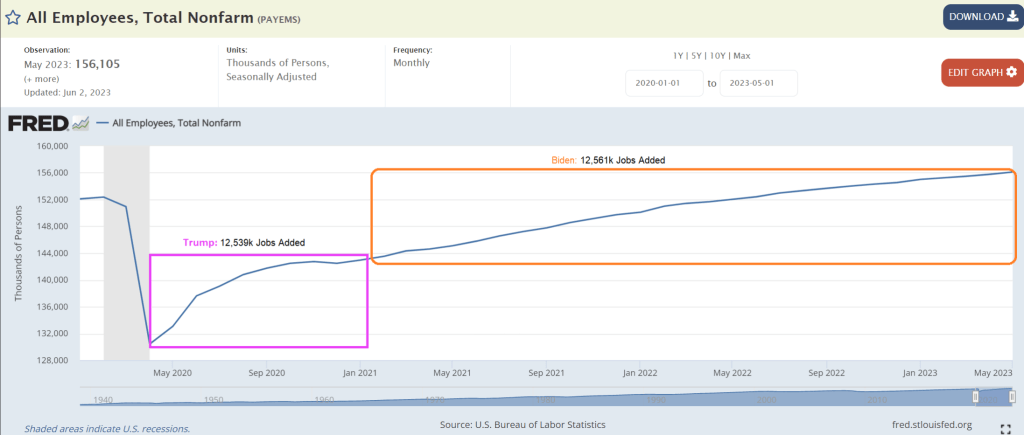
Okay, we know Biden lies constantly and misrepresents facts (hey, he is a politician like Adam Schiff (D-CA). But this graphic praising Bidenomics with Biden having created the most jobs (average per month) since Carter (notice they left out Democrat darling Jimmy Carter!!!). In this absurd graphic, Biden wins by “creating” over 400k jobs per month while Trump lost jobs per month. Riveting … except that it is completely misleading.
Actually, the US economy added 12.53 million jobs after April 2020 (Trump) while Bidenomics created took 2 1/2 years to add 12.56 million jobs. So, Biden took over twice as long to create jobs after Covid than it did under Trump. Simply opening the economy and schools produced that magical claim by Biden. And the National Teacher’s Union and Randi Weingarten worked with Fauci to orchestrate shutting down schools. Blaming Trump for local governments shutting down the economy is pure bunk.
12.53 millions jobs added / 8 months = 1.56 million jobs average per month. Biden? 12.56 million jobs added / 30 months = .43 million jobs average per month. So, Trump averaged more than 3x the job growth post-Covid than Biden.
Here is the “glories of Bidenomics” from the White House. As Biden likes to say, pure malarkey!
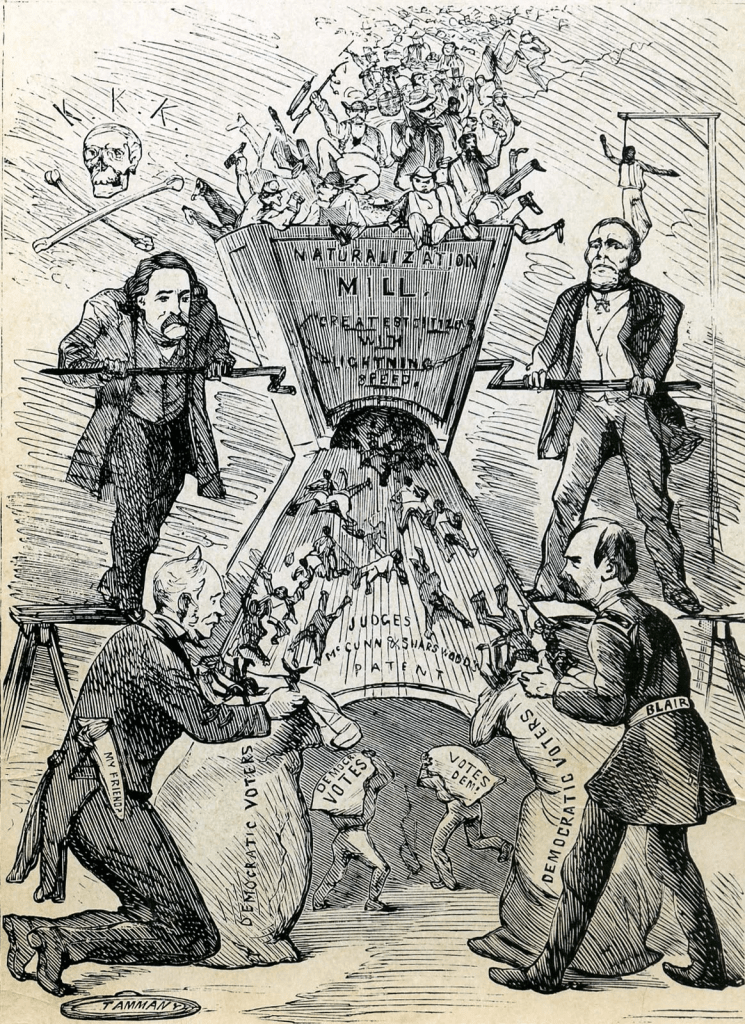
I wonder if the Democrat Party is a rebirth of New York City’s Tammany Hall corrupt political movement of the 1800s? Is Biden Boss Tweed? Or is Obama Boss Tweed with Biden as his nasty, dimwitted henchman?
In 1871, Thomas Nast denounces Tammany as a ferocious tiger killing democracy. The image of a tiger was often used to represent the Tammany Hall political movement. Sounds an awful lot like today’s Democrat Party.
US average hourly earnings continued at 4.4% year-over-year (YoY). However, the last core inflation reading was 4.8% YoY, so real wages continue to decline.
Rent CPI for June was 7.8% YoY.
Here is the rest of the story.
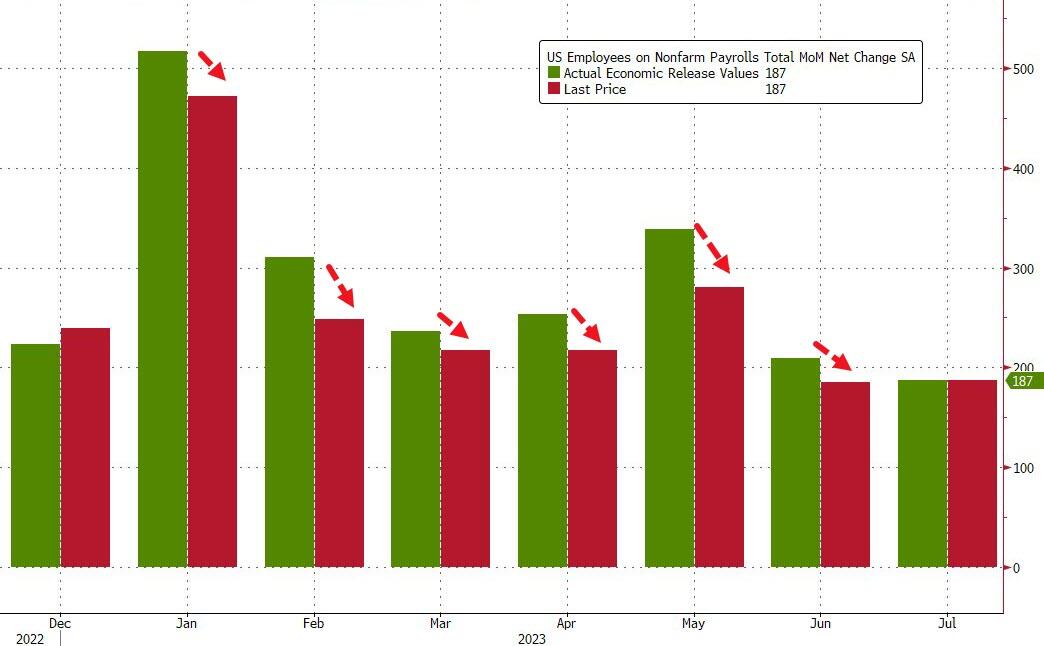
In keeping in with Biden admin’s penchant of constantly fabricating data, both May and June numbers were revised sharply lower of course:
May revised down by 25,000, from +306,000 to +281,000
June was revised down by 24,000, from +209,000 to +185,000.
To show just how ridiculous the data manipulation is, consider this chart – every monthly payrolls report in 2023 has been revised lower.
And on the disappointing jobs report and massive revisions of past data (the REAL inflation plaguing the nation is The Federal goverment lying about data), the US Treasury 2 year yield dropped like Biden on a flight of stairs.
Here are the faces of Washington DC. Lies, corruption, government for sale to highest bidder, cynacism, oppression, fear mongering, etc. This is Biden’s legacy.
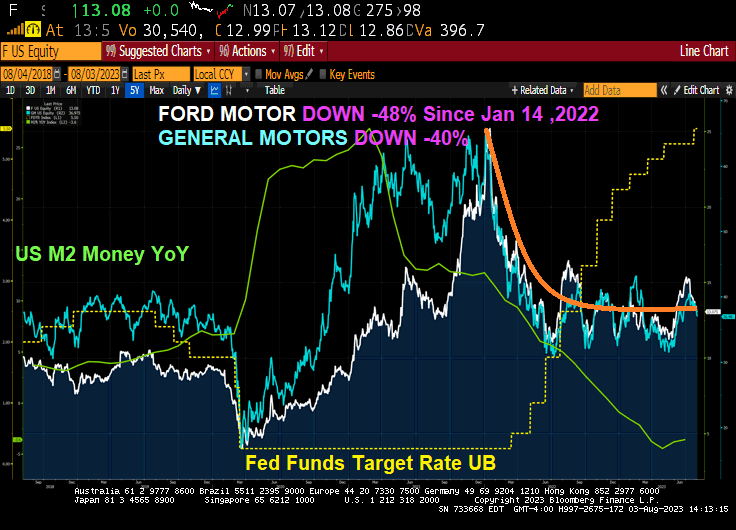
Bidenomics, the term for “Government Gone Wild! in terms of spending and EPA regulations, is a disaster for the US middle class and low wage workers. Even the 1% are now hurting if bought into Biden’s green lunacy. Ford is now down -48% since January 14, 2022 as The Fed started raising rates to fight inflation. GM is down “only” -40%.
So far this year, the division has lost $1.8 billion and this year’s $4.5 billion loss figure blows away last year’s $2.1 billion loss. Ford also announced that its electric F-150 pickup trucks will undergo a price cut, according to Fox.
Ford beat earnings on Thursday and reported adjusted EPS of $0.72, beating expectations of $0.54. It posted revenue of $45 billion and adjusted EBITDA of $3.8 billion, above estimates of $3.15 billion.
The company also raised its guidance, forecasting adjusted EBIT of $11 billion to $12 billion from $9 billion to $11 billion. The company is now guiding for free cash flow of $6.5 billion to $7 billion, from $6 billion.
But reality has sunk in about the company’s comments regarding its EV production schedule and spending plans. Price cuts in the industry, led by Elon Musk and Tesla, have thrown Ford’s production targets into a tailspin and Morgan Stanley noted on Friday morning that “major changes to the EV strategy” could be necessary, according to a wrap up by Bloomberg.
Ford now says it is “throttling back” on plans to ramp up EV production, the wrap up said. It blamed the price war for EVs as part of the cause and told shareholders it would need another year to meet its target of 600,000 EVs produced annually.
Ford CEO Jim Farley said late last week: “The shift to powerful digital experiences and breakthrough EVs is underway and going to be volatile, so being able to guide customers through and adapt to the pace of adoption are big advantages for us. Ford+ is making us more resilient, efficient and profitable, which you can see in Ford Pro’s breakout second-quarter revenue improvement (22%) and EBIT margin (15%).”
CFO John Lawler said yesterday that the company “has ample resources to simultaneously fund disciplined investment in growth and return capital to shareholders – for the latter, targeting 40% to 50% of adjusted free cash flow,” Bloomberg added. He now says Ford is “not providing a date” for producing 2 million EVs per year, which was previously the company’s target for 2026.
Is the company pulling an Intel and “kitchen sinking” its guide for the year, or has Elon Musk’s price cuts over at Tesla really put the legacy automaker on the ropes? Ford reports again on October 26, where we’ll get our next glimpse into its continuing operations this year.
Tesla is down -26% since January 14, 2022. And showing a nice turnaround!
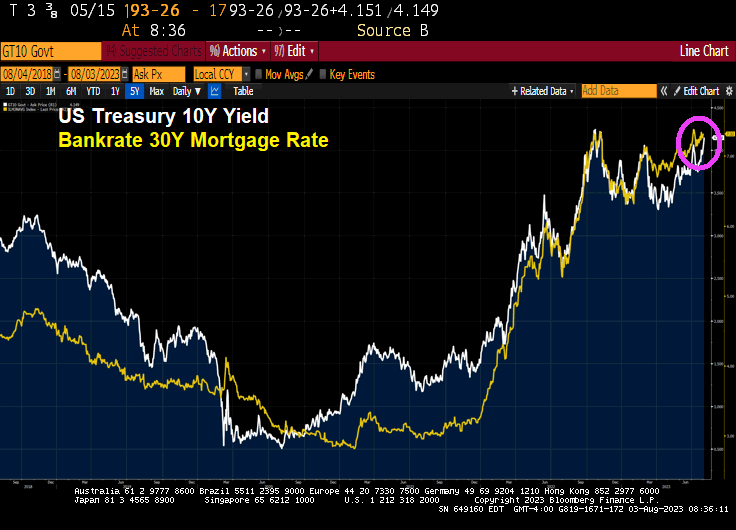
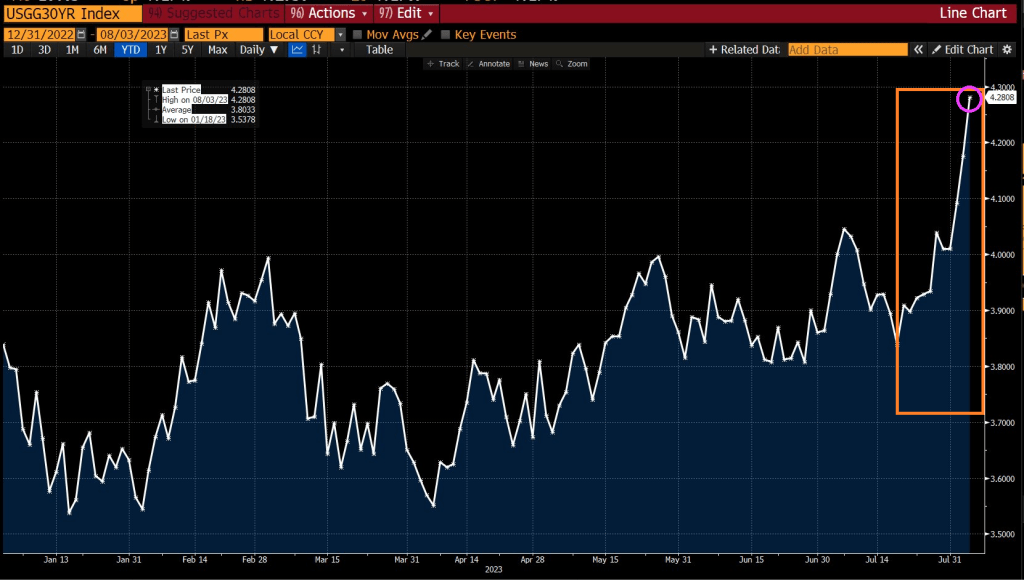
Today, the 10-year Treasury yield is up 11 basis points.
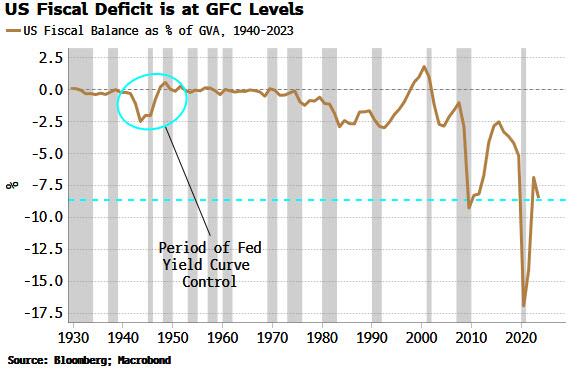
First, the deficit. It’s close to historical wides, bigger than it’s ever been outside of a recession, and almost as wide as it was in the depths of the GFC. It’s the largest in the world in GDP terms, and it is currently heading in the wrong direction. This heaps more pressure on the government debt-to-GDP level, already uncomfortably high at 112%.
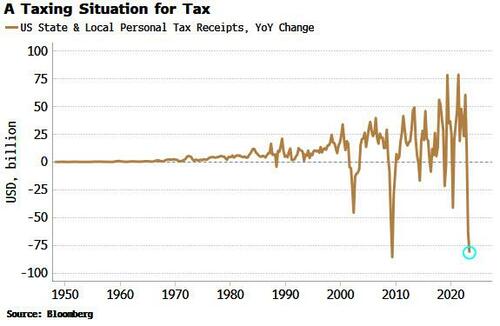
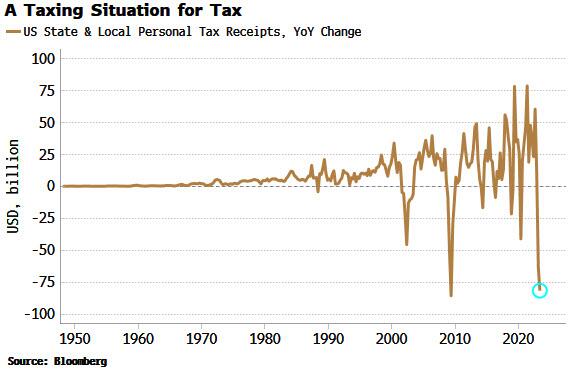
Second, tax revenues. These have seen almost their largest annual fall ever, in an economy that’s supposed to be growing at 2.4%.
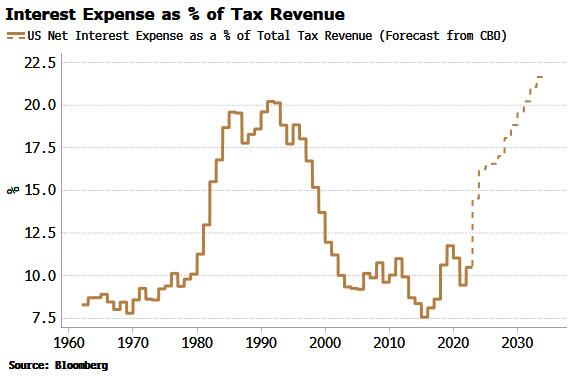
And then there’s rising interest-rate costs. The total interest expense as a percentage of tax revenue is expected to rise sharply in the next year or two, and make new highs by the end of the decade. However, these CBO forecasts should be taken with a grain of salt as they are based on a 10-year yield of only 3.8% (the ten-year average has been higher than that in every decade bar the 2010s and 2020s).
My former student at University of Chicago’s MBA program, Kevin Smith of Crescat Capital, has this charming chart of state and local income tax receipts collapsing.
There is a view the Treasury is already implementing YCC, based on the fact it has been skewing its issuance towards bills and away from coupons. But issuing more bills is simply the easiest and fastest way for the Treasury to replenish its account at the Fed (the TGA). It was run down to almost zero in the lead-up to the debt-ceiling limit, and has now risen to over $500 billion.
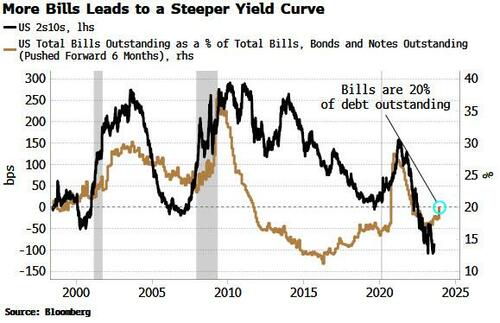
This level of bill issuance is not unusual. The Treasury has an implicit target of about 20% for the amount of bills outstanding as a percentage of total debt. As we can see from the chart below, bills have often been more than 20% of debt outstanding over the last 30 years. Moreover, the Treasury announced this week it was raising its coupon-issuance amounts.
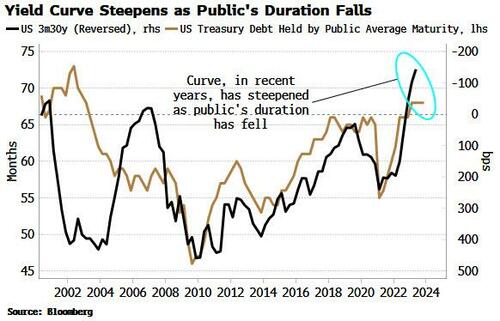
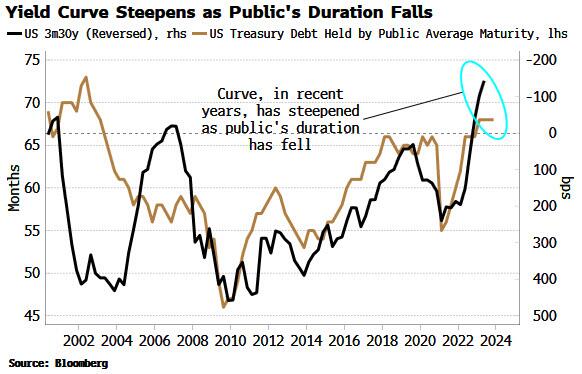
According to the stealth YCC thesis, less longer-dated Treasury issuance implicitly caps longer-term yields, but this has not historically been the case. As the chart above shows, the yield curve typically steepens – not flattens – when there is greater bill issuance – the opposite of what is desired by YCC.
We see the same relationship if we look the duration of US government debt outstanding. When the average duration falls – as it would if issuance is skewed toward bills – the yield curve tends to steepen. The current average duration held by the public is consistent with a steeper, not a flatter, yield curve.
This sounds counter-intuitive. If issuance drives yields, then more issuance at the front-end of the curve versus the longer end – equating to a fall in duration – implies the yield curve should flatten.
But the fact the relationship is the other way implies it’s likely that demand is the more dominant driver of yields in the medium term. There is ready-made demand for bills, from MMFs, etc, so when supply increases, demand rises to meet it, suppressing the yield-curve impact.
It’s thus hard to argue the Treasury is engaging in yield curve control. But that does not detract from the rising possibility it will need to be implemented in some shape or form eventually.
Banks and the Fed are reducing their Treasury holdings, while foreigners now collectively own about $5 trillion less USTs – about 10% – than they did in 2021. At the same time the “Treasury put” means large fiscal deficits are likely to become a feature, not a bug. That means inflation is likely to become embedded.
Fiscal profligacy and elevated price growth are a combustible mix and a road to prohibitively high yields via rising term premium. Yield capping thus starts to look like the endgame.
How it’s done is another matter, whether it’s the Fed co-opted to cap yields as it was in WWII, Treasury buybacks, or financial repression, whereby domestic institutions are forced to hold more government debt. Whatever way, at some point yield curve control in the US is becoming increasingly likely – by stealth or otherwise.
But never fear! Janet “Too Low For Too Long Creating Asset Bubbles” Yellen is still US Treasury Secretary.
President Jimmy Carter is usually the bar for terrible Presidents. Under Carter, the US experienced economic stagnation and soaring inflation. At least it led to the election of Ronald Regan!
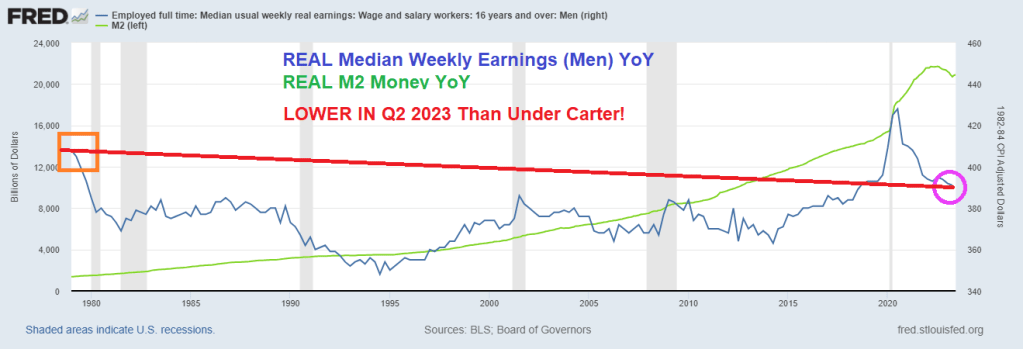
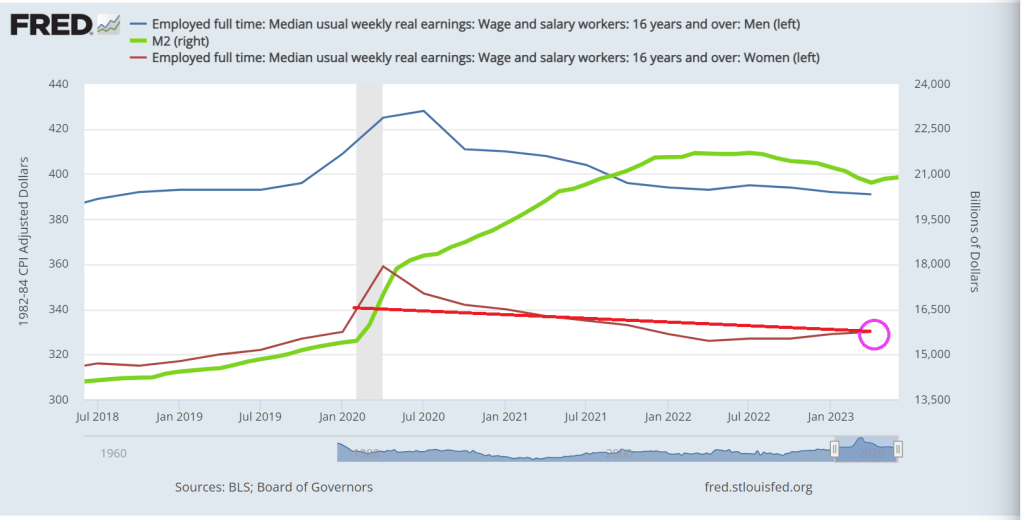
So, Biden’s much mentioned Bidenomics have produced REAL MEDIAN WEEKLY EARNINGS FOR MEN that is currently below 1979 levels under Jimmy Carter.
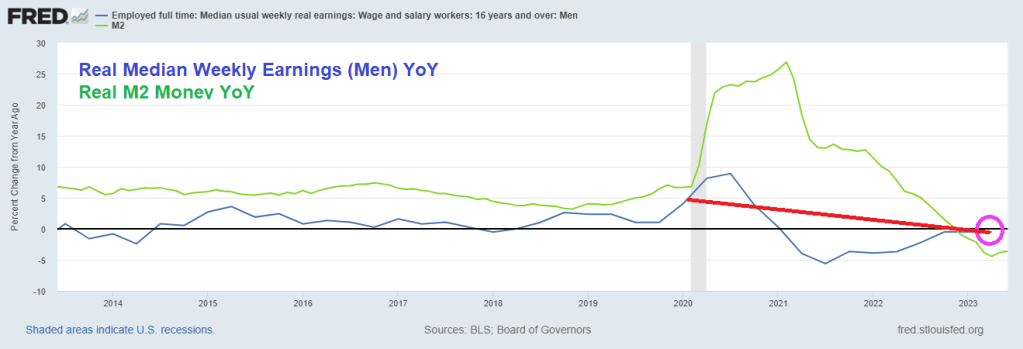
Even worse for Bidenomics, REAL MEDIAN WEEKLY EARNINGS GROWTH FOR MEN was -4.45% In April 2023, while the last reading prior to Covid under Trump was 6.674% YoY in February 2020. So, Bidenomics isn’t even back to Trump levels for men.
I like this chart which I call “Yellenomics” because it illustrates The Fed’s Folly of money printing and its impact on real earnings. After the Trump wage growth boom, real median weekly earnings for men has been steadily declining.
Women, on the other hand, did show a gain since Carter, but still lower than the last month before Covid struck. Women’s real median weekly earnings growth YoY since Q2 2021 are down -5%. So, Bidenomics has been less sucky for women than men.
Reminds me of The Yardbird’s classic “I’m A Man.” Worse off under Biden than under Jimmy Carter. Although The Yardbird’s “Over Under Sideways DOWN” is more emblematic of Bidenomics.
Bidenomics should be renamed Corruptionomics given Biden’s habit of selling government influence to anyone willing to waive a few million.
Joe Biden said that Republicans will impeach him in the House of Representatives since inflation is coming down. Huh? No Joe, it is because your are the most corrupt President in history, a compulsive liar and your economic policies are pure World Economic Forum mandates (open borders, Central Bank Digital currency, green energy, etc). Biden started off his Presidency by declaring war on fossil fuels that helped drive prices through the roof. And the middle class are paying the price.
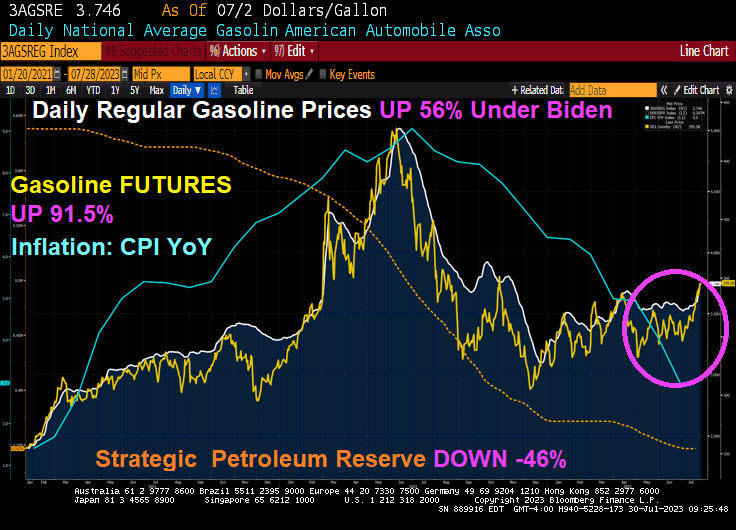
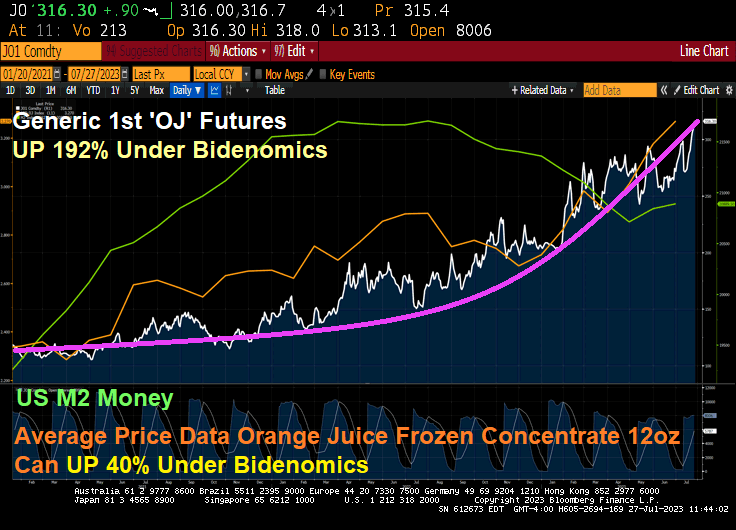
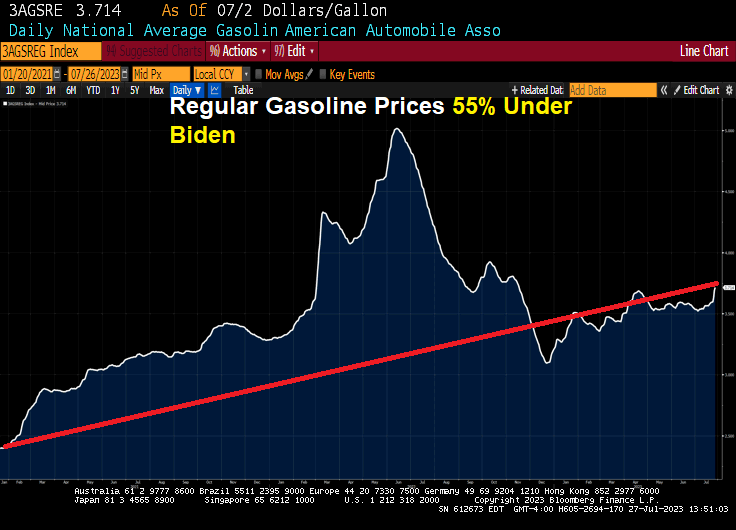
But as inflation cools (blue line) thanks in part to Biden draining the Strategic Petroleum Reserve (orange line), Biden can gloat. But remember, gasoline prices remain 56% higher under Biden’s Reign of Error. Even worse, gasoline FUTURES are up 91.5% under Biden. Yikes!
But look at how gasoline prices and gasoline futures have risen in July (pink circle). The last inflation report showed that inflation has declined to 3% (still higher than The Fed’s 2% target), gasoline prices are up almost 5% since July 19, 2023.
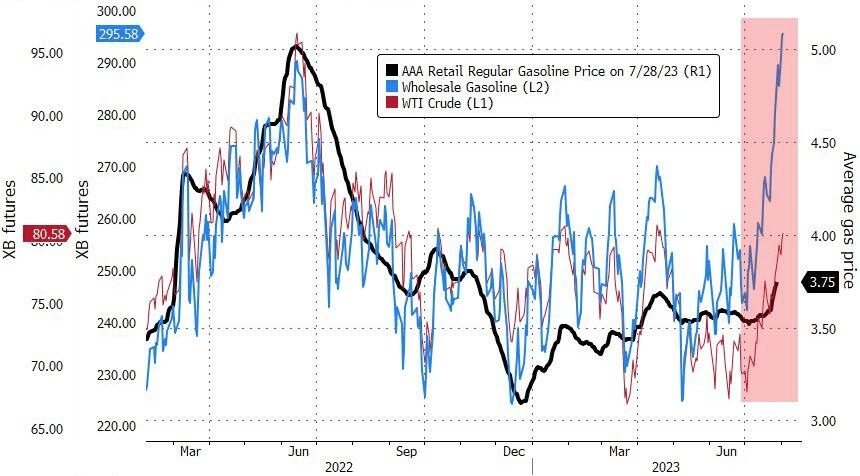
Gasoline, meanwhile, started the year at less than $2.50 per gallon. This week, gasoline topped $2.90 per gallon and may yet reach $3.
WTI Crude Oil futures have broken through the $80 barrier … again. Heating oil futures are up 1.43% today with WTI Crude futures up 0.61%.
So as energy prices keep rising (and Biden’s EPA keeps issuing green energy edicts and fails to recognize that our power grid can’t support all the electric cars and trucks envisioned by the Obama/Biden green dreamers). As such, energy prices will keep rising and with it … inflation.
Commercial real estate (CRE), particularly office space, reminds me of the Arthur Brown tune “Fire!” except that Jerome Powell of The Federal Reserve is the God of Hellfire! While fighting inflation caused by … The Federal Reserve and insane Federal spending (aka, Bidenomics). Call this the Over, Under, Sideways Down economy. The top 1% are doing quite well, while the lower 50% of net worth households are struggling.
The Q1 2023 NCREIF Office property (value) index shows declining office value since Q2 2022 as The Fed began raising its target rate to combat inflation.
From Trepp, we have this shocking table showing the decline the average total value loss over the span of around a decade. The oldest buildings experienced the largest reduction in value of 60%, and the newest experienced the least (but quite substantial) reduction of 52%. Although the newest buildings performed the best relatively, their 52% value reduction is easily the most concerning, and displays truly how much distress is present in the office sector. This group has the highest percentage of Class A buildings, but its reduction value over the past decade is still approximately on par with buildings constructed over half a century prior. With north of $150 billion in securitized maturities beyond 2023, these trends set a gloomy tone for their future and the performance of office properties as a whole.
Then we have this alarming headline from Trepp: “Commercial Mortgage Sector Faces Another Wall of Maturities as $2.75 Trillion Rolls by 2027.” An estimated $528.7 billion of commercial mortgages mature this year, according to Trepp data, which projects that next year, maturities will increase to $532.8 billion. The projections are based on data for the first quarter compiled using the Federal Reserve’s flow of funds and made various assumptions regarding loan terms for each of the major lender categories. The data would indicate that the market is facing a wall, if not a mountain of maturities that would make the 2015-2017 wall of maturities look almost inconsequential. During that period, roughly $1.1 trillion of loans were scheduled to come due. But attention was focused on the CMBS market, as more than $335 billion of loans were set to mature during the period.
Well, REAL gross domestic income fell -0.8% YoY in Q1 2023 as M2 Money growth crashes. Not a good sign for the US economy or commercial real estate.
Of course, office properties are suffering from almost out-of-control crime in major American cities and the desire of workers to work from home rather than commute to work in cubicles.
But never fear! We have massively corrupt and compulsive liar Joe Biden as President!! He is the President of The 1%! Not the other 99%.
The Biden Administration is gushing about Q2’s Real GDP report of 2.4% QoQ. Wow, after trillions of dollars of stimulus spending and The Fed going wild with monetary stimulus, all we got was 2.4% growth??
Biden Press Secretary KARINE JEAN-PIERRE: “The American people are beginning to feel Bidenomics”
Prices are up 16.6% and real wages are down 3% since Biden took office.
Well, at least Jean-Pierre didn’t claim like her boss Joe Biden claimed that he “ended cancer as we know it.”
But getting back to Jean-Pierre’s claim that “The American people are beginning to feel Bidenomics.” She is right (for once). Americans are REALLY feeling Bidenomics. And it hurts SO BAD!!!
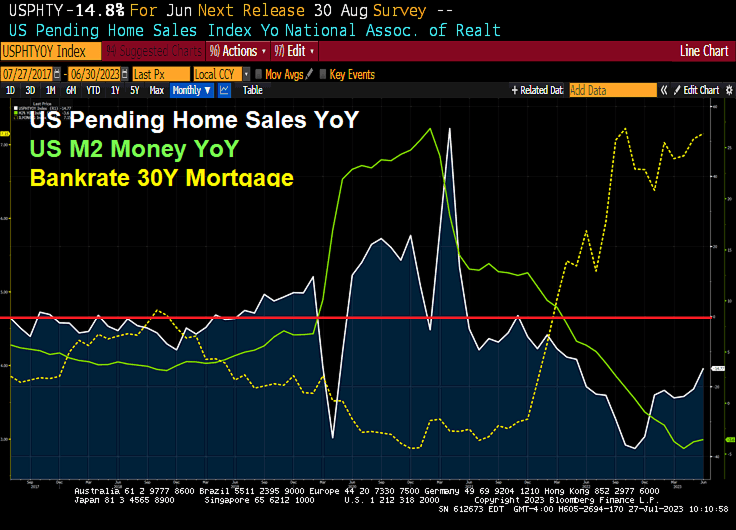
What hurts so bad? Food (CRB Foodstuffs) are up 56% under Bidenomics. Real weekly wage growth is down -90% since Biden assumed office. Regular gas prices are up 52%. And the 30Y mortgage rate is up a staggering 153%. Yes, Karine, this hurts so bad!
While real wages are down -3% under Biden and the real average weekly wage growth is down -90%. That REALLY hurts so good.


You must be logged in to post a comment.