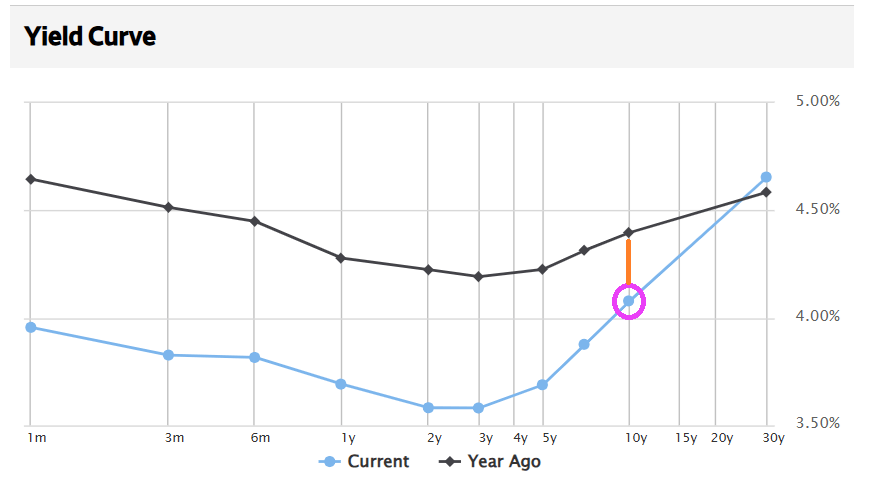
A new week starts! And the all-important 10-year Treasury yields checks in at 4.112%, down from 4.397% one year ago.
Let’s see if Senate Democrats agree to open the Federal government.
Confounded Interest – Anthony B. Sanders
Financial Markets And Real Estate
A new week starts! And the all-important 10-year Treasury yields checks in at 4.112%, down from 4.397% one year ago.
Let’s see if Senate Democrats agree to open the Federal government.
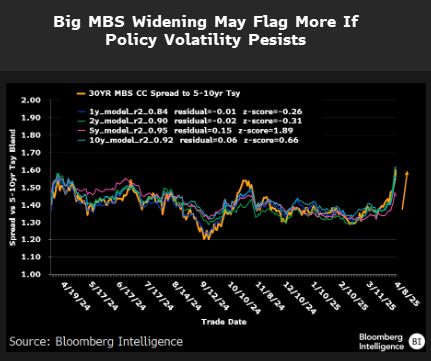
CC Rider! 30Y MBC Current Coupon (CC) spreads is widening.

And metals are along for the ride! Gold and silver are soaring!


US home prices are slowing as Jerome Powell and The Fed slow down M2 Money printing.
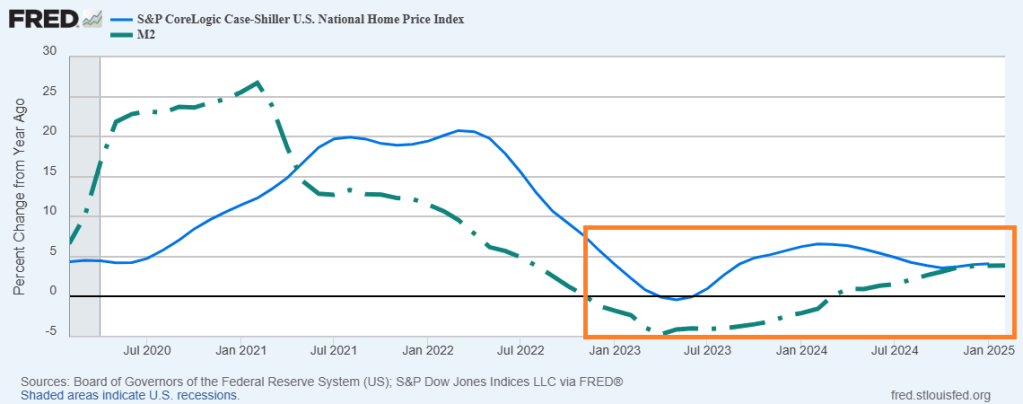
Notice the lag effect between M2 Money growth (green dashed line) and the Case-Shiller National home price index (solid blue line). Both have slowed.
Should The Fed keep on printing money? We don’t need no stinkin’ Fed!


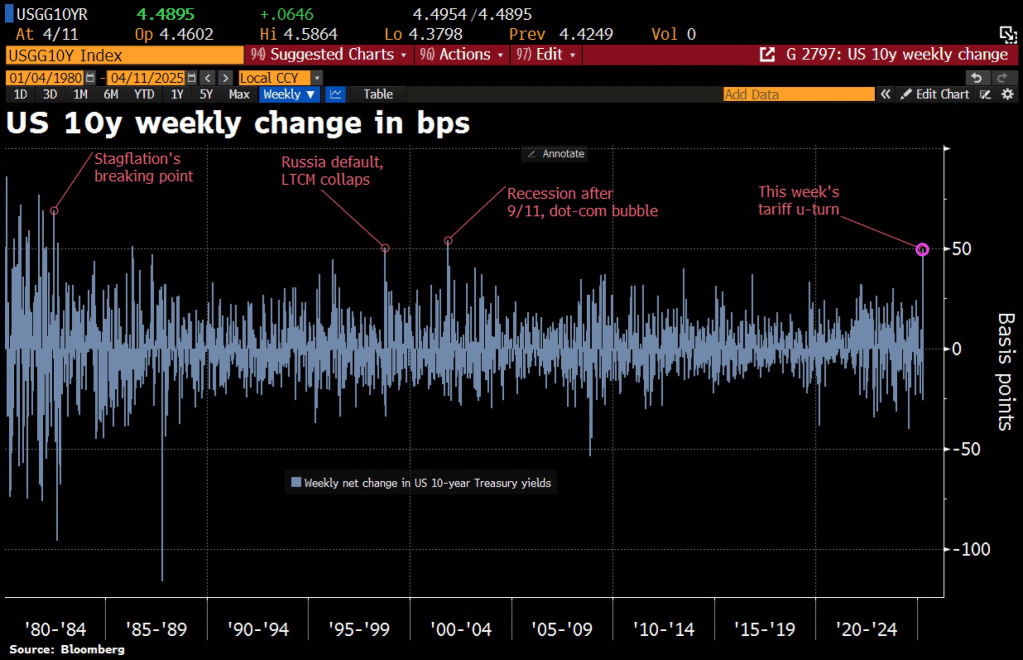
Thunderstruck! The tariff kerfuffle between the Trump Administration and China is causing turbulence in the Treasury market. The 10-year Treasury rate is soaring with China’s counterpunching.
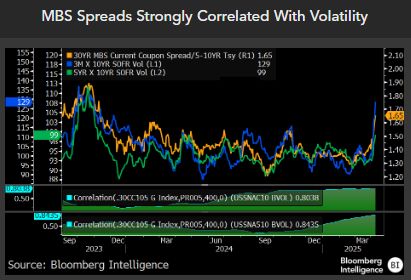
MBS spreads are widening.
Along with volatility.
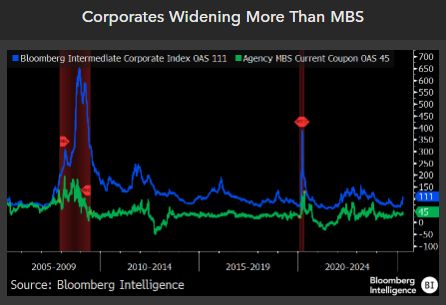
But corporate spreads are widening more than MBS spreads.
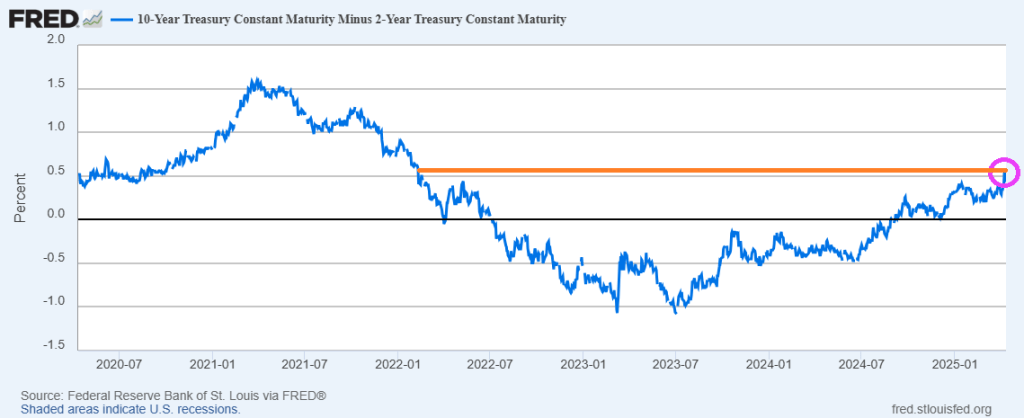
The 10Y-2Y yield curve has risen to the highest level since the early days of “China Joe” Biden.
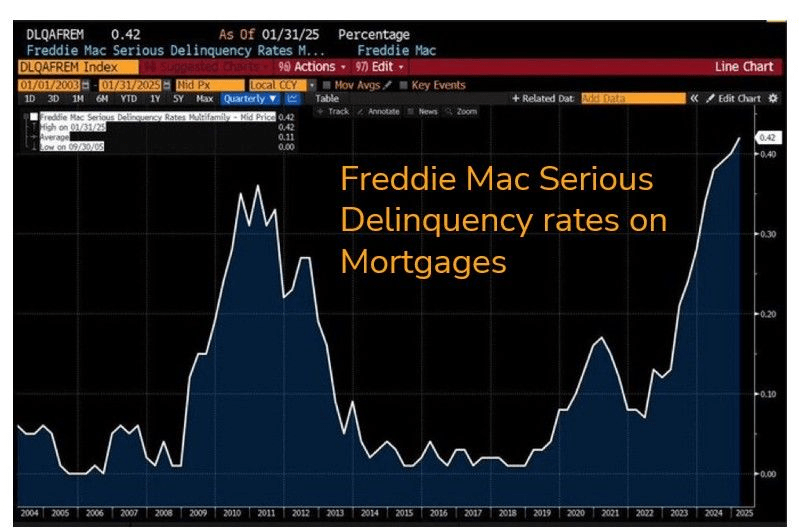
On a related note, Freddie Mac serious delinquency rates on mortgages is now the highest since the financial crisis.
Housing is simply unaffordable in many parts of the USA and world. Its the same all over the world. except Romania and Finland.
The most unaffordble countries are Portugal, Canada, the USA, Switzerland, and the Czech Republic. The most affordable? Romania, Finland, Italy, and Bulgaria.

For the USA, Hawaii and California are the least affordable while West Virginia and Iowa are the most affordable.

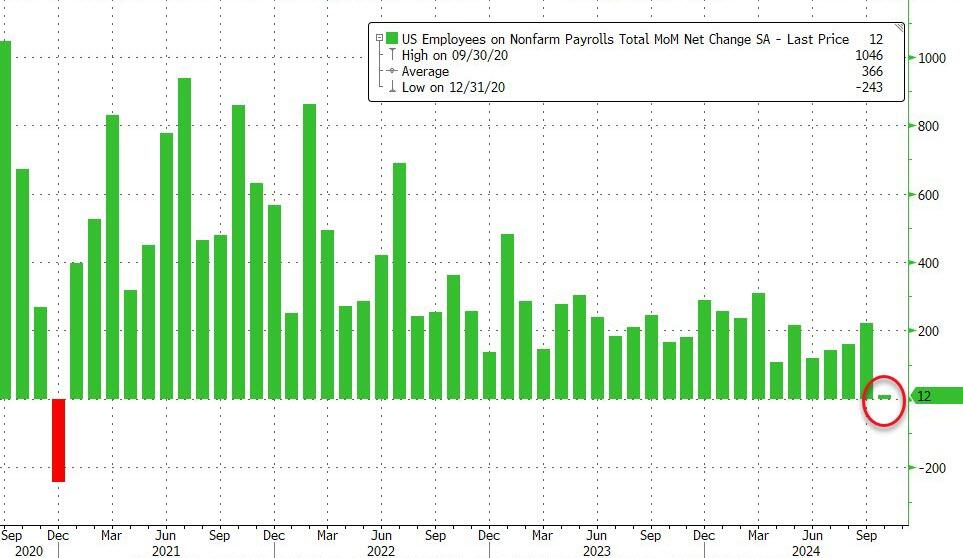
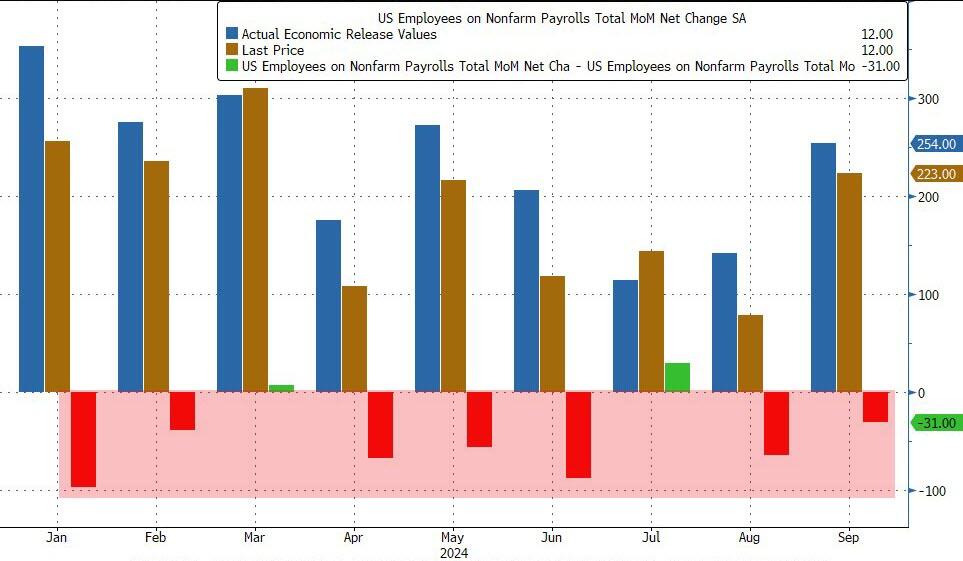
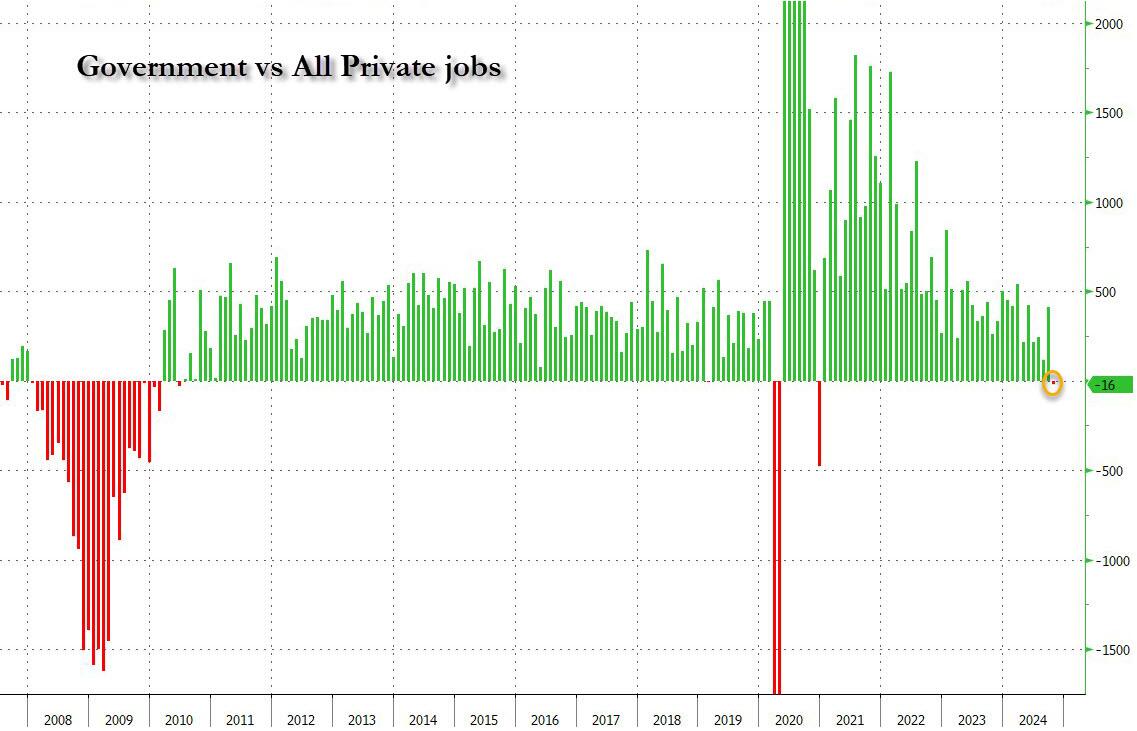
October jobs report was a real shocker!!
Moments ago the BLS reported the highly anticipated number and… it was close: the monthly print was only 12K, a huge drop from the pre-revision 254K in October (revised naturally lower to 223K), and just 13K away from a negative print. Only 12k total jobs added! And -28k private jobs added!
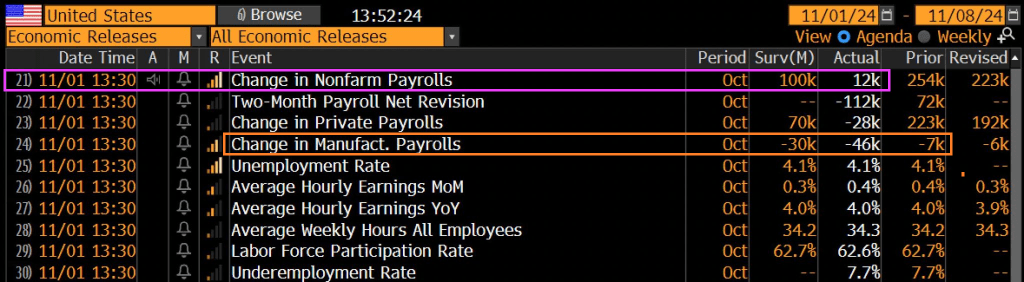
Total jobs including government rose by a measly 12k.
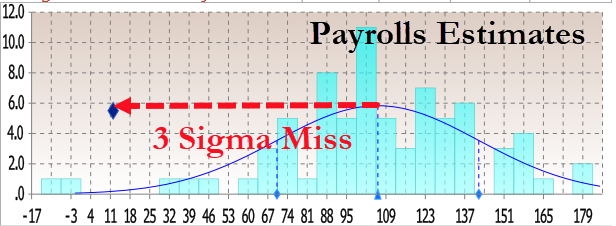
The print was so low it was only above the two lowest estimates (those of Bloomberg Econ for -10K and ABN Amr0 for a 0 print). That means it was a 3 sigma miss to estimates.
And of course, as has been the case for the entire Biden admin, previous months were revised sharply lower once again: August was revised down by 81,000, from +159,000 to +78,000, and September was revised down by 31,000, from +254,000 to +223,000. With these revisions, employment in August and September combined is 112,000 lower than previously reported. This means that even after the monster September revision when 818K jobs were removed, 7 of the past 9 months were again revised lower!
This means that once the November jobs are released, we can be virtually certain that October will be revised to negative.
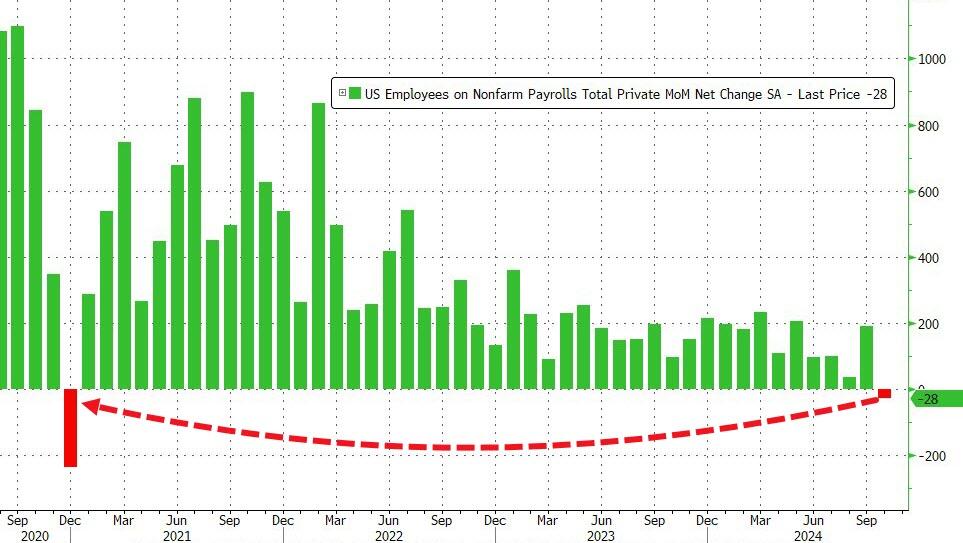
But wait, there’s more because while the total payroll number was just barely positive, if one excludes the 40K government jobs, private payrolls was in fact negative to the tune of -28K, down from 223K pre-revision last month, and the first negative print since December 2020. In other words, we were right… when it comes to actual, non-parasite “government” jobs.
To be sure, a big part of the drop was due to the one-time event discussed, including the Boeing strike and Hurricanes Helene and Milton. This is what the BLS said on the topic: “In October, the household survey was conducted largely according to standard procedures, and response rates were within normal ranges” however, “the initial establishment survey collection rate for October was well below average. However, collection rates were similar in storm-affected areas and unaffected areas. A larger influence on the October collection rate for establishment data was the timing and length of the collection period. This period, which can range from 10 to 16 days, lasted 10 days in October and was completed several days before the end of the month.”
More importantly, the BLS said that “it is likely that payroll employment estimates in some industries were affected by the hurricanes; however, it is not possible to quantify the net effect on the over-the-month change in national employment, hours, or earnings estimates because the establishment survey is not designed to isolate effects from extreme weather events. There was no discernible effect on the national unemployment rate from the household survey.”
Ironically, while the BLS was unable to “quantify the net effect” from the hurricanes, it was able to calculate that the number of people not at work due to weather surged to the third highest in recent history, up 512K!
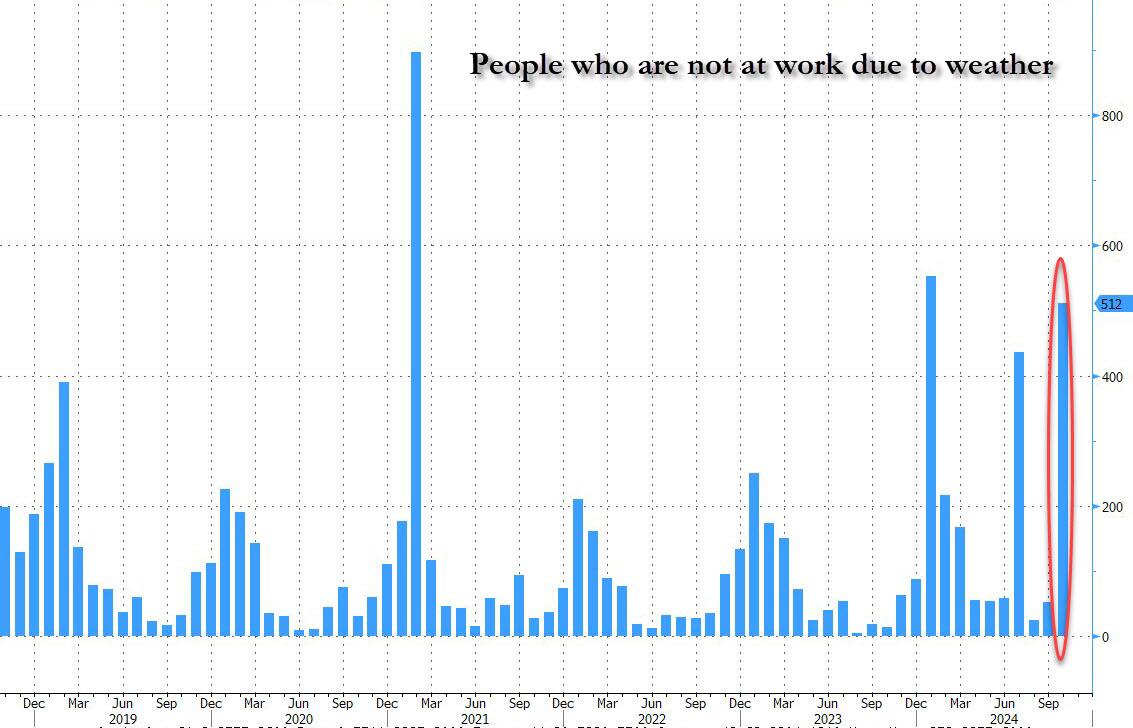
In other words, the BLS now has an excuse to blame the plunge on, it just doesn’t know how to quantify it. Translation: if Trump is president next month, expect the downtrend to continue with little to no mention of hurricane as the BLS prepares to admit the true state of the labor market; if however Kamala wins, the November jobs will magically rebound (even as downward revisions accelerate) and all shall be back to fake normal.
Oh, and of course, today’s catastrophic jobs print gives the Fed a full carte blanche to again cut 25bps next week, even if the plunge was all hurricanes…
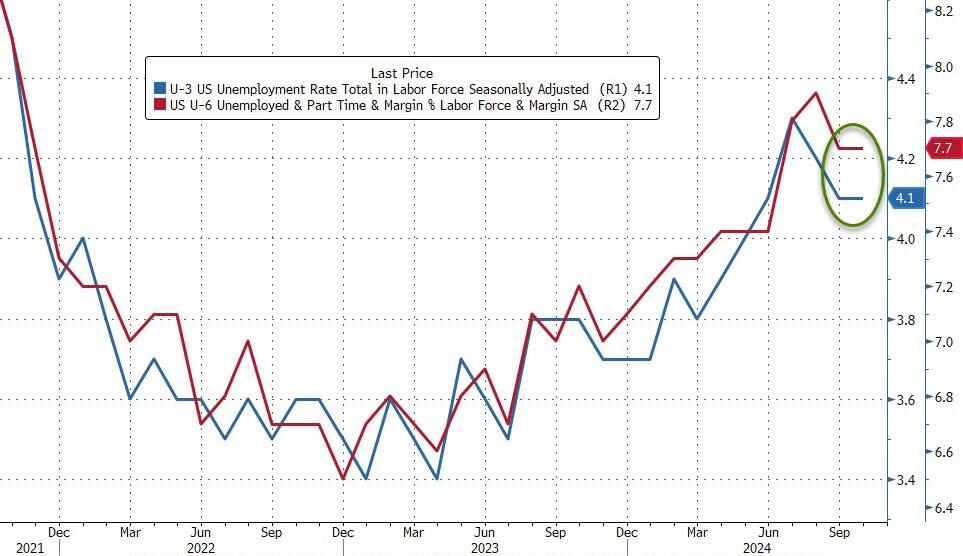
The rest of the jobs report was not that exciting: the unemployment rate printed at 4.1%, unchanged from last month and in line with expectations. The number of unemployed people was little changed at 7.0 million.
Among the major worker groups, the unemployment rates for adult men (3.9 percent), adult women (3.6 percent), teenagers (13.8 percent), Whites (3.8 percent), Blacks (5.7 percent), Asians (3.9 percent), and Hispanics (5.1 percent) showed little or no change over the month.
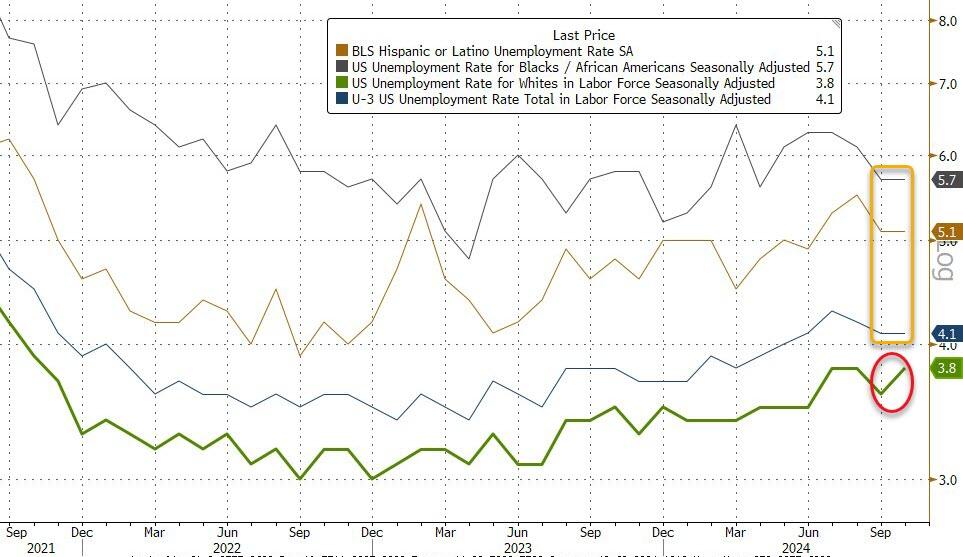
It’s worth noting that the unemployment rate actually rose almost 0.1% despite being reported as flat because in September it was 4.05% and in October it was 4.145%, and rose due to a surge in layoffs (+166K) as well as re-entrants (+108K). Additionally, as Southbay research notes, the average duration of unemployment rose from 22.6 weeks to 22.9 weeks
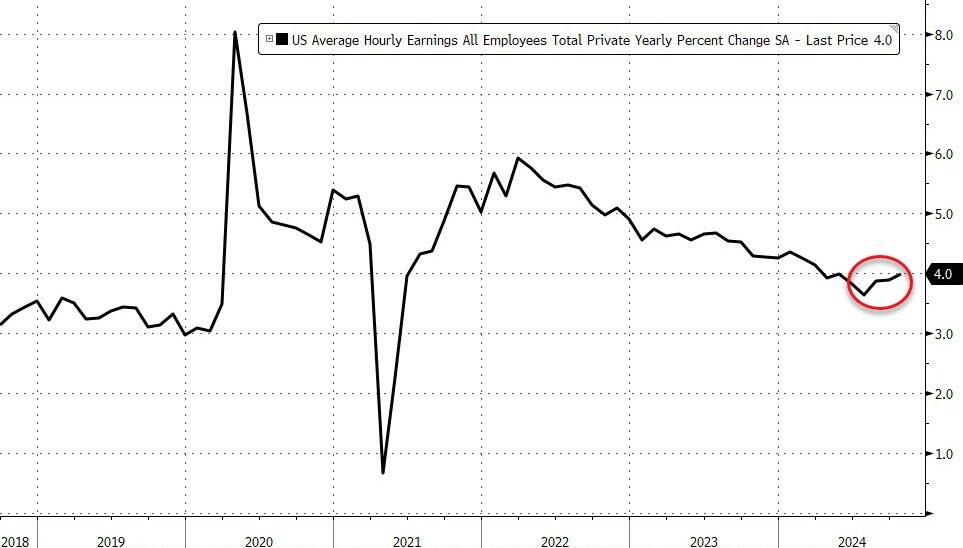
Wage growth came in slightly higher than expected, with average hourly earnings rising 0.4% in October, higher than the 0.3% expected, and up from the downward revised 0.3% in September (was 0.4%). On an annual basis, earnings rose 4.0%, in line with expectations, and above the downward revised 3.9% (was 4.0%).
Some more stats from the latest monthly report:
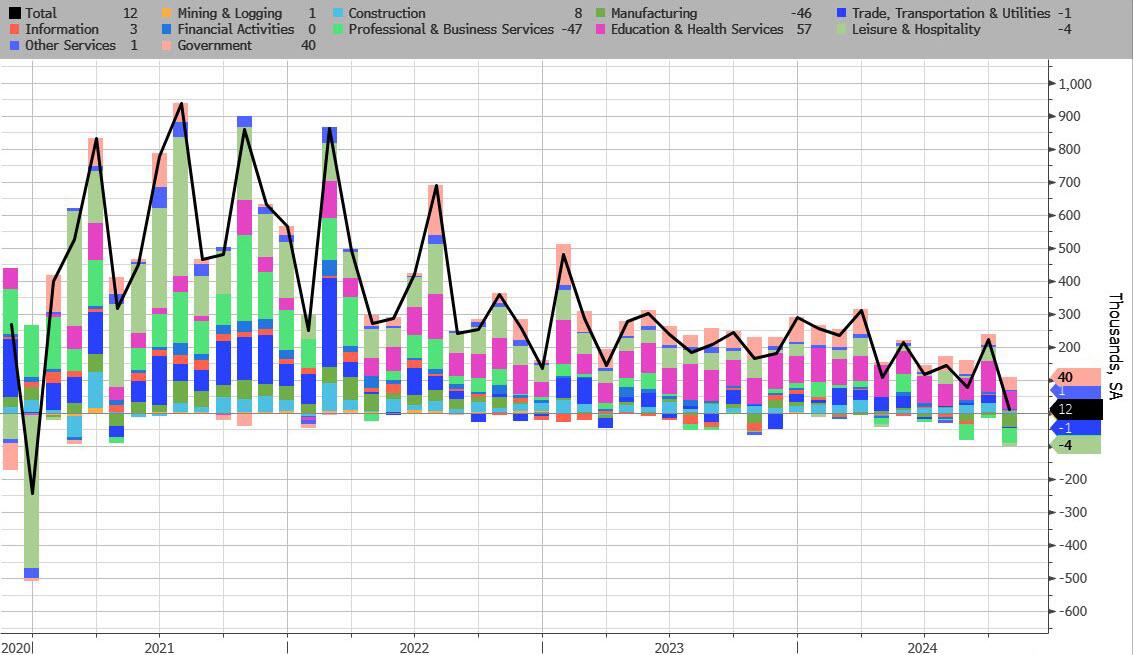
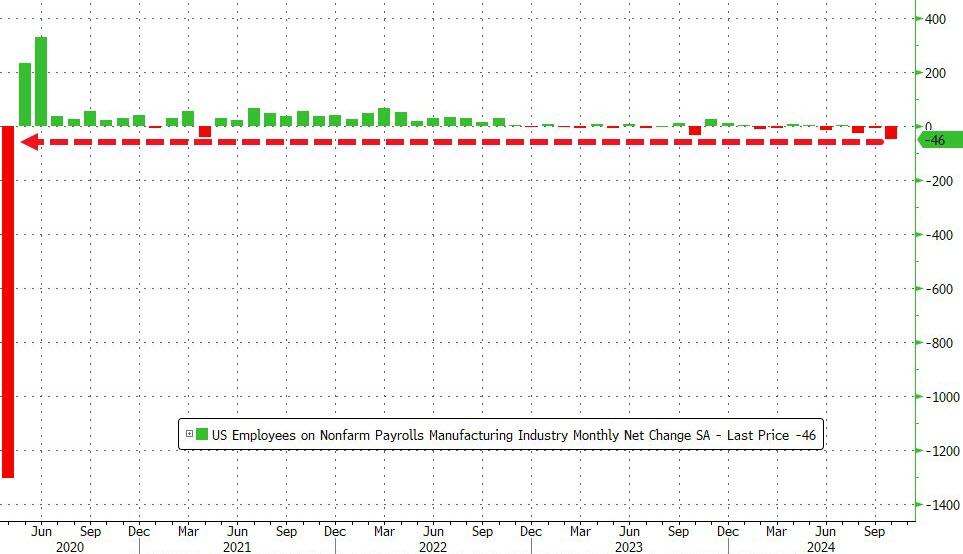
Turning to the establishment survey, we find the following breakdown in jobs:
And visually:


Biden/Harris will be remembered for many things, mostly BAD. Uncontrolled immigration, crime out of control, endless wars, grossly incompetent government administrators, 200k+ missing immigrant children, etc. But wreckless inflation coming from insane government spending takes the cake. And it is heating up again, with the help of The Feral Reserve. Yes, The FERAL Reserve.
Under Biden/Harris, prices are WAY up, real weekly earnings are WAY down.
Gas: +38.2%
Electricity: +31.3%
Fuel oil: +37.4%
Airfare: +24.5%
Hotels: +42.4%
Groceries: +22.1%
Eggs: +69.2%
Baby food: +31%
K-12 food: +69.7%
Rent: +22.9%
Transportation: +31.1%
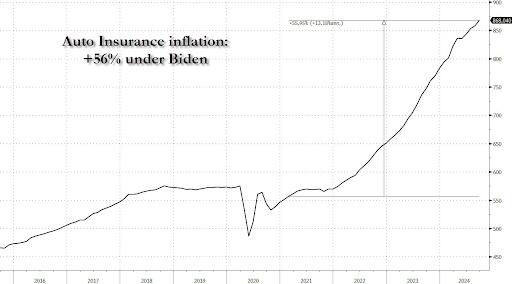
Car insurance: +56.5%
Real average weekly earnings: -3.4%
For the 52nd straight month, core consumer prices rose on a MoM basis in September (+0.3% MoM – hotter than the 0.2% expected) – the strongest since March. That left Core CPI YoY up 3.3%, hotter than the 3.2% expected…
The headline CPI also printed hotter than expected (+0.2% MoM vs +0.1% MoM exp), with the YoY CPI up 2.4% (hotter than the 2.3% expected but lowest since Feb 2021)…
Core Services and Food costs surged in September…
Overall, headline consumer prices are up over 20% (5.1% p.a.) since the Biden-Harris admin took over, which compares to around 8% (1.97% p.a) during Trump’s first term…
The so-called SuperCore CPI also increased on a YoY basis to +4.6%…
A surge in Transportation Services costs (record high auto insurance) and Medical Care Supplies lifted Super Core…
Why is the cost of auto insurance up 56% since Biden and Harris took over?
Real wages are down since the start of the Biden-Harris administration…
Finally, we note that money supply is resurgent once again, suggesting The Fed’s confidence in CPI’s decline may be misplaced…
Could we really replay the ’70s once again?
Will that really be Powell’s legacy? Or will the timing of this resurgence in inflation be perfectly timed to coincide with Trump’s election victory… and offer a perfect patsy for who is to blame?
Pretty soon we will all be working for the government doing manual labor. Except for politicians and large donors, of course.
On Tuesday, it was announced that Presidential candidate Kamala Harris would be supporting President Joe Biden’s tax proposals for 2025, which include a 44.6% capital gains rate and a 25% tax on unrealized gains.
Having used up all of the rest of the batshit, insane, counterintuitive economic dirty tricks left in the “we’ll literally do anything but cut spending” bag, the Biden administration began pushing this tax idea in April 2024 when I first wrote about it. Unrealized gains taxation could be the most destructive idea for our country since prohibition, I joked at the time.
As part of its budget proposal for the 2025 fiscal year, the Biden administration was trying to raise an addition $4.3 trillion over 10 years in the worst way possible: imposing a minimum tax equal to 25 percent of a taxpayer’s taxable income and unrealized capital gains less the sum of their regular tax, for taxpayers with wealth over $100 million.
Biden/Harris pushes taxes way beyond the revenue maximing point, down to the point of deminishing revenues and economic growth. Here is the Laffer Curve.

Putting aside the fact that this high-risk idea only amounts to a pittance, $430 billion per year, the introduction of taxing unrealized gains could be one of the worst slippery slopes we ever dare to roll our country’s economy down.
We could save $1 trillion just by not sending $100 billion a year to other nations for starters.
A tax on unrealized capital gains means that individuals are penalized for owning appreciating assets, regardless of whether they have realized any actual income from selling them.
If you purchased a stock for $100 this year, for example, and it increased to $110 next year, you would pay the assigned tax rate on the $10 capital gain. You didn’t sell the asset, so you don’t realize the $10 appreciation, but must pay the tax regardless.
Taxing unrealized capital gains contradicts the basic principles of fairness and property rights essential for a free and prosperous society. Taxation, if we’re going to have it on income, should be based on actual income earned, not on paper gains that may never materialize.
mplementing such a tax not only deeply infringes upon personal liberty and private property rights — but I can’t help but think about how it also sets a destructive wrecking ball rolling down a slippery slope for the first time in our nation’s history.
And, given the precarious state of our nation’s finances, it doesn’t seem like the best time to start spitballing about new risky ideas that may or may not catch on only because they sound like they are addressing the problem of a widening wealth gap that Federal Reserve policies created and continue to exacerbate to begin with.
If the administration really wanted to address the problem of wealth inequality, it would be setting its sights on the central bank that sacrificed price stability so it could spray trillions of dollars in “stimulus” toward financial assets, while cutting American families paltry checks of just $600, during COVID. When I did the math during COVID, the total amount spent to bail out the country.
Why do we trust any Democrat politiician? I certainly don’t!
Taxing unrealized gains would risk mass sale of US assets and therRich fleeing.
We’re going down!

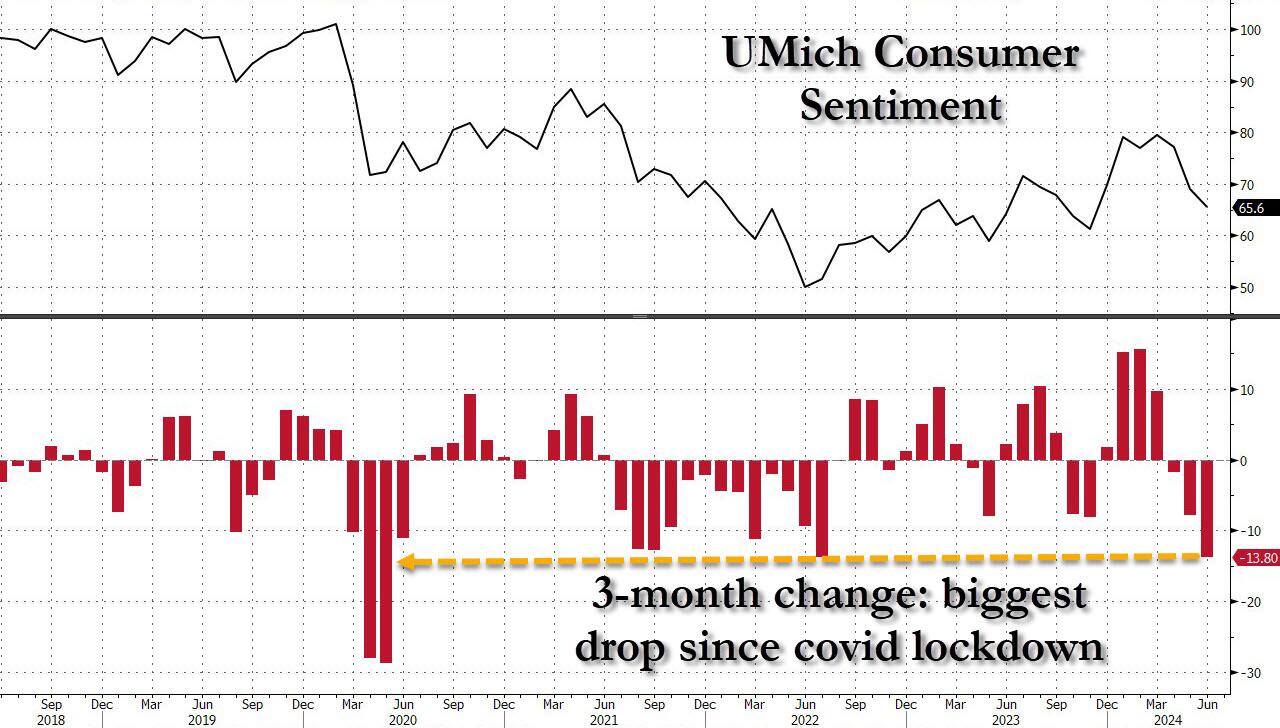
One month after the May Consumer Sentiment printed at a record 7-sigma miss to expectations, consumer sentiment once again “unexpectedly” slumped, this time from an upward revised 68.8 to 67.6, the lowest print since last November, and the biggest 3-month drop in sentiment (-13.8 points) going back to the covid lockdowns.

… which was not only a 5-sigma miss to the median estimate (an improvement from last month’s 7-sigma)…
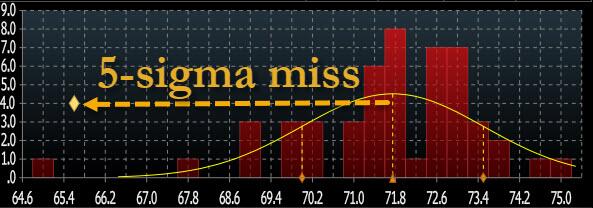
… but also the biggest miss of 2024.
The collapse in sentiment was broad based, and hammered both current conditions – which plunged from 69.6 to 62.5, the lowest since 2022 and badly missing estimates of 72.2 – and also expectations, which dropped from 68.8 to 67.6 (and also far below the 72.0 estimate).
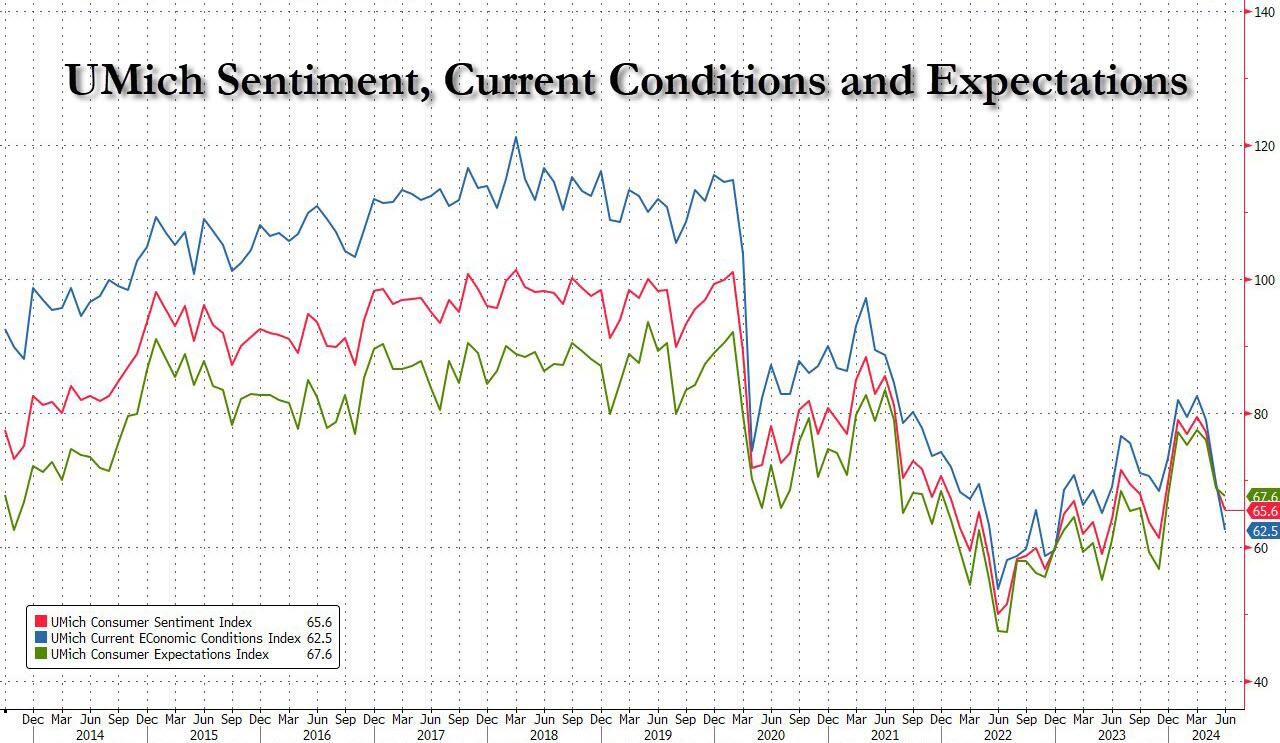
The decline in sentiment coincides with signs that the labor market, which has driven consumer spending over the last year, is also falling apart. The unemployment rate rose to 4% last month, the highest in more than two years, while jobless claims unexpectedly soared following a firing frenzy out of California.
“While lower-income families have, as a group, seen notable wage gains in a strong labor market, their budgets remain tight amid continued high prices even as inflation has slowed,” Joanne Hsu, director of the survey, said in a statement.
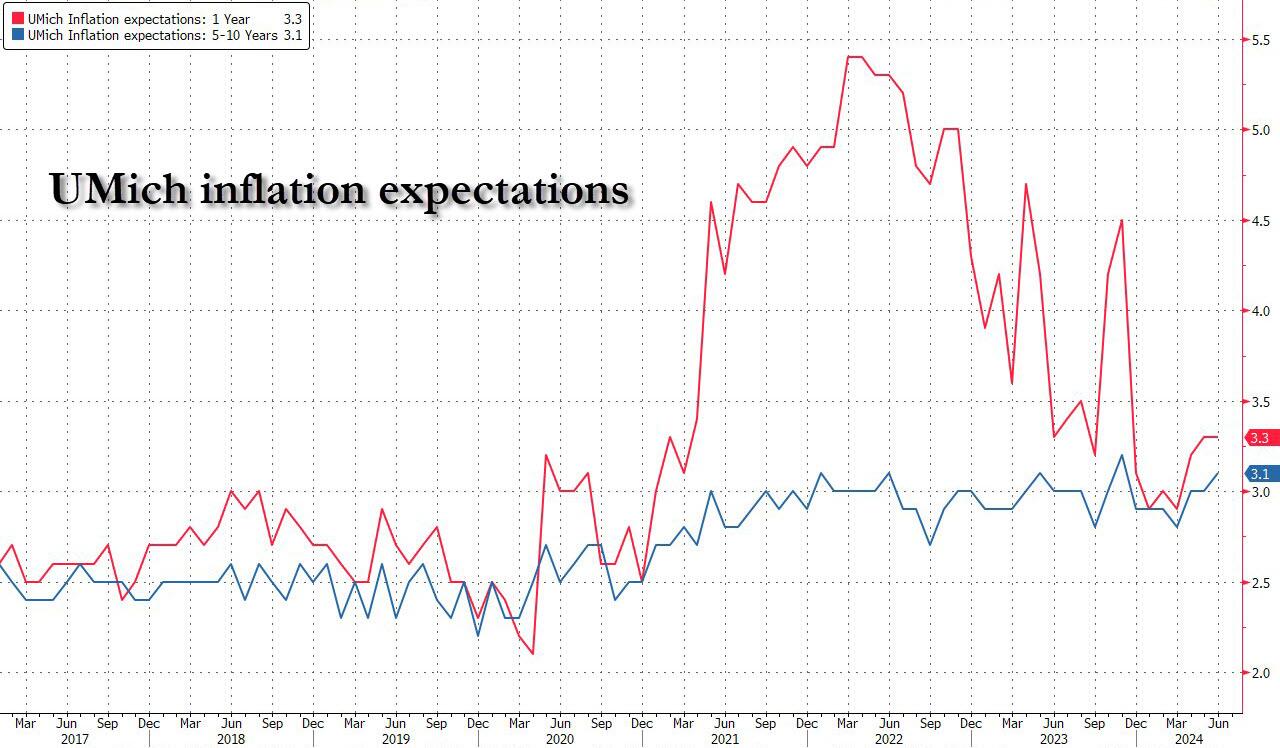
But wait there’s more, because if that was the “stag” part of the report, the UMich report also confirmed that the “flation” isn’t far behind, as the inflation outlook continued its recent deterioration, to wit: 1 Year inflation expectations remained unchanged at 3.3%, beating estimates of a drop back 3.2%, while 5-10 Year inflation expectations rose from 3.0% to 3.1%, the highest since November.
If that wasn’t enough, the slide in sentiment suggests restrained consumer demand in coming months. The university’s measure of buying conditions for durable goods decreased to the lowest level since December 2022, a glowing testament to just how tapped out the US consumer truly is.
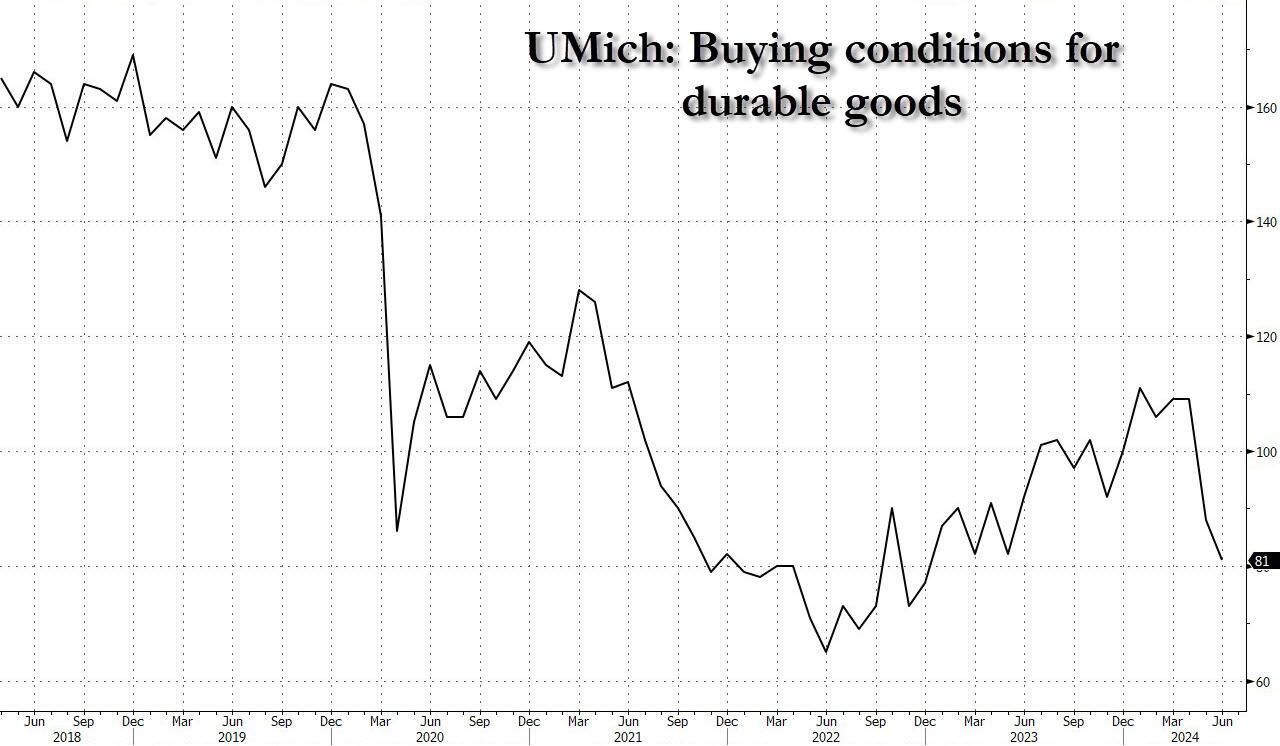
In short: the verdict for Bidenomics is in, and it’s a complete disaster, as for Powell’s recent laughable comment that he can’t see the “stag” nor the “flation”… well, Fed chair, they just bit you on the ass.
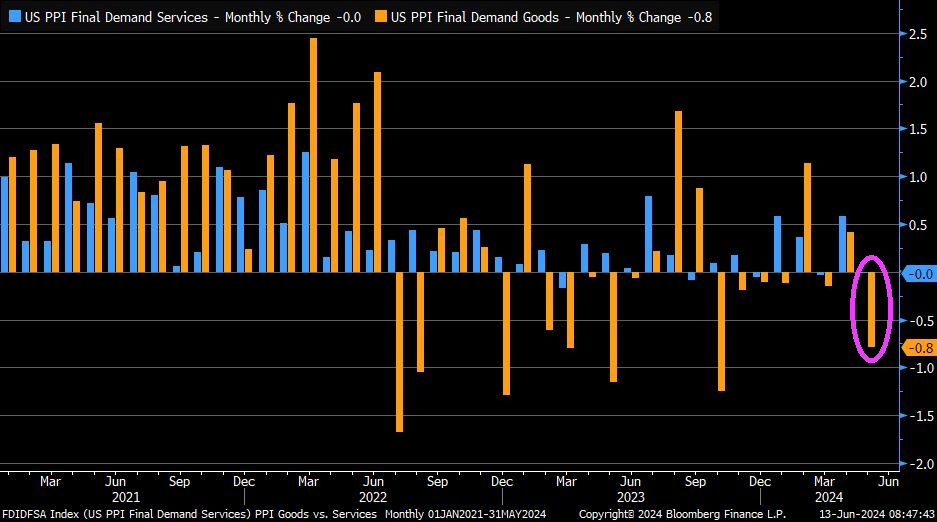
On top of a poor consumer sentiment report, the PPI Final Demand index was down … again.
And The Fed and Powell keep losing money.

Biden at the G7, His new name is “The Wanderer.”

California is in the clutches of a fiscal inferno!
California’s budget crisis is projected to expand more than previously thought and could hit a record deficit of $73 billion, according to a new report from the state’s nonpartisan Legislative Analyst’s Office (LAO). The LAO laid out the grim forecast in a Tuesday report that cautions that a $24 billion “erosion in revenues” corresponds to a $15 billion increase in the state’s budget problem. Due to this, the budget deficit, which last month was estimated to hit $58 billion, could now go as high as $73 billion.
Well, if a $73 billion dollar deficit isn’t bad enough, the California State Assembly took a giant step towards bankruptcy by … seriously … A controversial bill that would let illegal immigrants receive the same kind of homebuyer assistance as U.S. citizens has advanced in the California state legislature, drawing criticism from those who object to granting perks to people who break the law by entering the country illegally.
The measure, Assembly Bill 1840, was first introduced in mid-January, and after several amendments, it advanced last week to the Committee on Housing and Community Development, where it awaits further action.
Assembly Bill 1840 would change existing law to allow illegal immigrants to be eligible for the California Dream for All Fund, which provides interest-free loans for a down payment on a home for first-time buyers.
The bill was introduced by California Assemblyman Joaquin Arambula, a Democrat, who last month told GV Wire, a Fresno-based news outlet, that he “wanted to ensure that qualified first-time homebuyers include undocumented applicants.” (Note to Arambula: According to Redfin, there are no homes for $150,000 or less.
Last week, as the bill advanced to committee after amendments, Mr. Arambula told the Los Angeles Times that, historically, homeownership has been the main way people accumulate generational wealth in the United States.
“The social and economic benefits of homeownership should be available to everyone,” he said, arguing that it’s wrong to exclude people from the benefits of the California Dream for All Fund program just because they’re illegal immigrants.
Some lawmakers expressed opposition to the measure as it moves closer to becoming law.
“Assembly Bill 1840 is an insult to California citizens who are being left behind and priced out of homeownership. I’m all for helping first-time homebuyers, but give priority to those who are here in our state legally,” California Sen. Brian Dahle, a Republican, said in a post on X, formerly Twitter.
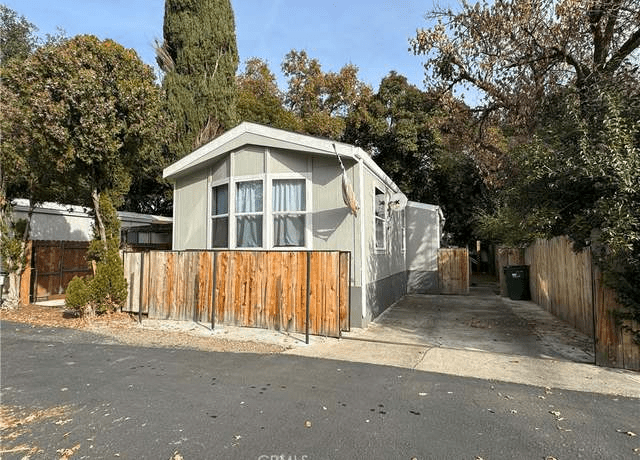
The California Dream for All Fund program, administered by the state’s Housing Finance Agency, provides loans for 20 percent of a home’s value but no greater than $150,000. (Good luck finding a house in Los Angeles for under $150,000!) Here is a home in Chico California for $55,000!
Qualifying homebuyers repay the loans when selling or transferring the property plus 20 percent of any appreciation in its value. Applicants who earn less than their county’s area median income get a slight break, having to pay 15 percent of the appreciation. If a home doesn’t appreciate in value, only the principal will be paid back, meaning the loan is technically interest-free.
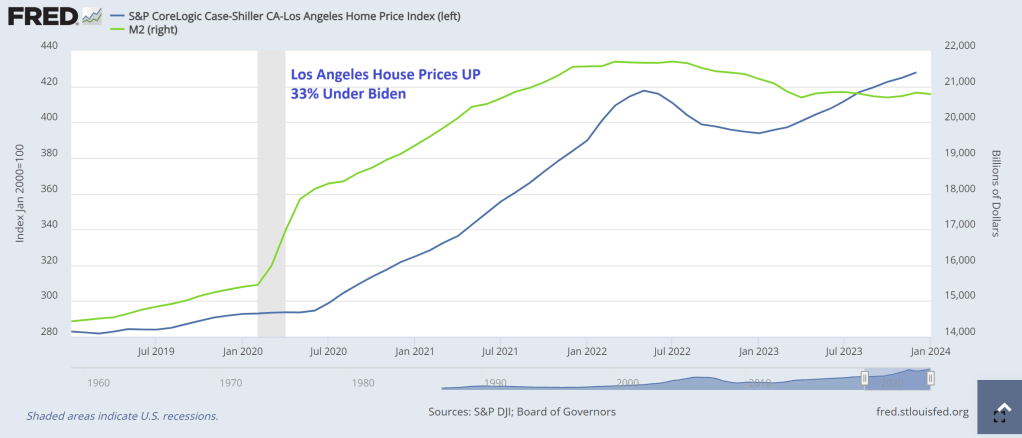
To make matters worse, Los Angeles housing prices are up 33% under China Joe Biden and California Governor Gavin Newsom. NOW they want to drive housing into even more unaffordable territory with allowing illegal immigrants to buy a home with 100% loan-to-value (100% LTV and NO INTEREST!).
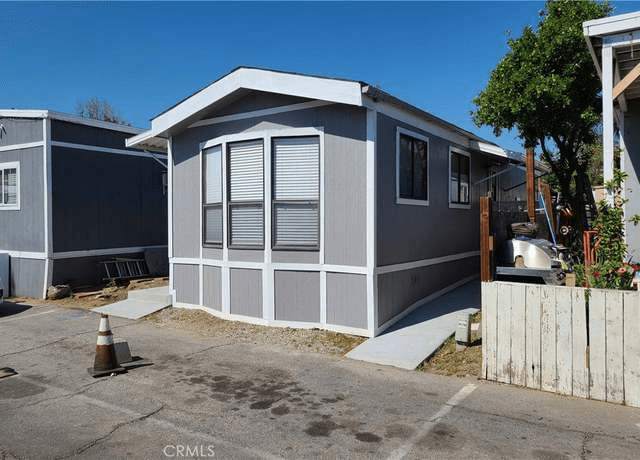
I did find a few homes in Los Angeles for under $150,000 on Redfin. Here is a $125,000 home in Van Nuys.
The proposed bill seeks to amend Section 51523 of the California Health and Safety Code to include a subsection that reads: “An applicant under the program shall not be disqualified solely based on the applicant’s immigration status.”
Mr. Arambula has defended the program, arguing in the interview with GV Wire last month that it won’t affect the state budget because the loans are supposed to be paid back with an appreciation fee.
Even though the net impact of the program on the state budget is technically neutral-to-positive, some critics argue that it sends the wrong message and effectively rewards illegal immigration.
“We have a huge housing crisis in California and anything we can do to get people into housing we should do. However, we should help our own first. This next generation of people growing up can’t afford a house. I’ve got two kids in their early 30s and most of their friends do not own houses,” San Diego County Supervisor Jim Desmond, a Republican, told NBC 7 San Diego.
Mr. Desmond has been a vocal critic of policies that he says create incentives for people to enter the country illegally.
“You incentivize illegal immigration by providing free healthcare, free unemployment benefits and tons of other freebies,” he wrote in a recent post on X, reacting to a post by California Gov. Gavin Newsom, a Democrat, who called on Congressional Republicans to back President Joe Biden’s border deal.
“It’s no wonder we are getting thousands of people by the day. This is on you as much as the Federal Government,” Mr. Desmond added.
Mr. Desmond said on March 3 that over 5,000 illegal immigrants had been released in San Diego County over the past 10 days.
“What’s striking about the people being dropped here by the Border Patrol is about 70 percent of them are single males,” he told Fox News.
While many of the new arrivals are being taken to the airport by local nongovernmental organizations to fly out to someplace else in the country, Mr. Desmond lamented that “in the meantime, our airport is now the new migrant shelter.”
His remarks come as the United States remains in the throes of an illegal immigration crisis of historic proportions, with some border patrol officials and others warning of a national security risk.
The head of the Border Patrol union recently warned about the sharp rise in the number of military-aged Chinese men crossing the U.S.–Mexico border illegally.
National Border Patrol Council President Brandon Judd said in a recent interview on “Just the News, No Noise” TV program that he believes some of them may be spies working on behalf of China’s communist regime to infiltrate the United States.
“At best, they’re here for a better life,” Mr. Judd said. “At worst, they’re here to be part of the Chinese government to infiltrate our own country.”

His remarks came as U.S. Customs and Border Protection (CBP) released its latest data for January encounters with illegal immigrants who crossed the border into the United States.
Aside from showing that Border Patrol agents encountered a record number of illegal immigrants (242,587) in January 2024 compared to any previous January, the CPB numbers show an alarming trend in the number of military-aged Chinese nationals entering the country illegally.
Border Patrol agents encountered 5,717 single Chinese adults in January, more than twice the number of any other January on record, CBP data shows. In December 2023, that figure rose to a record of 7,581, while the total since January 2023 stands at 64,979.
Some analysts say that deteriorating economic conditions in China, along with human rights abuses and policies such as strict COVID-19 lockdowns, are likely driving the increase.
The San Diego Sector has seen a more than 500 percent jump in the number of Chinese nationals entering the country illegally, according to Jason Owens, the chief of the U.S. Border Patrol.


You must be logged in to post a comment.