US Inflation Comes In Hotter Than Expected, Real Weekly Earnings At -1.9% YoY, Negative For 23rd Consective Week (Treasury 2-year Yield Rises 34 Basis Points!)

The Federal Reserve is some hard thinking to do. Inflation came in hotter than expected, so raise rates to fight inflation or lower rates to prevent bank contagion. Similar to Kevin Malone’s “Double fudge brownies or Angela” debate.

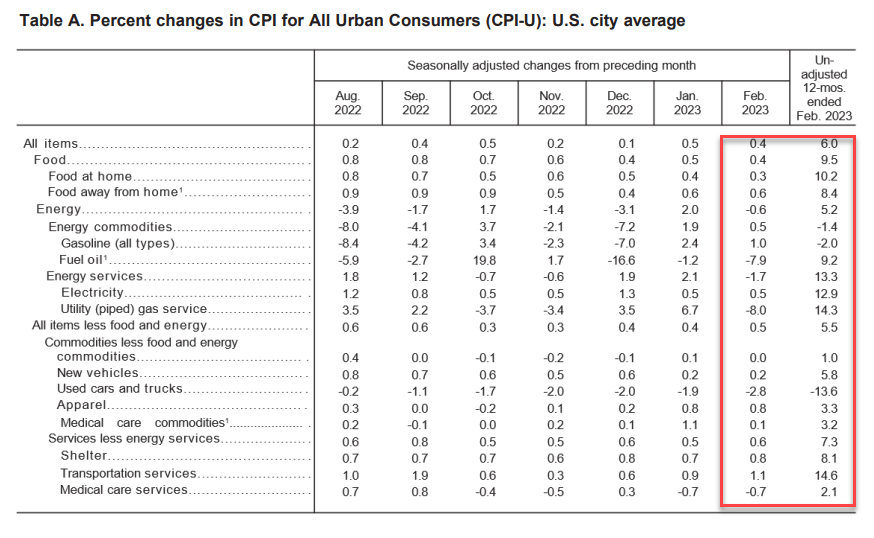
While headline inflation (CPI) came in a 6% (considerably higher than The Fed’s 2% target), core inflation came in at 5.5% year-over-year (YoY), which was expected.

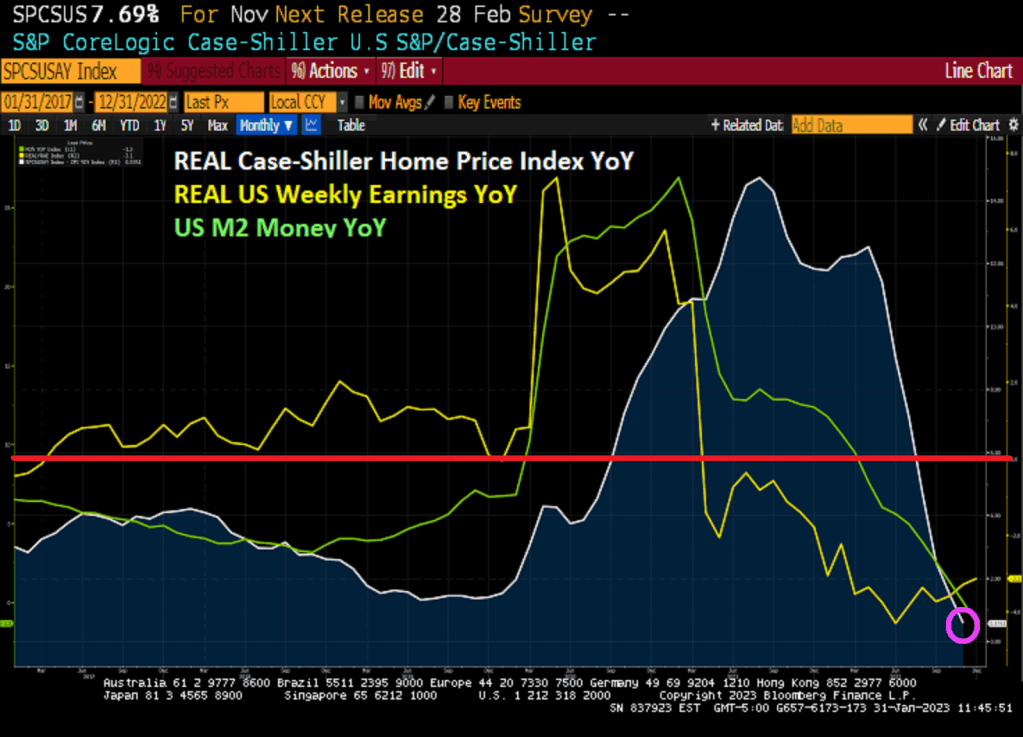
The truly nasty number is today’s inflation report is that weekly earnings YoY remained the same at a terrible -1.9%. Meaning that inflation is higher than nominal wage growth. This is the 23rd straight month of negative real weekly earnings. Well done, Fed and Biden!

Food is up 10.2% YoY. Electricity up 12.9%, shelter up 8.1%.

On the news, the US Treasury 2-year yield rose 34.3 basis points.

Somehow I doubt that Biden’s press secretary will tout 23 straight months of negative weekly earnings growth as one of Biden’s economic accomplishments.

US Financial Conditions Collapse On Fed Failures (Bank Stocks Continue To Fall Despite Biden’s Assurances)

The Fed (Bernanke, Yellen, Powell) kept rates too low for too long (their new moto?), and hell is now being paid.

US financial conditions index collapsed on the 3 bank failures … so far.

Despite what Resident Biden said about banks, bank stocks fell again today.

Gold Soars 2% On Failure Of Fed And Bank Regulators

All together now. The Fed has been printing too much money for too long and Biden restricts fossil fuel production. Ad in rampant Federal spending and we have INFLATION. Inflation led to The Fed to raise rates. And with rate increases and down go the banks.

Of course, The Fed and Biden Administration will overeact (e.g. offering deposit insurance on ALL deposits above $250,000 creating moral hazard risk). As such, we are seeing gold prices soar by 2% this AM.

In adddition to gold rising 2%, natural gas futures are up 6%

Dazed And Confused! Treasury Flows Show Bullish $2.5 Billion Shift to ST Sovereigns Versus S&P 500 (Credit ETFs Hammered by Record Outflows of Almost $12 Billion As Fed Worries About Inflation)

The Federal Reserve is dazed and confused about inflation.

As The Federal Reserve reaffirms their draining of the monetary punch bowl, we are seeing investors flock towards the bond market. Particularly the iShares Short Treasury ETF. $2.5 BILLION to be exact.

Meanwhile, credit ETFs are hammered by record outflows of almost $12 Billion.

The reason why? Inflation remains elevated which is leading The Fed to keep their foot on the monetary brake pedal.

I’m an economist.

Uh-oh! January Personal Consumption Expenditures Soar 1.8% MoM, PCE Deflator UP 5.4% YoY, 2-year Treasury Yield Rises 10 Basis Points (Here Comes The Fed!)

Not really a surprise, but January’s personal spending numbers came in hot at 1.8% MoM. Also, Personal Consumption Expenditures PRICE index (aka, inflation) rose to 5.4% YoY.

Here comes The Fed! The 2-year Treasury yield rose 10 basis points this morning.

Pelsoi and Schumer (with McConnell) got the gold mine and American consumers got the shaft.

Summertime Blues! US Treasury 3m30y Curve In Bear Steepening Mode, Indicating A US Recession By Summer 2023

The US economy has a case of the summertime blues.

Bull steepenings in the yield curve are generally seen as a precursor to a recession, but they are often preceded by bear steepenings. The 3m30y curve is currently bear steepening, indicating a recession could begin as early as the summer. In fact, the 3m30y curve is now inverted at -94.628 basis points pointing to a recession in summer 2023.

This is happening as the US house payment to income ratio near all-time highs.

Terminal Velocity! Fed Implied Terminal Rate Now 5.363% At July ’23 FOMC Meeting As US GDP Report Revised Lower On Weaker Consumer Spending In Q4 ’22 (GDP PRICE Index Revised UP To 3.9%)

Yesterday, we saw The Federal Reserve release the minutes of the last meeting. In a nutshell, The Fed is going to keep raising rates.

The terminal Fed Funds target rates is now 5.363% for the July FOMC (Fed Open Market Committee) meeting in 2023.

This comes as US Q4 GDP was revised lower on weaker consumer spending, revised downward to 1.4%

With the revision of Personal Consumption, real GDP was revised downward to 2.7% annualized QoQ.

The Taylor Rule estimate for The Fed Funds Target rate is 10.15%. The Fed is only at 4.75%, so there is a long way to go! Except that The Fed doesn’t follow any useful rule like the Taylor Rule. Just the “seat of the pants” rule.

Don’t Be Misled By The Low US Unemployment Rate, It Goes Low Just Prior To A Recession (Treasury Curve Remains Deeply Inverted, Mortgage Rates Rise)

Biden’s State of the Union address saw him bragging about his record job creation (actually, it was the private sector, not Biden than created jobs) and historic unemployment rate. What Biden didn’t mention (along with not discussing the porous Mexican border with fentanyl pouring across or why he failed to shoot down a Chinese spy balloon until after it has passed over numerous military reservation) is that the unemployment rate always hit a low point just prior to a recession.

So, here we sit at 3.4% unemployment. But we also see the US Treasury yield curves (10Y-3M and 10Y-2Y) remaining deeply inverted.

The US Treasury 10-year yield is up 5.5 basis points today.

And Bankrate’s 30-year mortgage survey rate is up slightly today.

Happenings Two Months Time Ago! US Case-Shiller National Home Price Growth Slows To 6.77% YoY In November As Fed Retreats (Down -0.54% Since October, 5th Straight Month Of MoM Price Declines)

The Case-Shiller index is out for November 2022. Too bad it is January 31, 2023. Call it “Happenings 2 Months Time Ago.”

On a year-over-year (YoY) basis, the Case-Shiller National home price index slowed to 6.77%. On a month-over-month (MoM) basis, the CS National index fell -0.54%. That is the 5th straight month of home price declines.

In REAL terms, the Case-Shiller National home price index is up only 0.58% YoY as REAL Weekly Earnings growth is negative at -3.1% YoY.

Only San Francisco fell on a YoY basis (down -1.6%). Five metro areas were above 10% and they are all in the South. Atlanta, Charlotte. Dallas, Miami and Tampa.

On MoM basis, every metro area in the Case-Shiller 20 index saw price declines from October to November.

Another sign of a crumbling market.

Fed Mission Accomplished? Fed Funds Target Rate Rises Above Inflation Rate As M2 Money Growth Sinks To -1.3% YoY (US Consumers Have Lost $4 Trillion In Real Disposable Income Under Biden)

The Federal Reserve’s Open Market Committee (FOMC) is meeting on Wednesday. What will they do?

First, The Fed Funds Target (upper bound) is above the Core US inflation rate YoY. Second, M2 Money growth YoY has slowed to -1.3%.

Of course, the members of the FOMC might decide that this is not enough and may keep raising rates and shrinking The Fed’s enormous balance sheet.

In the “Haven’t they suffered enough?” arena, US real disposable income has fallen by -21% since Biden was sworn-in as President.

On the other hand, the Taylor Rule is still pointing to a target rate of 10% (we aren’t even half way there at 4.50%).

Oh and the price of insuring against a US debt default remains elevated (since Biden and Schumer are baving like arrogant bullies) and are refusing to negotitate over spending cuts.

The 1Y CDS volatility cube indicates that it will all be over soon.